A click heatmap is a type of heatmap that is invaluable for B2B digital marketers.
Occasionally referred to simply as a heatmap, this tool lets you identify the visitor experience, pinpoint roadblocks, and boost conversions to create an optimized website.
What is a Click Heatmap?
A click heatmap is a visual representation using thermal imaging that tells you where visitors are clicking, and Crazy Egg’s Scrollmap shows where visitors stop scrolling. You can also see which form fields are being filled out and where visitors are getting hung up on their way to converting. While there are different types of heatmaps, including hover and scroll maps, a click heatmap lets you see exactly where visitors are clicking (or not clicking) across the page.
The Importance of Click Heatmaps
You are encouraged to install and use click heatmaps if you want to maximize the visitor experience. Click heatmaps are visual data images. With click heatmaps, you can’t see the mouse movements, but you can see the pattern the visitors make with their click patterns—the traditional F-patterns and Z-patterns.
With click heatmaps, you can learn from your audience on a massive scale to determine the ideal website visit and experience. You can also see how your visitors react using Crazy Egg’s session replays or video recordings that show the mouse movements and click heatmaps.
For example, if your visitors are only filling out two of four form fields before bouncing, you can shorten your form requirements for a conversion boost.
Website Optimization
There are many areas where click heatmaps can help you maximize the visitor experience.
One of those areas is the all-important first Impression. If your visitors are landing and there are no clicks or scrolls before they bounce, you’ll know that something’s wrong with your colors, layout, headline, images, or some other element.
Each element should then be A/B tested to keep visitors onsite and interacting with your site.
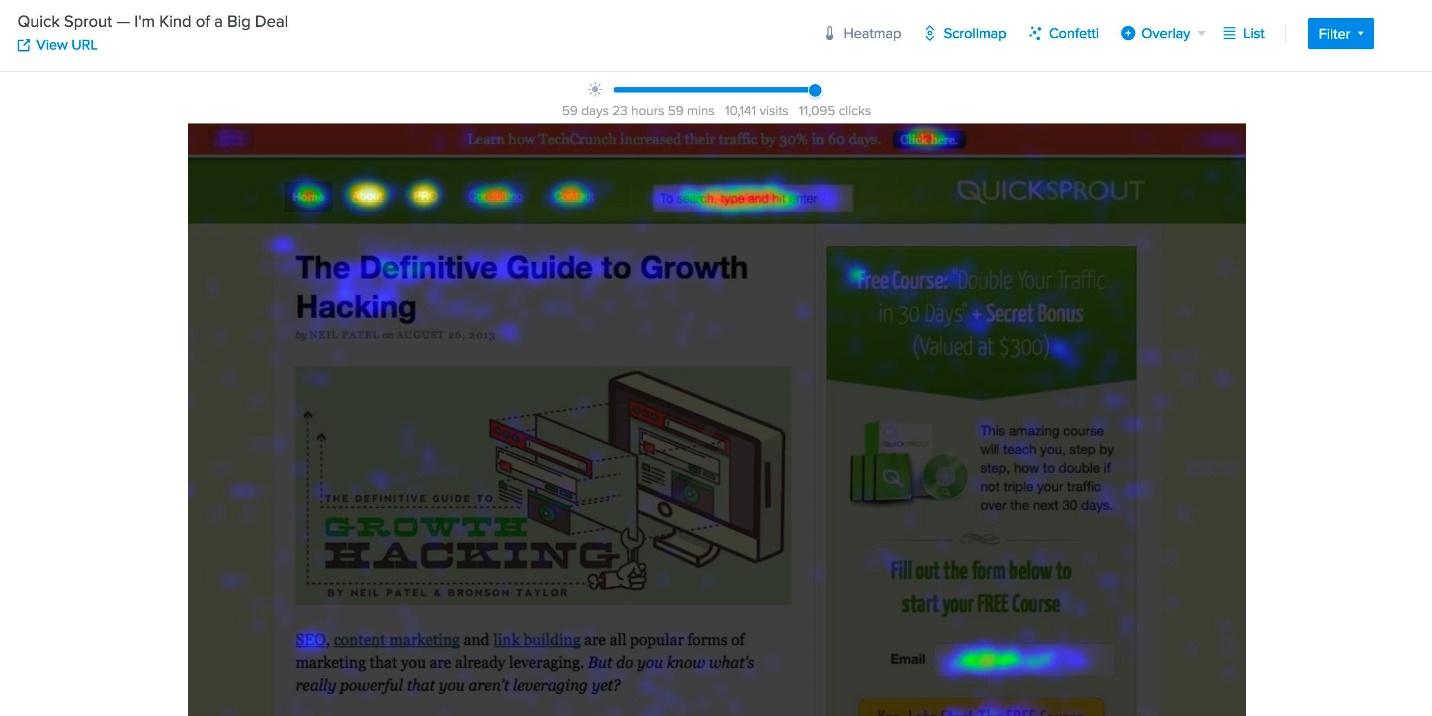
Click Heatmap Example
At Crazy Egg, there is a feature called a Snapshot which provides you with 6 different types of visitor reports. One of the reports is called the Confetti Report and allows you to segment your clicks by your audience groups or referral traffic. Another is the traditional click heatmap that uses thermal imaging, so the brighter the color, the more frequent the activity on a specific element.
Isn’t it interesting to see that visitors are clicking on headlines, especially if your headline isn’t interactive? This is one opportunity where you can turn that headline into a link to boost conversions. That’s just one example of the visitor insight you can gain with this incredible digital marketing technology.
How to Create and Analyze a Click Heatmap
While there are many different services offering click heatmaps and click maps, it’s important to find a provider who is experienced, have all the features you need, and actively builds out their product offerings. Doing so will allow you to take advantage of the team’s training behind the heatmap and analytics platform and to be sure that they grow with your needs.
If you’d like to give us a try, we’re actually the innovator of click heatmap technology. By signing up for our 30-day free trial and adding a bit of code to your site, you’ll have click heatmaps at your disposal to analyze and improve your site over time.
Clicks and Scrolling Behavior
When you sign up with a heatmap tracking provider, you will have access to website click tracking reports. These reports are paramount if you want to know whether your most valuable converting pages are attracting the most attention. You can determine where visitors are clicking the most and where they’re hardly clicking at all.
This data can help you optimize your site including your navigation menu. If one menu item gets less attention than the others, you can remove it or change the label to see which one performs better.
You can determine which CTAs are getting clicks and which ones aren’t so that you can optimize those areas like experimenting with the copy, color, and layout.
You can also see where visitors aren’t clicking where they’re supposed to like in blanks spaces or on non-interactive elements.
In a way, you get to look over your visitors’ shoulders to see how they’re interacting with your site, which is critical data you can use for website improvements.
Click Tracking Tool
Click tracking software lets you see where your visitors are clicking, what they’re scrolling past, and which buttons they’re interacting with. You can see if visitors are reading down the page as they’re supposed to and where they’re scrolling only to bounce mid-way. You can see this information in what’s called a scroll map.
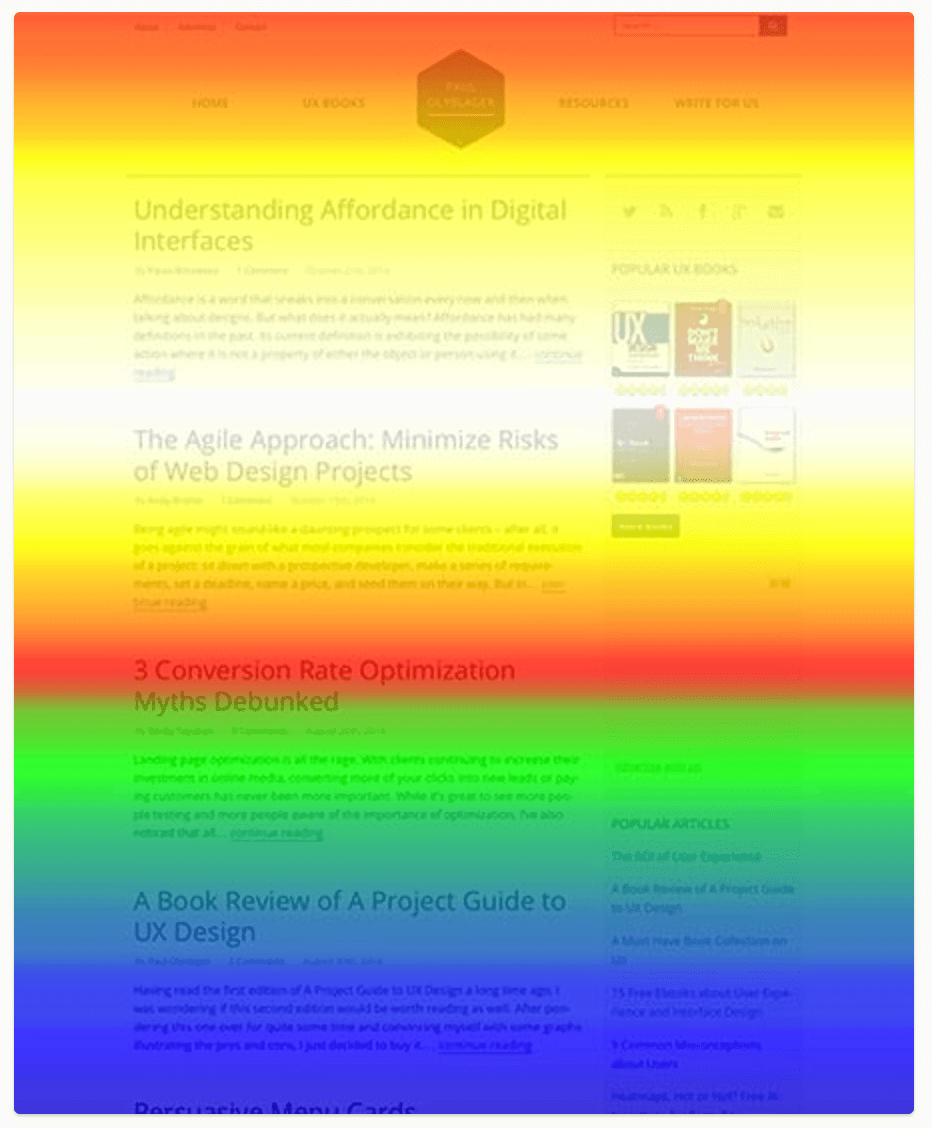
Scroll maps are ideal for testing the average visitor’s attention span. You can see if your web copy is effective or if it’s boring your visitors to death.
You can see if your pages are too long or where your website elements aren’t keeping your visitors’ attention as they should.
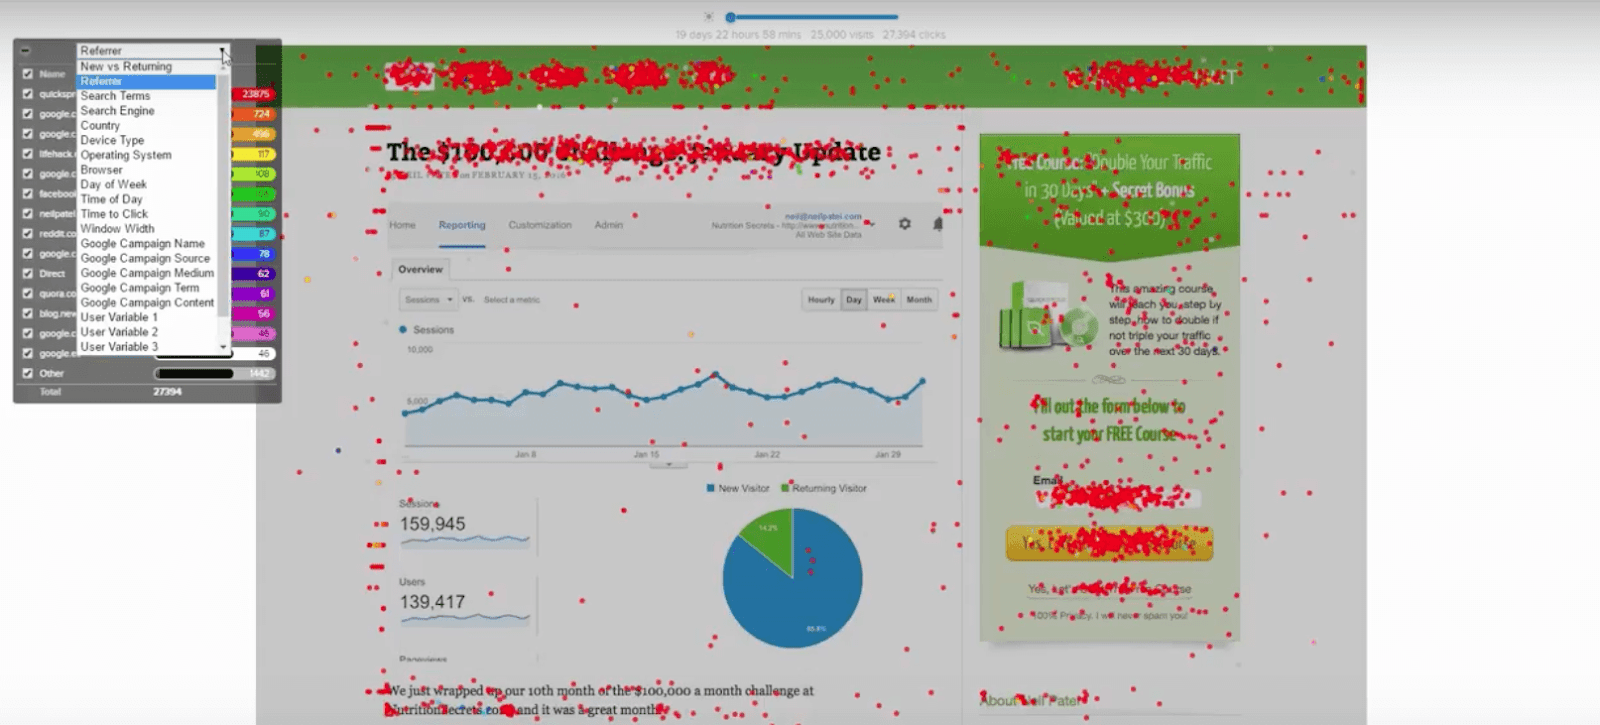
Then, there are Confetti Reports.
A Confetti Report is an additional tool that shows you all the mouse click points for any given page segmented by features like browser, referrer, and ad campaigns. While click heatmaps aggregate click behavior, a confetti report shows actual clicks.
Seeing where visitors click can give you even more data for improving your site’s headlines, images, layout, and more, especially since you can find out how different segments respond to your site. You can determine where visitors click for no reason, allowing you to place clickable items there to push visitors further through your conversion funnel.
Using these tools, you can even determine the exact click breakdown of each element on your page along with audience segments, giving you insights you can’t always get from Google Analytics. You can identify where problems may occur, allowing you to fix them in order to remove any obstacles.
With enough data, you’ll soon know how to develop a website that is efficient, informative, intuitive, and tailor-made for your buyer persona.
Size of the Sample
One question digital marketers often ask when installing heatmaps for the first time is how big of an audience sample you need to get the most accurate and relevant data.
The answer is, it depends. If you’re not attracting many visitors, heatmaps are still useful but you may also benefit from watching visitor recordings (aka session replays). The more traffic you get, the more you’ll be able to glean the most valuable visitor data.
The exact amount of traffic your site needs depends on the type of site, the number of conversion funnels you’re currently employing, and the type of conversion funnels you’re tracking.
It would help if you also were cognizant of time, as the time of day may affect the amount of data you receive with session recordings and click maps. Your click heatmap click data may be different from season to season, as well. For instance, ecommerce websites may get more visitor data in November and December, when people are shopping for their nearest and dearest. This is where a tool like the Confetti Report can come in handy since you can actually segment the audience by the time of day and day of the week to find the most valuable times to launch sales and pop-ups.
This requires you to know your audience.
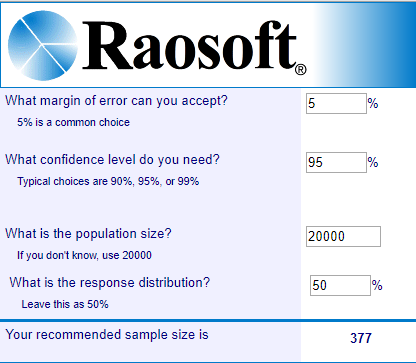
If you’re one of those that needs hard data, you can use Raosoft’s sample size calculator.
Once you set the margin of error and confidence level, you’ll enter the population size and the response distribution to collect a hard figure you can use to gather the best data.
Consider Devices
Many click heatmap users don’t realize that your heatmap data may be different with desktop versus mobile users.
Mobile users tend to make deliberate actions, so you may get a better view of how visitors go from the initial landing to the ultimate conversion. Also these heatmaps and click maps may help you spot issues in your responsive design. Checking to see if your website is really responsive or if there are UI bugs in the mobile view is one of the benefits of using any type of click map.
The lesson is to analyze your visitor data according to desktops, handheld devices, and tablets. By optimizing your site to match the needs of those with the tiniest of screens, you won’t alienate any of your audience, and you’ll be more likely to experience a conversion boost.
A/B Testing
Crazy Egg and other website heatmap providers allow you to A/B test various website elements so you can achieve maximum optimization.
Imagine you employ click heatmaps on your website and you notice that visitors aren’t clicking on your call-to-action button.
Using A/B testing, you can send out two versions of the web page to your audience. By keeping the CTA the same on one version and altering the button on the other, you can determine which test sample performs better, either A or B.
You can try changing the button’s color or the verbiage inside. A/B testing can help you boost your conversions with real-life visitor data, just like click heatmaps. Used together and these tools can supercharge your website for the most visitor interactions and conversions.
Key Tips for Click Heatmap Analysis
Are you ready to put heatmaps to work for your website? Are you ready to learn more about your visitors, their behavior, and how they experience your site? Keep these tips in mind as you use click heatmaps and A/B testing to get the most from your website.
How to Boost your Traffic
To ensure your data is accurate, have patience and allow the clicks to generate, and the data to come in. Check your click maps weekly or biweekly to see if there have been any shifts in data.
One way to make sure that your getting useful data from your click maps is to boost your visitor traffic. You might try ramping up your Google SEO efforts and PPC ads.
However, no matter your amount of traffic, click maps and visitor recordings can help you. The mere act of installing a click heatmap tool on your website could give you the key to more leads and sales. If you’re looking to improve subscription rates, click heatmaps can help with those types of conversions too.
Simply find a heatmaps provider and you will get valuable data and insights visually! This data will arrive on one or more thermal reports and represents data you really can’t get any other way.
You can peer into your visitors’ experience, monitor their behavior, and understand their needs to deliver the best user experience possible. Heatmaps, scrollmaps, and other reports like the Confetti Report can help you improve your site for even greater revenue and return.
Understand Your User Behavior with a Heatmap Tool
Heatmap tracking lets you delve into the motivations of your visitors. You can determine if they like your site and if they’re following your intended buyer’s journey. You can also tell when they don’t like your site or when your conversion funnel is too cluttered and confusing.
When visitors see something they like, such as a headline, they may click on it. Images that warrant clicks are typically the most attractive. If you use scroll maps and you notice that visitors only get halfway down a page before bouncing, you may need to shorten your website copy or make it stronger.
If you notice that visitors are pausing in an area of the page with no button, you know what to do. A call-to-action button placed in that location may boost conversions.
Heatmaps Example
It’s understandable to want to know how click heatmaps work before you commit.
You can see an example of click heatmaps in action by viewing this video by Crazy Egg.
In that video, you can see how click heatmaps work and all the variations of the reports, from click maps to scroll maps and more.
Take Advantage of Crazy Egg Features
As the first innovator of click heatmaps, Crazy Egg has managed to develop an all-inclusive heatmaps, visitor recordings, and A/B testing tool that can be used for all websites in any industry.
Crazy Egg offers a 30-day free trial. By signing up, you will receive immediate access to all of the features including what’s called a Snapshot that gives you access to five click map reports. By adding a bit of code to your site, you’ll be well on your way to collecting visitor data.
Once you begin receiving data, you can view your reports any time. This means you can start looking into your visitor behavior right away. You can see where they click and scroll.
You can determine where visitors are bouncing and where they’re lingering in order to read your killer website copy.
Once you have enough relevant data, you can then begin A/B and multivariate testing your website elements until you find the one that’s ideal for you.
With click reports, scrollmap reports, and confetti reports, along with ongoing A/B testing, you’ll be able to continually improve your site in untold ways.
If your conversions are currently suffering, click heatmaps can let you know what’s wrong and help you improve. While heatmaps can give you the data necessary to give you a boost, taking that information and A/B testing over time can help you achieve maximum interactivity and conversions, scaling your business and expanding your bottom line.
The Bottom Line
Click heatmaps are invaluable tools for digital marketers to use. Instead of surveying your audience and crunching massive amounts of boring data, you can finally see how your visitors are interacting with your site
You can see where they click, scroll, and take other actions. This is data that can’t readily be gleaned from other sources. And yet, this data can help you immeasurably improve your site.
When you begin experiencing enough live traffic, you can determine which headlines get the most interactivity, which images are the most attractive, and which calls-to-action buttons get the most clicks.
Using this data, you can develop a website that is perfectly targeted for your audience. The best part is that the data doesn’t come as mere numbers on a report. There’s no math involved or spreadsheets. Instead, you get to see the visitor experience in real time, especially if you also watch visitor recordings (aka session replays).
Using click maps, visitor recording sessions, and A/B testing, you’ll soon have the information you need for a precision-targeted web marketing campaign.
Your optimized website awaits, and Crazy Egg click maps can make that site a reality. Get Crazy Egg today by signing up for the free 30-day trial and put our 6 visitor tracking reports to work for you.


