I know of people who obsess over a single website KPI and use it alone to make decisions. That’s a little hardcore for me.
I’m like most everyone else, who has about 5-7 website KPIs that I really care about. This allows me to focus on activities that impact growth, and ignore the noise.
What is a Website Key Performance Indicator?
A website KPI (key performance indicator) tells you whether your site is doing well according to goals you’ve set.
Let’s back up for a second. The term KPI is used widely in business, and regardless of the industry, it is always:
- Measurable, like clicks, signups, or dollars.
- Tied to a concrete business goal, like revenue, sales, or retention.
- Bound to a particular timespan, like weeks, months, or year-over-year
- Impacted by changes you make, like new designs, messaging, or pricing strategy.
A website KPI can be a simple metric that directly measures activity on a website, such as unique website visitors, conversions, or average time on page.
It may also be a composite metric, which references multiple data points, such as conversion rate, average order value (AOV), or Core Web Vitals.
Essentially, a website KPI is a metric that holds a tremendous amount of importance to your site. You can look at that single number, or how it is trending, and know immediately whether your site’s performance is stable, improving, or falling off a cliff.
Website KPIs should help you (and anyone else who works on your site) establish a clear connection between your online efforts and your business goals. Then, you can use them to make data-driven decisions for your organization.
Ultimately, the real goal is to read these metrics as levers, not just outcomes.
If you can figure out how to drive AOV, for example, it will almost certainly make your website a more profitable channel for business.
A billion dollar website KPI example
Reddit makes money through advertising, so we can assume that one of the brand’s KPIs is organic traffic, which measures the number of visitors who arrive on their site via search engines like Google and Bing.
If we take a quick peak at the organic traffic growth on Reddit over the last decade, we can see that it grew steadily to a few hundred million sessions each month. Then, sometime around 2023, Reddit shot up to 1 billion sessions per month, and then just as quickly over 2 billion.
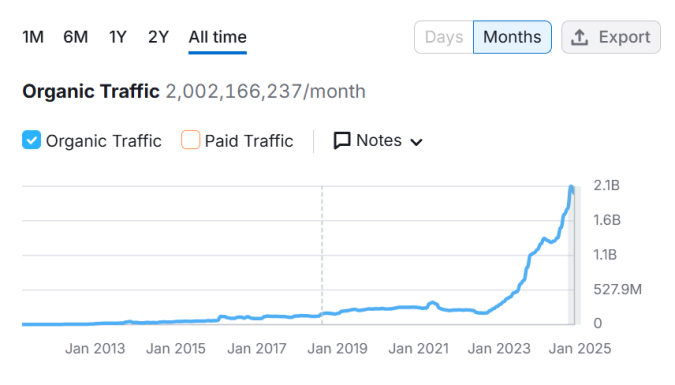
From 2023-2024, which captures the steepest part of this insane growth curve, Reddit increased revenue by more than 61% to $1.3 billion.
It’s easy to draw a direct line between the growing number of users on Reddit every day and the advertising dollars rolling in. Not every website KPI is as clear cut, and of course, there are plenty of other factors impacting Reddit’s bottom line.
But this is a truly great example of how connected a single website KPI can be with real-world business results.
What’s the difference between a website KPI and a website metric?
Put simply, website metrics are just measurements. They are data points that record activity on your site.
Website KPIs are a select few metrics that are worth tracking because they tell you how your site is doing relative to a particular goal.
For example, if my goal is to get people to sign up for an email list, I am going to care a lot about the conversion rate. In this case that is the percentage of new people signing up compared to the total number of impressions, i.e. the people who saw the offer to sign up on my site.
Why?
Because the conversion rate tells me how effective the email signup offer is. If the conversion rate goes up, the same amount of traffic to the site is generating more leads. This is a healthy indicator, especially when you are paying for traffic.
When the conversion rate is going down, it usually means there is something to worry about. People might not be finding what they want, there might be some friction in the signup flow, or maybe my site’s messaging is stale and the market has moved on. Probably time to update that lead magnet.
And that’s the beauty of defining a website KPI. It tells you when the other data are worth looking into. Things like page-views and video engagement could be important, but only if the conversion rate starts to slip.
Day-to-day, I can look at the traffic and conversion rates on hundreds of different webpages in a single report, and know immediately whether there is something to address.
I literally cannot track every single website metric. I don’t want to have to think about the nitty-gritty details unless I have to. With a good set of KPIs, I can monitor performance quickly and dig deeper if I have to.
Quick note: When I talk about conversion rate, I am always talking about the rate on an individual page. I am never talking about a blended, average, or site-wide conversion rate. I think it is rare for that measurement to tell you anything useful.
How Can A Website KPI Be Helpful?
Put simply, it allows you to ignore a ton of data on your site and lock in on the handful of metrics that can actually help you improve your site’s performance. Here are some of the ways that a KPI can be used on your site:
- Compare performance across assets. You can use KPIs to quickly analyze the relative performance of different landing pages, pricing pages, and so on.
- Establish clear thresholds. A website KPI lets you say, this landing page has to convert at 4.5% to be profitable, or we need to drive average order value up 10% by the end of the year.
- Track progress over time. Website KPIs makes it easier to establish baselines and spot legitimate trends.
- Keep people on the same page. Well defined KPIs mean that everyone knows what success looks like. Marketing and sales won’t bicker (as much) over different metrics.
How Can A Website KPI Be Misleading?
The risk of putting a ton of weight on a website KPI is false confidence. You can get misled by incorrectly analyzing a sound website KPI, or by selecting one that isn’t actually a good indicator of your site’s performance. This often happens due to:
- Loose or vague definitions. “Engagement” or “brand awareness” sound good, but unless they’re tied to a specific, measurable outcome, it’s going to be impossible to track progress or drive results.
- Lack of context. A long time on page might mean visitors are fascinated by your content. Or, they could be confused and struggling to find what they need. Without context, you don’t know.
- Vanity metrics. Likes, shares, and impressions are easy to pump up. But they don’t pay the bills if they don’t connect to customers or revenue.
- Lack of a baseline or timeframe. A 5% conversion rate might sound strong, but if last year was 7%, or your site isn’t profitable under 6%, then this is no good.
How to Select Effective Website KPIs
Focus on metrics related to factors that are essential to your company’s success. There’s a ton of data available to you in platforms like Google Analytics 4 (GA4), but not all of it has a clear tie to important goals like leads and sales.
So as you select your types of KPIs for website traffic, aim to limit them to 5-7 key metrics that are most directly related to your business objectives. After all, not every metric on your site can be a “key” indicator of performance.
Plus, this would take entirely too much time to read and analyze every time you want to see how your site is performing.
Once you’ve selected these KPIs, you’ll want to use them consistently throughout your team and reporting strategy. Using the same metrics is the best way to gauge improvement over time, and will ensure that everyone who works on your site is working towards the same goals.
On the flip side, your KPIs should not focus on data that isn’t actionable. If you’re spending time analyzing your site, you want to make sure that you’re gaining insight that will help you make impactful changes.
Your KPIs also shouldn’t be entire reports. Although accessing these reports in platforms like Google Analytics is simple in theory, they still require digging through tons of data.
Instead, select single metrics that make monitoring your progress a straightforward task. Stakeholders and clients will be grateful you highlighted the key data, and didn’t make them put a bunch of meaningless numbers in their head.
Check out this post on how to create a dashboard in GA4 to track what matters to you.
The Most Common Website KPIs
All of these metrics are closely linked to the health of a site, its growth trajectory, and how efficient it is at turning traffic into revenue.
Almost every business keeps a close eye on these indicators:
- Traffic growth
- Conversion rate
- Customer acquisition cost
You’ll definitely see variations of these KPIs for different website types, and you may want to tweak one of them yourself.
Here’s a close look at each one, why it’s so important, and some of the key considerations for using each website KPI to effectively guide your business decisions.
Traffic growth
Almost every business wants to see traffic on their site increasing over time. One, it’s a super healthy indicator of business success: more people are deciding to come and visit your site.
All things being equal, more traffic means that efforts to raise awareness and build interest in your brand are working. Those goals are very hard to track, whereas traffic growth is a concrete, measurable data point that tools like Google Analytics 4 (GA4) automatically track for every single page of your site.
Notice that the KPI is not simply website visitors. It’s growing that number over time. A sudden spike in growth or decline could be important, but ultimately, long-term traffic growth is what people really care about.
If you have ever looked at a report that shows website traffic, then you know it fluctuates wildly. Because of the day-to-day traffic volatility, most businesses look at the trend over weeks and months. The traffic on many websites plummets on the weekends, and it’s totally normal, no big deal. For other sites, weekend traffic is the primary driver of revenue. The better you understand your specific business model, the better you can fine-tune your tracking.
Here are some tips for thinking about how to track traffic growth as a KPI:
- Use rolling 28-day windows. Traffic varies heavily by day of the week, so comparing the last 28 days to the prior 28 gives you a cleaner view than standard month-over-month (MoM) reporting. For example, March has three more days than February, for example, which can skew MoM results if you don’t normalize.
- Account for seasonality. Compare traffic from the same month year-over-year (e.g., March 2025 vs. March 2026) to understand true long-term growth trends.
- Segment by channel. Total traffic doesn’t tell you where growth is coming from. Organic growth points to SEO wins, while social or branded search growth shows your brand awareness is expanding.
- Tie traffic to value. Calculate conversion rates or customer lifetime value (CLV) by channel to see which sources are most profitable. This helps you direct marketing spend where it will have the greatest impact.
- Check new vs. returning visitors. A rise in new visitors suggests effective acquisition, while a healthy base of returning visitors points to loyalty and engagement. Together, they give you a fuller picture of whether growth is sustainable.
Tools like GA4 can be super helpful for figuring all this stuff out, but they do require a good amount of setup and babysitting. Tools like Crazy Egg allow you non-developers to do deep traffic analysis, looking at different traffic sources, new vs. returning visitors, and more.
Conversion rate
The conversion rate compares the number of people who visited your site with the number of people who completed a key action, such as signing up for a newsletter, downloading your app, or making a purchase.
The raw number of conversions (like signups or purchases) is important, but looking at it in isolation creates blind spots in your analysis.
For example, if traffic is up, but signups are flat, it suggests your offer isn’t effective with the new people who are showing up. If you only looked at the conversions, you’d think that nothing has changed, even though your offer isn’t resonating with the same percentage of people.
Or signups could be going up or down along with the ebbs and flows of your website traffic. Just looking at conversions can trick you into drawing the wrong conclusion about how effective your offer is (or not).
The conversion rate, on the other hand, takes traffic into account and helps me judge whether the offer is performing well or not. I don’t have to dig into the other metrics that lead up to this point, unless there is a problem.
Here are some tips for thinking about the conversion rate and using it as a website KPI:
- Track conversions for the most important key action on your site by defining it as a “key event” in Google Analytics 4.
- You should also track conversions for other key steps in your website funnel. While these conversions and micro conversions might not be website KPIs, they will be helpful for figuring out where users are getting stuck along their journey to becoming customers.
- Look at the corresponding conversion rates when you segment traffic by source, which will help you figure out which channels have the highest lead-quality.
- Figure out what is a good conversion rate for your business, and ignore general benchmark data. Even where people have put together great data from your specific industry, those “industry averages” could be completely off for your site. Plus, there’s a world in which you could reach or exceed the market average and still be unprofitable based on your specific business model.
Customer acquisition costs (CAC)
There’s no such thing as free traffic, and if your site is in a competitive category, it’s going to cost real time and money to get people to your site. Even where you are leaning hard on SEO and organic social traffic (as opposed to paying for traffic), you are spending money publishing content, maintaining social accounts, and strategizing about what to push next.
CAC helps you quantify those efforts and compare them to the value of the customers you’re bringing in.
- Include all acquisition costs. Factor in salaries, tools, content creation, and agency fees. Ad spend is easy to track, but you want to get as accurate a picture of the true costs as possible.
- Compare CAC to customer lifetime value (CLV). A healthy business usually spends much less to acquire a customer than that customer generates in revenue. If this relationship starts to invert, you will have profitability issues quickly.
- Find your most efficient channels. Segment CAC for paid search, organic, social, to figure out which channels have the best ROI. This can help you allocate marketing budget and more accurately forecast growth.
Goal-specific Website KPIs
The major determining factors in defining an appropriate website KPI are your business goals, and so I have broken down the remaining metrics by goal to help you zero in on what’s truly important.
Most people will end up picking several of these to use as KPIs for their site. The rest of the metrics are still important, but they will serve supporting roles. Depending on what you learn from your top-level website KPIs, you may have to dig into one of these secondary performance indicators to figure out how to fix or optimize your site.
Revenue
Revenue is the ultimate goal for nearly every business, and so it’s always always top of mind. But revenue is impacted by too many things, some of which are outside your control, to be a silver bullet KPI. There are a handful of website KPIs that online stores and other revenue-generating websites use to get additional context:
- Customer lifetime value (CLV)
- Re-purchase rate
- Average order value (AOV)
- Abandoned shopping cart rate
- Revenue per session
These metrics all serve as useful signals that show where you can push for revenue growth. If CLV or re-purchase rate is low, it could mean customer retention efforts like loyalty programs deserve attention.
A stagnant AOV points to opportunities in upselling, bundling, or revisiting pricing strategy. A high abandoned shopping cart rate probably indicates some friction in the checkout flow, or that too could be a pricing issue (high shipping costs, for example, are a classic reason people abandon carts).
Many brands focus on CLV above all else. If they can drive that number higher, chances are they are doing a good job getting building brand loyalty, keeping acquisition costs down, converting traffic, and so on.
Lead generation
For businesses that need to fill a pipeline, website KPIs revolve around lead volume and quality. Here are a few of the most KPIs for lead generation:
- Form conversion rate
- Cost per lead (CPL)
- Lead-to-customer conversion rate
- Time to conversion
Each KPI tells you a little bit about how your site is performing, and points to a different lever in your funnel that you can use to improve your lead flow.
A low form conversion rate, for example, suggests issues with design, copywriting, or friction in the form itself. Time to conversion can be similarly helpful in alerting you to problems with email nurturing campaigns and ad retargeting efforts.
But even on a landing page that is specifically designed for lead-gen, it’s not enough to just look at the raw number of leads. Quality matters, and tracking CPL and lead-to-customer conversion rate ties website activity to actual sales. This is the only way to understand whether or not this channel is going to drive revenue.
If CPL increases too much, for example, or the lead-to-customer conversion rate falls, it’s going to get harder to turn a profit.
In those cases, you could drive the form conversion rate through the roof, and it still might not result in a good business outcome. Where you are paying for traffic, you really need to keep a close eye on CPL, breaking it out from overall customer acquisition cost in order to figure out which channels are your best for filling your pipe.
Search engine optimization (SEO)
The goal of SEO is to drive high-intent traffic to your site by increasing your brand’s visibility on search engines (like Google and Bing) so that it is easier for more people to discover your products. These metrics are crucial for understanding whether or not you are gaining traction with the right people:
- Organic sessions
- Keyword rankings
- Backlink growth
- Organic click through rate (CTR)
- Appearance in AI-generated summaries
These KPIs show whether your site is discoverable and competitive. Organic sessions (that is, traffic from search engines) and keyword rankings measure visibility. Backlink growth tells you how many other quality sites are linking to yours, which is a sign of authority and long-term durability in search.
Organic CTR tells you if your titles and meta descriptions are strong enough to win the click. If your organic CTR is climbing in competitive keywords, it’s a strong signal you are doing a lot of things right.
SEO tools like SEMRush (pictured below) tell you where your site and pages rank in search engines like Google and Bing, how many backlinks you have (plus their relative authority), and even assign an overall “Authority Score” for your site.
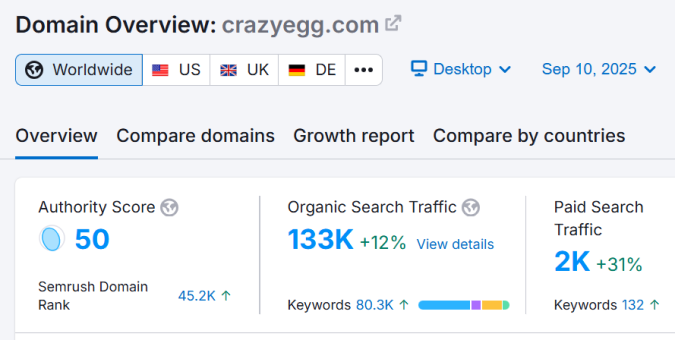
Are more and more of your pages showing up for the searches you care about? Are you outranking competitors for important keywords?
And now that all the major search engines are using AI-generated summaries, tracking your appearance in those features has become a KPI in its own right. These AI-overviews are siphoning lots of clicks away from traditional ranked search results (and paid search).
It’s still the early innings of AI search, it looks like visibility in AI overviews is going to be crucial moving forward.
While there are SEO tools to help you keep tabs on this, they are imperfect as of yet. It’s hard to fault the tools here because Google et al. are constantly changing the rules. And it’s hard to fault them because the technology is still emerging.
For now, you can read Google’s best practices for how to succeed in the age of AI search, which basically boils down to their traditional guidance: create content that humans love.
Technical performance
A site that loads quickly and runs smoothly directly impacts both user experience (UX) and search rankings. In super competitive markets, you may really need to focus on this, but even a local small business website can’t afford to be too slow or janky. Technical performance KPIs focus on speed and reliability:
- Page load speed
- Core Web Vitals (CWV)
- Uptime
- Error rate
For this category of website KPI, you safely defer to the industry benchmarks most of the time.
For example, if your page load speed is under two seconds, you are probably fine. If Core Web Vitals are comfortably in the green, there’s probably not too much to be gained from driving those numbers higher.
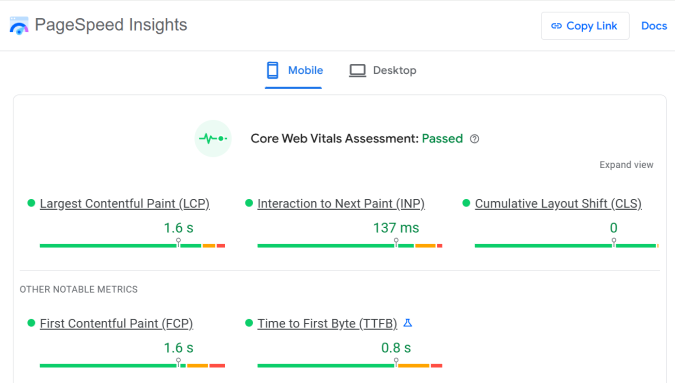
You can always check CWV scores on PageSpeed Insights, a free tool from Google.
Again, in highly-competitive markets, every millisecond of load time counts, but any website that neglects technical performance will eventually find out that it’s upstream of every other KPI.
If users encounter significant downtime, tons of glitches, and broken links to 404 pages, it won’t be long until no one is coming to your site.
Brand awareness
This is the most ambiguous category of website KPIs where you really have to define your goals well in order to achieve meaningful success. What does it mean for your efforts to make your brand more visible, credible, and memorable? The most common brand awareness KPIs come as close as possible to measuring your brand’s reach:
- Direct traffic
- Branded search volume
- Social referral traffic
- Mentions and share of voice
- Impressions
These metrics are not perfect, but they do provide some of the best possible indicators of whether or not you are raising brand awareness.
Direct traffic and branded search growth are clear signs that people know your name and seek you out intentionally. You can track direct traffic via basic web analytics, and good SEO tools will automatically track branded vs. unbranded search volumes.

Social referrals and mentions track how far your message is spreading outside your own channels. There are social listening tools and social media management tools that can help you track and improve these metrics.
While these aren’t technically website KPIs, they help you answer questions about how well your message is spreading and whether it is resonating with your target audience. Insights here will be crucial for refining the content on your site.
The brand awareness KPIs that are most important to you will depend heavily on your strategy. For example, if you are trying to boost SEO traffic, a decline in branded search could be a good sign that you are successfully getting in front of an audience that doesn’t know you yet.
Engagement
Many of your customers are going to engage with your site multiple times before they actually take action. Engagement KPIs help you figure out if they are finding value and what holds their attention. Here are some of the customer engagement metrics that different brands use as KPIs:
- Average session duration
- Pages per session
- Scroll depth
- Bounce rate (or engagement rate in GA4)
- Repeat visits
It is very difficult to pick a single engagement metric to function as the key performance indicator. There’s no direct line between revenue and how long people spend on your site or how many pages they visit per session.
Worse than that, positive engagement metrics don’t always mean good things.
You can easily imagine customers getting confused on a site, looking for help, and leaving frustrated after wasting their time. Obviously that’s a terrible outcome, but their session duration is long, they visited tons of pages, and scrolled all over the place.
Despite all of these risks, it’s imperative to use engagement metrics alongside your other website KPIs.
Something like the bounce rate functions as an early warning sign for your site’s overall health. If it drops steadily over the course of a few months, there’s a strong possibility that your content isn’t matching expectations. If it drops all of a sudden, there is probably a technical issue.
Repeat visits can tell you a lot about whether or not people are finding value. Same with scroll depth, which you can measure with scroll tracking tools. It’s just harder to use these metrics as levers to influence business outcomes, like growth and revenue, which means they don’t always meet the requirements of being a true KPI.
I think pure engagement metrics function best in a supporting role. They provide very necessary context for interpreting KPI’s, for figuring out where people are struggling on your site or finding value.