Marketers today have a lot of website optimization tools to choose from. And, while we’d love to work with every team out there, we know our web optimization platform isn’t perfect for everyone in the world.
That’s why comparing us with other tools (including Hotjar and FullStory) is an important step in choosing your web optimization solution.
Here’s the bottom line, in our view:
- Crazy Egg is the best option for intermediate and advanced marketers and conversion rate optimization (CRO) pros
- Hotjar is best for more beginner-level marketers
- FullStory is the best option for support and user experience teams.
Below, we break down the features, integrations, pricing, and more that led us to each of those assessments.
Note: Rather see for yourself than read a comparison? Sign up and trial any of our plans — it’s completely free for 30 days.
Crazy Egg vs. Hotjar vs. FullStory Features
All three tools we’re comparing here offer heatmaps, but there are additional features at play that vary between them — including the level of depth in each heatmap. Here are the features that stand out for Crazy Egg vs. Hotjar vs. FullStory, along with example use cases of those features.
Crazy Egg Features
Here at Crazy Egg, we’re crazy (pun intended) about heatmaps — or, as we call them, Snapshots. In short, Snapshots show you an overview of how people interact with a given webpage. Our tool offers five different types of Reports:
- Heatmap Reports
- Scrollmap Reports
- Confetti Reports (our signature report)
- Overlay Reports
- List Reports.
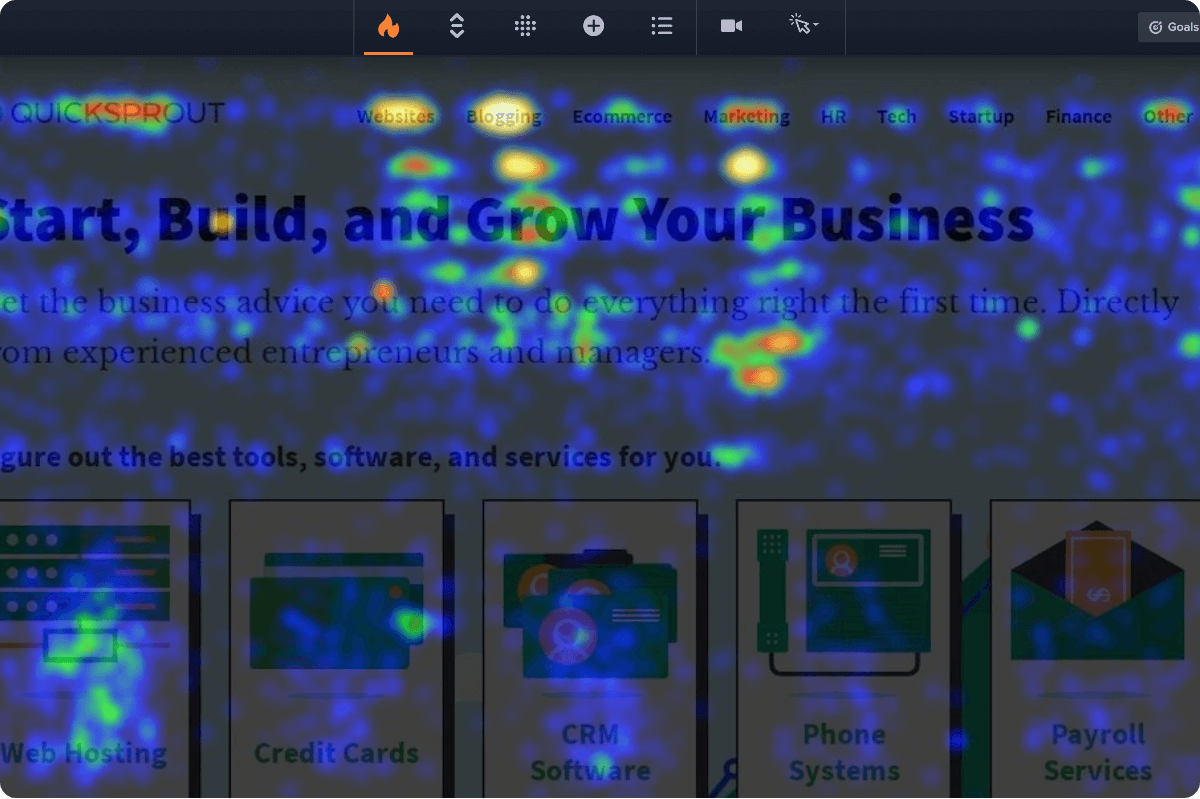
Heatmap Reports
As the original heatmap software, our Heatmap Report quickly shows you where people are clicking on your webpage. In addition to showing you which aspects of a page draw the most interest from users, heatmaps can also help you diagnose and test solutions for common conversion problems.

For example, if visitors aren’t clicking on your CTA, you can use heatmaps to compare results before and after changes in positioning, copy, color, and more. Heatmaps have a ton of uses, as more than 300,000 customers over 14 years can attest to:
- Seeing which navigation, filter, and sort elements on ecommerce sites are getting the most use
- Determining which elements visitors engage with the most. Plus, whether those interactions are purposeful clicks (such as clicking on a CTA) or are they unpurposeful clicks (like clicking in dead space). Clicks in dead space, for example, can highlight confusion on the part of visitors or indicate that they’re searching for more information.
- Getting a general overview of what’s happening on the page—are the clicks highly concentrated or spread out?
Scrollmap Report
Scrollmap Reports show you how far the average user scrolls down a page — including the most common scroll depth.

Knowing that information can help you identify the optimal length for a landing page, ensure important information isn’t too far down the page (where no one sees it), and find the sweet spot for buttons, forms, opt-ins, and other CTAs.
Confetti Reports
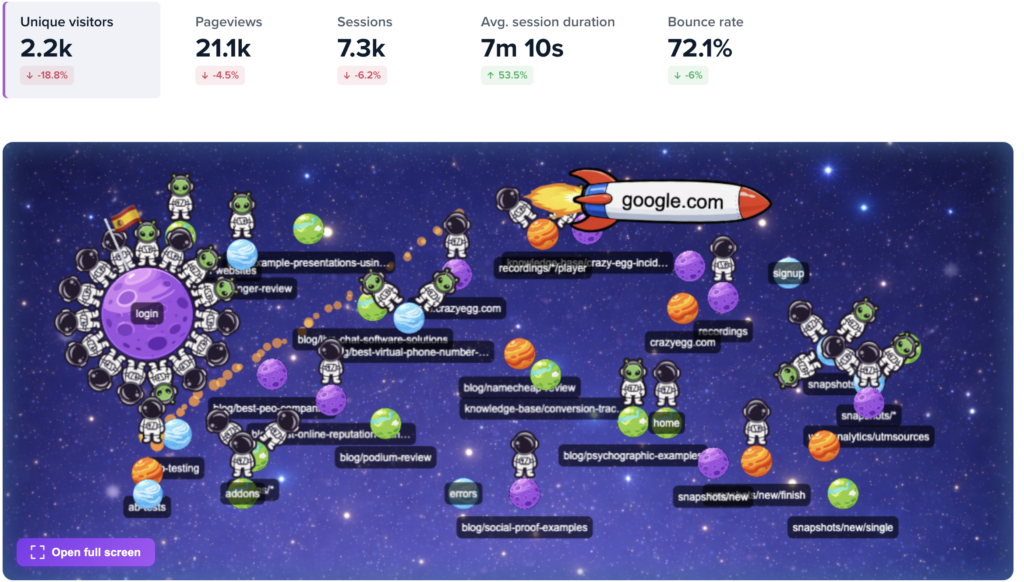
Our Confetti Report is incredibly powerful and something only Crazy Egg offers. It gives you a more granular look at where people are clicking on your website. It shows individual clicks segmented by helpful factors such as referral source, geography, operating system, and more (including any custom UTM parameters you create).
Without the Confetti Report, traditional heatmaps show only aggregates. They take all of that useful data and average it together to show you an overview of click behavior — which means you miss out on vital context.
Our Confetti report is all about adding context and breaking that down to see who is doing all that clicking. Each dot represents a click, and the color denotes how those clicks break down.

For example: In the screenshot above, we’re looking at how all the clicks in the report break out by referrer. As you can see, most of the dots are red — meaning they came from Quicksprout’s website.
By looking at the Confetti Report through the lens of each referring source, you can determine whether users who came from an email campaign behave differently than those who arrived via Google search results.

Here’s another example: In the screenshot above, we filtered to see only the clicks from users located in India. We’ve heard from some of our customers that they used the country filter on their Confetti snapshots to identify new potential markets to target. Those new markets yielded 15-16% revenue growth after the first year for one of our customers.
In all, our Confetti Report offers 22 filters (shown below) through which you can view click behavior data. You can look at click behavior for new vs. returning visitors or break it down by device.

Notably, custom UTM campaigns are included in those available filters — so you can break out click behavior across all of the UTM campaigns defined on your website. That means you can see, for example, whether the messaging of a particular PPC campaign affects where or how often the resulting visitors click on the landing page.
Website Overlay Reports
Overlay Reports tell you what specific number of clicks and percentage of total click behavior occurs on each element of your webpage—that’s in addition to the more relative click frequency data shown in traditional heatmaps.
By clicking on the (+) markers, you can see the exact number of clicks an element received, plus what percentage of total clicks on the page that number represents.

Overlay Reports can also tell you where users are clicking because they expect a link when there isn’t one.
For example: In the screenshot below, there were 53 clicks on “common problems marketers and business owners.” Five times as many people clicked on that text as clicked on the actual link on “getting higher conversion rates.”

That tells us that the visitors this blog post attracts are more interested in common problems faced by marketers and business owners than in increasing their conversion rates. Knowing that means you can better optimize the blog post to meet visitors needs and to keep them moving through your website.
Similar to the Confetti Report, you can break down all of this information across 22 different filters, including referring source, new vs. returning visitors, device, and more.
List Report
Our List Report is designed for the numbers-oriented crowd. We track everything on your page, and that includes all clicks, whether visible or non visible elements. The List Report shows you the raw numbers of clicks on each element of a page.

List Reports are one of the ways our Snapshots can help color some of the data you might find in a tool such as Google Analytics.
For example, Google Analytics might show that a particular webpage has a high exit rate. By running a List Report on that page, you can figure out why — you can see where those users are clicking to leave the page and adjust the link available, if necessary.

Another example involves form abandonment. While Google Analytics can tell you how many people submitted a form, our List Report can show you how many people clicked to start filling it out but didn’t submit.
Other Unique Features
In addition to our Snapshot reports, there are a few other things that set Crazy Egg apart. For one, we think we’ve built a tool that strikes the ideal balance between visuals and numbers.
Our software tracks every visitor to your webpage, then gives you the option to sample your data as needed. Hotjar automatically samples your data — based on their predictive modeling — before it’s even collected.
So, for example: Let’s say Hotjar predicts you’ll get 20,000 visits in a day and you’ve selected their 10,000 daily pageview plan. Hotjar will record data from roughly 420 pageviews each hour (10,000 daily pageviews, divided by 24 hours a day). That means you should have data based on 10,000 visits at the end of the day.
But, if your traffic spikes at noon and you get 8,000 of those visits in an hour, Hotjar will still only record 420 of them—so you end up getting only a tiny sample of the visitors in that busy hour recorded. That’s less than ideal since, in this scenario, you’d want to focus most of your tracking and analysis on that busy hour, when most of your traffic (and likely sales) happen.
The last difference we’ll mention has to do with A/B testing your website. Our tool is the only one of the three that offers built-in A/B testing — but we also offer customers the flexibility to continue working with their existing A/B testing software (more on this when we get to integrations).
Hotjar Features
Hotjar also offers heatmaps, scrollmaps, and live session recordings, among other features. But there are two features of Hotjar’s that really stand out: surveys and funnel analysis.
Both features are built right into the product, and we appreciate the simplicity and visuals of their funnel analysis tool. If you aren’t sure where to begin heatmap testing, the conversion funnel analysis can be helpful in visualizing the funnel and figuring out where the most people drop off.
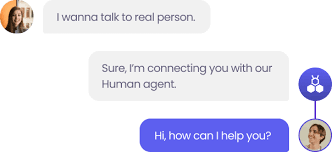
The survey feature helps add a qualitative level to your website data. While Crazy Egg integrates with SurveyMonkey to accomplish this, there’s something to be said for getting both features in one package.
FullStory Features
Since FullStory’s product is targeted a little differently, their tool places more emphasis on sessions recordings over heatmaps or snapshots of a web page. User recordings make it easier to actively troubleshoot situations with a particular visitor, and they enable you to monitor a user’s entire interaction history with your website.
One quick note about using FullStory: Both Crazy Egg and Hotjar are GDPR-compliant tools — we don’t track individual users. FullStory, however, does track individual users, and it’s the responsibility of those using FullStory (that would be you) to either inform website visitors and comply with GDPR rules or to manually switch this tracking off.
Crazy Egg vs. Hotjar vs. FullStory Supported Integrations
The ability to work seamlessly across the rest of your marketing and user experience stack is one of the most important must-haves for a website optimization tool. At Crazy Egg, we get that. That’s why we’ve added more than dozen built-in integrations, including:
- Google Tag Manager
- HubSpot
- Optimizely
- Shopify
- Squarespace
Plus, you can use our simple script to add Crazy Egg to any app that accepts third-party scripts.
Hotjar, on the other hand, doesn’t offer any built-in integrations. That said, you have the flexibility to manually add Hotjar’s script to apps that accept it.
FullStory offers more than a dozen pre-built integrations, geared more toward the support, UX, and product management crowd. They include:
- Drift
- Help Scout
- Mixpanel
- Salesforce
- Slack
Similar to the other two tools, you can also manually integrate other tools with FullStory.
Crazy Egg vs. Hotjar vs. FullStory Pricing
The all important question: How much do these tools cost? With all the factors that pricing is based on (from sessions to storage to features), it can be hard to compare plans directly. For that reason, we explain each tool’s basic pricing model and share the plans they offer.
Crazy Egg Pricing

At Crazy Egg, our pricing model is pretty simple. As you go up, plans are designed to allow customers to track more pageviews and record more sessions. To that end, we offer four primary pricing plans, plus a fifth option to build a custom plan just for you.
Here are our packages:
- Basic: $24 per month
- Standard: $49 per month
- Plus: $99 per month
- Pro: $249 per month
- Custom.
We also offer a 30-day free trial that’s available on all four of our pricing tiers.
Hotjar Pricing

Hotjar has some of the simplest pricing structures on our list. That said, there are quite a few plans to choose from. They offer three types of plans: Personal, Business, and Agency. Within those, the main factor that changes is the number of pageviews you get per day.
Here are the packages they offer within the business group of plans:
- 20,000 pageviews/day: $89 per month
- 50,000 pageviews/day: $189 per month
- 120,000 pageviews/day: $289 per month
- 400,000 pageviews/day: $589 per month
- 800,000 pageviews/day: $989 per month
- 2,000,000 pageviews/day: Contact Hotjar
They also offer a Basic Free Forever plan and a 15-day trial on the higher-tier plans, too.
FullStory Pricing

FullStory’s pricing model is the toughest to compare side-by-side with Crazy Egg and Hotjar. Their plans differ based on the features included in each: Enterprise or Business. Beyond that, pricing data isn’t openly available, so you’ll have to contact FullStory for more detailed pricing info.
FullStory does offer a free plan that gets you up to 1,000 pageviews per day, plus a 14-day free trial of their Business edition.
What Customers Are Saying
At Crazy Egg, we have some really happy customers, and we’re sure Hotjar and FullStory do, too. We think those customers often tell the story best, so we’ll let them take it from here.
What Our Customers Are Saying About Crazy Egg

“Crazy Egg has offered us the missing piece to our website analytics. Not only do we understand how visitors interact with our clients’ websites, but we also can understand what needs to be changed on the websites to create a better user experience.” – G2 review

“If you need to figure out which elements of a web page are getting clicks, and measure versions against one another, Crazy Egg is the answer.” – Jay Baer, Convince and Convert

“We use Crazy Egg to improve our performance with our ad campaigns (mainly Google Ads), and we use it to inform our team on various site improvements we can make over time to fight off stagnation.” – G2 review
What Hotjar Customers Are Saying

“The recordings are the most useful tool on Hotjar…you are able to see how users interact with your website. Specifically, you can follow along with their user journey through video, seeing clicks and movement.” – Kristen D. on G2

“We like to make people happy on reed.co.uk and Hotjar shows us how well we’re doing.” – Brett Orr, reed.co.uk

“I really like that it’s very easy to use, even my clients learn how to use Hotjar because of its simplicity. User recordings are very useful to report to clients that are unaware of their UX designs.” – Carlos I. on G2
What FullStory Customers Are Saying

“Our ability to troubleshoot and hunt down bugs has increased substantially since implementing FullStory.” – G2 review

“If I was an investor, I would give FullStory all my money. Just saved me tons of time debugging a customer issue.” – Mike Champion, HubSpot

“We use it for supporting our customers on a daily basis. We can see what changes were made and where the changes were made.” – Fred R. on G2
Wrapping Up
As we said from the outset, we know Crazy Egg isn’t the right website optimization tool for every company or person out there. The features, integrations, pricing, and customer reviews above are why we believe:
- Hotjar is best for beginner-level marketers
- FullStory is the best option for support, product, and user experience teams
- Crazy Egg is the best option for intermediate and advanced marketers and CROs.
We’re really confident that more experienced marketers and CROs will fall in love with what we have on offer. Namely:
- Our robust and detailed Snapshots
- Full data collection and sampling flexibility
- Flexibility to use our built-in A/B testing or integrate with your favorite tool.
If that sounds like just what you’ve been looking for, come give us a try. We offer a 30-day trial, completely free, that works on any of our pricing plans.