


See the raw data with List Report
Crazy Egg’s inherently all-visual reports have a raw-data report balance.
Free 30 day trial • Cancel anytime
For those of you who don’t like color-coded data visualizations and prefer number data, we haven’t forgotten about you.
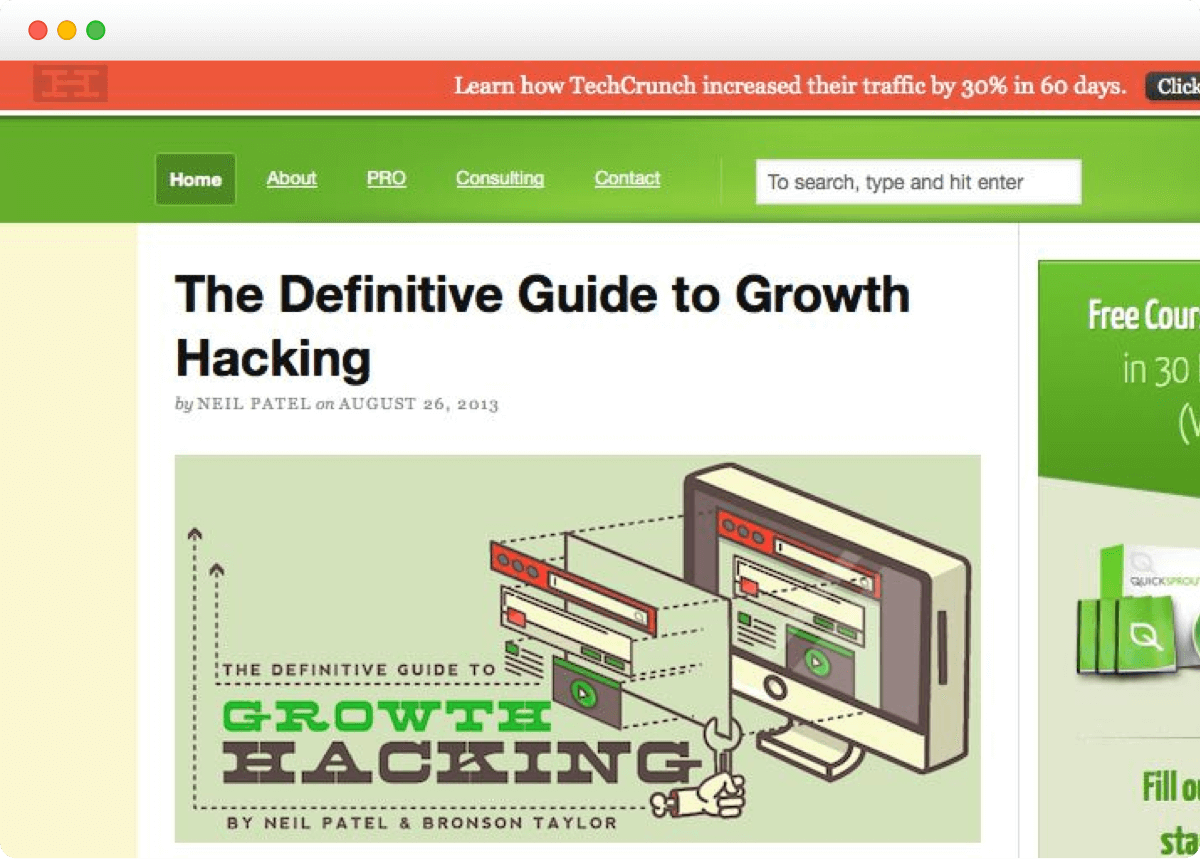
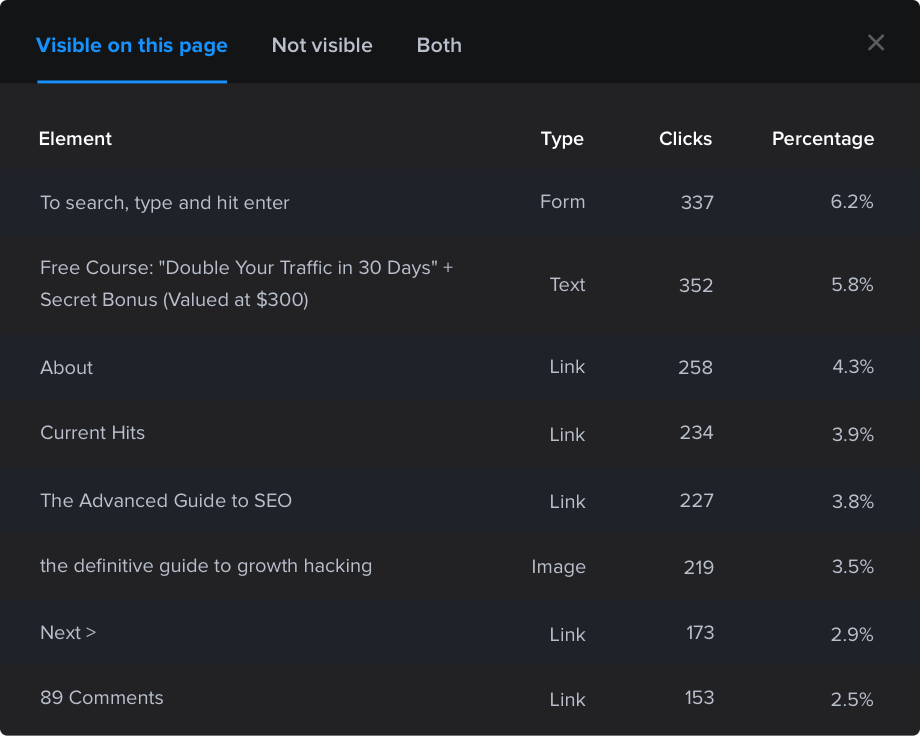
The List report displays every click on a web page in a tabulated format. That way you can know the exact breakdown of what page elements are being clicked on. No guessing, just exact numbers.

Do your visitors prefer to click on links or buttons?
Sometimes these subtle design preferences, once understood, can make huge impacts on your bottom line. The List report exposes these patterns numerically - so there’s no question as to what your most popular page elements are.
Know if visitors are clicking on moving page elements
Moving page elements, such as pop-ins and elements that scroll with the page, can be difficult to analyze with traditional heatmaps. The List report tells you exactly which elements are getting clicked on, regardless of how they move.


Sometimes you just need to see the numbers
Do you just want to know how many times people clicked on and around one of your web pages? The number alone is a good measure of page engagement. Compare one page to other pages to see how much more or less visitors interacted with it.