Web analytics tools help you figure out what’s working on your site and what needs to be improved right away. They take messy data, make it easy to understand, and enable you to make smarter decisions.
Most tools make you work hard before they tell you anything. Crazy Egg is an exception. It’s our top pick because you’ll get useful answers faster than anything else on this list, no web developer required.
The Top Web Analytics Tools: Our Top Three
Looking for a quick answer? The best of the best we found each have a particular strong suit.
Crazy Egg: Best Overall — It’s free forever web analytics that lets you see where users are struggling and start fixing it. Perfect for SMBs without the technical staff required to babysit the heavier analytics tools.
Amplitude: Best for Enterprise Product Teams — When you need a deep understanding of what users are doing across your sites and apps, this is a strong pick. The setup requires expertise, but PMs can do great work once you’re up and running.
PostHog: Best for Developer-Driven Teams — Self-hosting is an option with this feature-rich platform that’s ideal when you need complete control over their data. Cut down on the number of tools you need by centralizing analytics and experimentation under one roof.
Crazy Egg: Best Overall
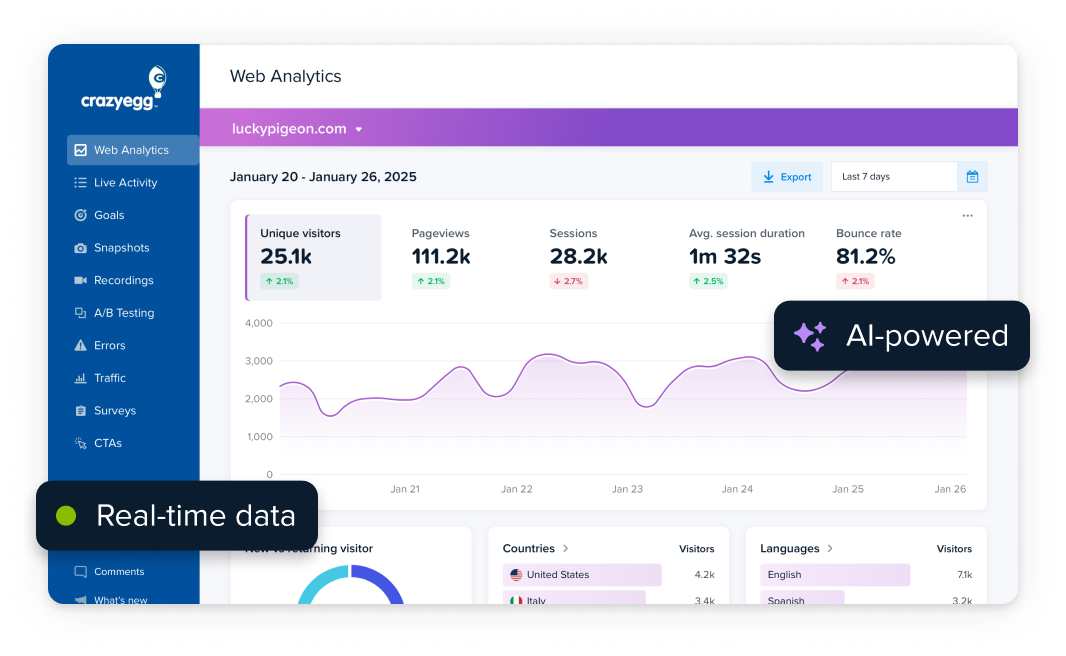
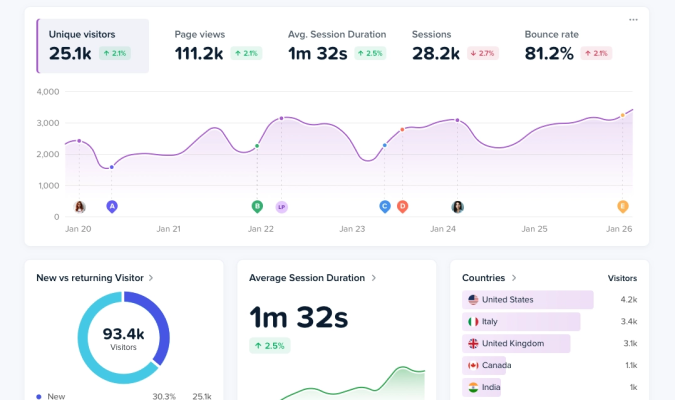
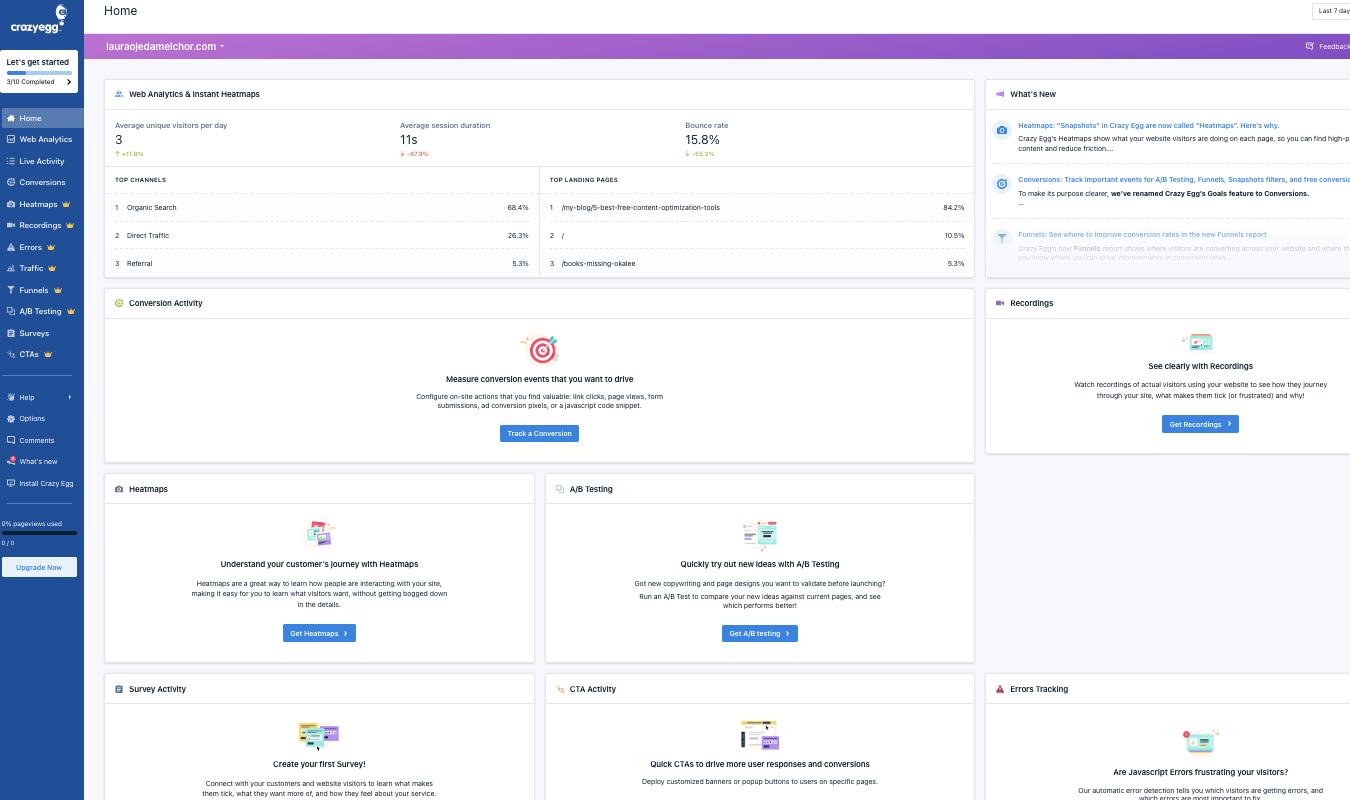
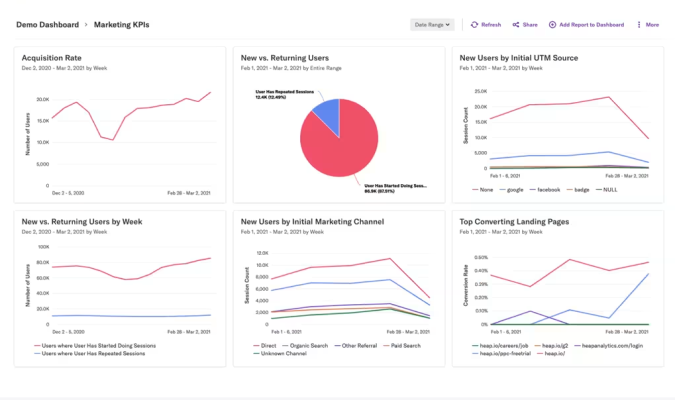
Crazy Egg has been around for 20 years, offering an approachable set of tools for web and behavioral analytics. Founders, business owners, and marketers can start using the platform without any training or web dev experience.
If you want to get those “aha!” moments of insight without writing code, this is definitely the web analytics platform for you.
The installation takes a few minutes. Just copy and paste a code snippet and you are ready to rock. From there, Crazy Egg will immediately start collecting data and reporting it in the most user-friendly web analytics dashboard of any platform I reviewed.
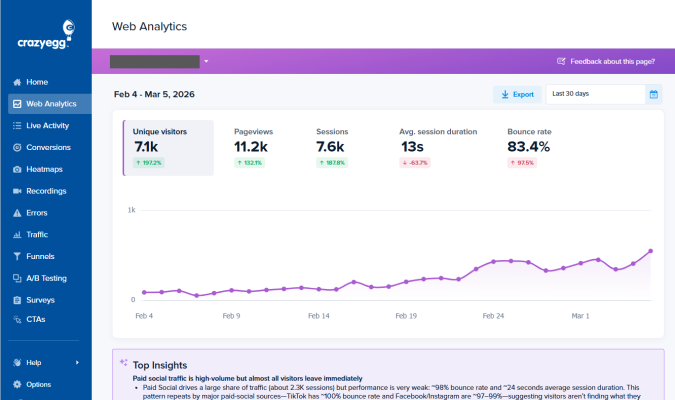
All of the reports are ready to go as soon as you log in. There’s zero complex configuration necessary to start viewing the most important metrics on every page.
You can also integrate Google Analytics 4 so you can use the simplified Crazy Egg dashboard to analyze your website instead of the trainwreck that is GA4. The integration process is three steps, all point and click. You don’t have to leave your GA4 data behind, but you can forget the hassles of that platform.
Once you’re set up with the free version of Crazy Egg, you can enable conversion tracking, website surveys, and view instant heatmaps. Paid plans come with deeper behavioral analytics tools, like session recordings, clickmaps, and scrollmaps.
Conversion tracking is very straightforward. There are no complex settings or workflows required to make sure you are tracking signups, form fills, and other valuable actions on your site.
As the data come in, AI-generated insights will appear highlighting the most important trends and patterns of activity on your site. It even suggests specific next steps. These automated insights are a time-saver for experienced users and a godsend for beginners who are still trying to figure out what to pay attention to.
Crazy Egg doesn’t have some of the analytic depth that tools like PostHog or Heap can offer, but the tradeoff with those tools is the technical setup required. There is no need for developer assistance with Crazy Egg, which holds true even when you are using the more advanced tools like session recordings, error tracking, or A/B testing.
Crazy Egg is cloud-hosted, with no option to self-host. It’s GDPR, CCPA, and HIPAA compliant and will sign a data processing agreement upon request.
In terms of a no-cost web analytics tool that “just works” off the shelf, Crazy Egg is the obvious choice for people who want the same balance of ease and power that Google Analytics used to offer.
Amplitude: Best for Enterprise Product Teams
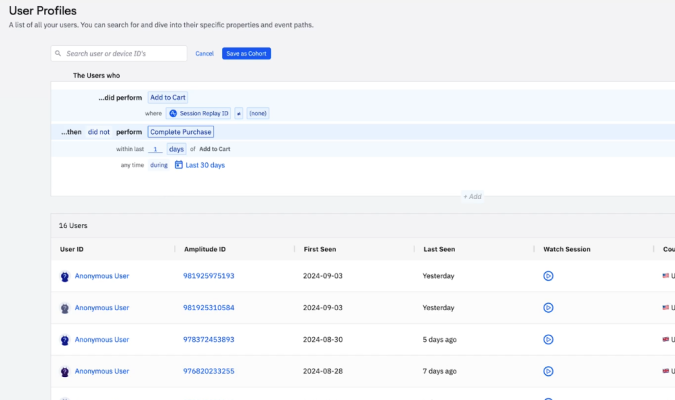
Amplitude is a great option for large organizations that want detailed web and product analytics across the entire customer journey. You can understand what users are doing, why, and set up tracking around any event that you think matters to your business.
The learning curve is steep. Amplitude assumes someone comfortable with events, properties, and data taxonomy is going to invest the time necessary to set everything up and keep it organized moving forward.
Once you are set up, PMs and technical marketers should be able to get answers on their own once they know their way around the interface. Whereas a tool like PostHog assumes technical self-sufficiency, Amplitude does a better job making the tool accessible to a wider range of users. And what they can discover is quite deep.
You can follow a specific user from their first visit through every action they took, which features they adopted, where they dropped off, and when they came back. You can group users who behaved similarly into cohorts, compare them, and even run experiments using these custom-defined groups.
The built-in experimentation capability is one of the features that separates Amplitude from other tools in the space, which only handle A/B testing via third-party integration. If your teams run experiments consistently, they’ll be able to launch tests and analyze results within a single platform instead of jumping between tools or cross-refencing multiple spreadsheets.
Amplitude is cloud-only, there is no option to self-host. So while it carries the standard enterprise security certifications, there is no possibility of full data ownership.
You’ll definitely want dedicated analytics and data people managing this tool. Amplitude rewards teams that put time into setup, training, and keeping their event tracking consistent as the product evolves. For large teams that can make this investment, it’s one of the most capable platforms in this category.
Explore popular alternatives to Amplitude, or how it compares to Mixpanel.
PostHog: Best for Developer-Driven Teams
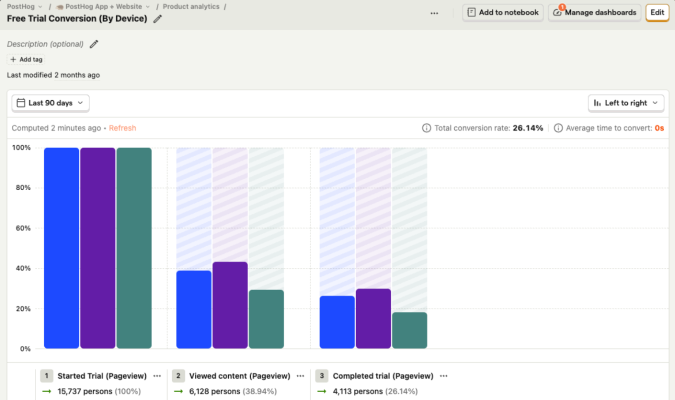
PostHog is an open-source product analytics platform aimed at engineering and product teams that want full control of their data. If you are tired of integrating multiple tools to capture the data you want to track, then this might be the tool for you. It combines analytics, session recording, error tracking, feature flags, A/B testing, and surveys, into one platform.
Fewer vendors to pay, tools to connect, and a single place to go for answers. This pretty much sums up the appeal.
PostHog claims that they “make dev tools that help product engineers,” which is honest. This is not a tool you want to hand off to a non-technical marketing team. They would struggle.
Setup requires a good deal of technical investment, and getting value out of PostHog requires attention from people who can write code, troubleshoot issues, and query data directly.
While there are no-code features that make routine event tracking and analysis accessible to more people (once everything has been configured), the platform is definitely aimed at folks with a technical background.
The payoff is that you can do things with PostHog that you cannot do with other analytics platforms. You could answer the question, “Which users who saw the onboarding flow last week completed a purchase and what errors did they encounter along the way.” In most other setups, you’d need 2-4 separate tools to figure that out.
You could also tie feature flag experiments directly to customer retention outcomes, or see how errors affect conversion rates in real time.
For teams with strict privacy or regulatory requirements, PostHog’s option to self-host is worth serious consideration. Your data never has to touch a third-party server. Paid plans store up to seven years of historical data. PostHog is HIPAA compliant and willing to sign a BAA.
The free plan is generous, as it covers up to one million events per month. Just bear in mind that what you save in licensing costs you wind up spending in developer salaries.
If you are looking for basic visibility into user behavior, traffic acquisition, or simple conversion tracking, this is probably overkill. They do offer a barebones web analytics platform aimed at marketers, but it’s pretty limited. If that’s what you are after, one of these alternatives to PostHog might be a better fit.
But for technical teams that want to centralize a sprawling analytics tech stack in a single tool, there’s really no better option.
Check out this head-to-head comparison of Amplitude vs. PostHog.
Mixpanel: Best for Cross-Functional Product Teams
Mixpanel is designed for a wide range of people to be able to use. As powerful as it is, the interface is easy to navigate and does a great job connecting low-level user activity to business objectives.
Getting everything set up is a little more challenging than the lighter tools on this list, but once event tracking is in place, PMs, marketers, and growth teams will have a clean set of tools to answer their most pressing questions in a few clicks.
The learning curve with Mixpanel is moderate. It’s more difficult for non-technical users than something like Crazy Egg, but more approachable than Amplitude or PostHog.
As an event-based analytics platform, you’ll be able to track and understand how users interact with your web and mobile apps. See where traffic is coming from, and follow individual users through the entire customer journey.
Teams decide which events are important, define the key moments, and then get reports and real-time dashboards to investigate user behavior. With a few clicks, users can analyze specific segments or cohorts, and track how key metrics change for them over time.
Mixpanel helps different teams work together with features like Metric Trees, which tie strategic goals to the product actions that drive them.
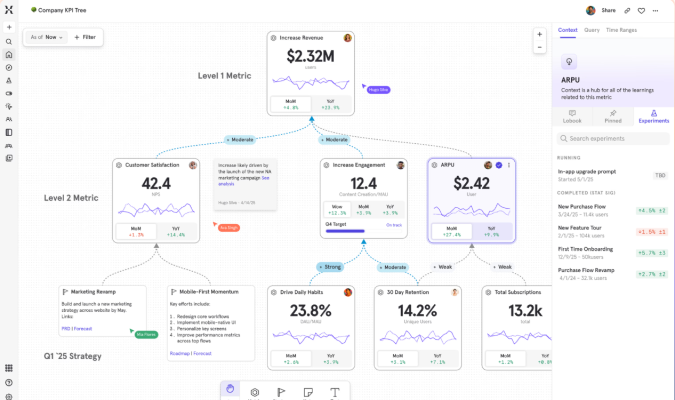
Product, marketing, and engineering can get a sense of how the metrics they are responsible for wind up influencing overall performance and topline growth. From there, teams can make adjustments on their own or use the 100+ integrations to push these insights into campaigns, experiments, and workflows.
On the privacy and compliance side, Mixpanel offers the standard security guarantees and role-based access controls you would expect, leaving it up to organizations to meet specific regulatory requirements for user tracking. There is no option to self-host.
Check out this full-length review of Mixpanel or how it compares to PostHog.
Heap: Best for UX-Focused Brands
Heap is a product analytics platform that helps companies track and improve the customer journey. For more than a decade, Heap has tried to free analytics from being dependent on developers.
The goal has been to make web and product analytics data as accessible as possible for UX designers, marketers, and PMs, so they can figure out what users crave and what’s getting in their way.
Take autocapture, for example. You install a code snippet and Heap will record every click, pageview, form fill, and swipe from that point on. Instead of having to figure out what you want to track ahead of time and set that up manually, Heap captures it all, letting you answer questions using the captured historical data.
With other tools, you can’t go back and look at metrics unless you manually tracked them ahead of time. It’s not even possible. This ability to run retroactive analysis is a big selling point for Heap.
The risk with tracking everything is that, without a solid upfront plan for data governance, your reporting will be a mess. There’s also a real risk of data bloat, where you end up paying a fortune to capture and store everything.
There is definitely a learning curve for teams that use Heap. PMs have to understand Heap’s virtual event system, which doesn’t work the same way as similar events-based analytics platforms.
But once people are up to speed, they’re not going to need as much dev support as is expected with a platform like PostHog, especially if they want to conduct some sort of retroactive analysis, which might not even be possible on those platforms.
Beyond analytics, Heap includes session replay, heatmaps, and Journey Maps, which visualize the path users take through your site or product. There are also useful AI features that identify interactions correlated with conversion or churn, which can be really helpful for teams trying to make UX improvements.
In 2023, Heap was acquired by Contentsquare, a digital experience analytics platform. The combined product moves toward a fuller picture of the UX, with easy to connect experience monitoring, voice of customer tools that bring qualitative data into view.
Heap is cloud only, with no self-hosting option. It’s got the standard set of security certifications and compliance controls, which you’ll need to configure. There is a free plan, but bear in mind it’s pretty modest compared to other tools on this list.
Explore popular alternatives to Heap and how it compares to Mixpanel.
Google Analytics 4: Best for Performance Marketing
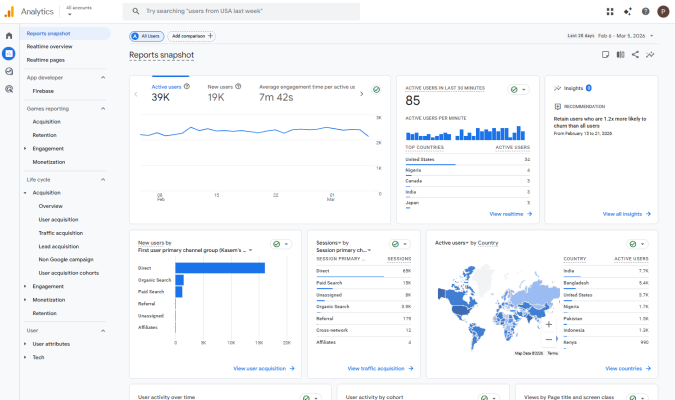
Google Analytics 4 (GA4) is the most widely-used web analytics tool in the world. It’s the default starting point for many people because it’s free and it tracks traffic from every channel.
We cover the basics of GA4 in this post, but be warned, the interface is genuinely difficult to use. There is a lot of lingo to learn and extra steps required to answer even the most basic questions. Google redesigned it completely from the previous version and I (along with millions of other people) find it over-engineered and frustrating to navigate.
But for performance marketers, it is close to essential. Google Ads is the world’s most popular online ad platform, and GA4 is how you plug it in properly. Conversion data from GA4 feeds directly into Google’s bidding algorithms, telling it which clicks turn into customers. Audiences you build in GA4 sync automatically to your campaigns.
Basically, the more conversion data you send to Google, the better job it does getting your ads in front of your target audience. No third-party analytics tool can replicate this feedback loop.
On the organic search side, connecting Google Search Console with GA4 brings in keyword and ranking data, so you can see how people found you and connect that to their on-site behavior. It’s a must for increasing SEO traffic.
GA4 is also capable of tracking traffic from Meta, LinkedIn, TikTok, email, or anywhere else you are running campaigns. You can bring all of that data together, understand who is on your sites, where they came from, and what they are doing.
Once you install the GA4 tag (easy), basic web analytics like pageviews, scrolls, and form submissions are automatically captured without writing any additional custom code.
Tracking conversions (now called “key events”) is more cumbersome than it used to be. You have more flexibility to track events, but the setup is technical enough to cause confusion and mistakes.
There are a number of pre-built reports to track acquisition, retention, monetization and engagement metrics. You can also set up custom dashboards, funnels, and path explorations. Provided you have set up the tracking correctly, these can be quite helpful for understanding your web traffic and how it is behaving.
Beyond the basic tracking, beginners struggle to get clean, up-to-date reliable data. Even experienced analysts are less than thrilled with GA4 compared to previous versions. Here are some of the issues that cause GA4 data to be inaccurate.
That said, no tool has as much free documentation or as many users on forums that are willing to help you decode GA4’s notoriously confusing interface and troubleshoot broken tracking issues.
On privacy, it’s comparable to other cloud-hosted options in that there is no way to fully control the data. GA4 includes some compliance tools for GDPR and CCPA, just bear in mind that the default settings can get you into trouble with EU law (and potentially in other jurisdictions), so make sure that you have proper cookie banners and so on.
If you are running paid search or trying to measure whether your marketing is working across channels, GA4 is not really optional. Most performance marketers need a presence in paid and organic Google search, and the native integration with Google Ads and Google Search Console is too valuable to pass up.
Teams typically treat it as a foundation to build on top of. Integrating GA4 with Crazy Egg, for example, is going to give non-technical users a much greater ability to understand what their traffic is doing and how to improve their site. At the very least, they hook GA4 to Big Query or Looker Studio to make their raw event-level data easier to work with and share.
Check out these popular alternatives to GA4 and how it compares to Heap.
What Matters Most When Reviewing Web Analytics Tools
Brands in this space use a ton of razzle dazzle to get your attention, showing nifty dashboards and futuristic looking data visualizations.
Ignore all of it.
The most important things to consider start with looking inward. What do you need to measure? What is your team going to be confident using?
Once you have a grip on those factors, choosing the best tool will be a simple process of elimination. Here’s what you should be thinking about.
Learning curve
Who is going to be using the tool, how much time and effort do they have to throw at it? The easiest way to break this down is looking at each operational phase and self-assessing how ready your team(s) are to start working with the tool effectively.
- Can they set this up to capture the data they need?
- Can they build and analyze reports to make valid interpretations of the data?
- Can they maintain accurate data collection as your site and app evolve?
If you are a business owner or founder that wants to spend a little time each week understanding their website traffic, you definitely want to stick with a simple tool like Crazy Egg which is going to do what you need out of the box. Even GA4 can work, so long as you get some technical help setting up key events and tracking on your site.
When it comes to tools like Mixpanel, Amplitude, or PostHog, you want to consider the learning curve question from the perspectives of the different teams that need to use it: engineers to get set up as well as PMs and marketers interacting with reports.
Tracking scope
I would go into your product evaluation with a clear sense of the data that you need to capture. What are the key performance indicators on your site you need to have the best handle on? A tool built to answer questions about traffic and acquisition is different from one designed to understand where users drop off inside a product.
Finding a tool that is ready and able to capture the data you need will save a lot of pain down the line. I would ask:
- Do you need web analytics, product analytics, or both?
- How often does your site or product change?
- Will default event capture be enough or do you need a high degree of customization?
Setting up accurate tracking on a small site with a few pages that are infrequently altered is not a huge deal. Most tools will handle that fine. But if you have an ecommerce store with thousands of SKUs or a SaaS product where your team is constantly shipping new code, you’re going to need a tool that helps you keep up.
The same goes for customization. The more specific or bespoke the events you are trying to track, the more powerful analytics tools you are going to need.
Reporting depth
What do you want to be able to do with the data you’ve tracked? Tools on this list vary widely in terms of how you can view the data, segment it, and what other data sources you can bring in. I’d ask:
- What data visualizations are your teams really going to benefit from?
- How much control do you need over segmenting user groups?
- Does the tool integrate with other data sources you rely on?
Every tool on this list is going to show you a dashboard with traffic and conversion rates, but they differ in terms of the visualizations available, like funnels, path explorations, heatmaps, and retention curves. What do you really need?
And can you slice and dice the data to really see what you want? Filtering by traffic source is widely available, but tools like Amplitude let you define custom cohorts based on specific behavior. What degree of segmentation is necessary for your PMs and marketers to answer important questions?
And if you need to connect other data sources, like your CRM or ad platforms, I’d make sure it’s not going to be a huge pain. Look for integrations that will speed the process, or the ability to export raw data into another tool where you plan to do analysis.
Privacy and compliance
As you evaluate tools, definitely think about how the different tools store, share, and protect data. You can get in hot water with regulators if you’re not thoughtful about this, so consider:
- Where will your analytics data live and who has access to it?
- What regulations are your business or customers subject to?
- Will the tool collect any sensitive data?
The vast majority of web analytics tools store data on their own servers, which is usually fine so long as it’s a reputable company. PostHog is the only option I covered that allows self-hosting, but there are other options out there worth considering if you need to maintain complete control of your data.
If you are based in, or have customers in the EU (subject to GDPR) or California (subject to CCPA), then the default settings are not sufficient to maintain compliance. Make sure that you go with a platform that makes it easy for your team to get consent, anonymize data, and so on.
Also be aware of the type of data tools track, and whether or not emails or or other Personally Identifiable Information (PII) will be inadvertently captured. This is especially true for tools that capture session recordings. The more data that tools capture, the more carefully you need to configure them.
All-in and ongoing costs
I barely touched on the platform pricing in my reviews. Not because it doesn’t matter, but because the true costs are so unique to each business that I am not able to offer any sort of meaningful guidance on what to expect.
You might be a startup where dev hours are virtually free because everyone is eating beans and rice and dedicated to the mission. Labelling data or customizing code are just more stuff that has to get done. But you could also be a startup where dev hours are limited, and time spent on anything but building is bad news. You might also not be a startup at all.
The point is that I don’t know what you’re dealing with, so I can’t say whether something is expensive or cheap, worth it or not.
When think about price, focus on the whole picture, considering things like:
- Platform cost: This is the sticker price you see, which may be billed per event, per session, per user, or something else. Make sure you understand how that number goes up as your traffic grows, because a tool that looks cheap now might get pricey later on.
- Technical costs: Every tool requires some degree of technical setup, and most require ongoing maintenance. Whether that comes out of an engineering or marketing budget, it’s a real cost that won’t show up on the pricing page.
- Switching costs: The price of migrating data, re-tagging everything, and retraining staff cannot be an afterthought.
- Storage costs: These may be factored into the sticker price and cost next to nothing, or they might be significant, requiring a third-party tool to store all your data and query it.
The last thing I’ll add is the opportunity cost of picking a tool you end up hating. The months you lose trying to make it work have a real cost, not to mention the stress you put on teams having to learn and re-learn everything.
How to Get Started with Web Analytics Tools
The best analytics tool is the one that your team feels confident using. Here’s how to find one that people love, understand, and will want to stick with.
- Figure out what you need to track. Separate the must-have capabilities from the nice-to-have ones.
- Define what good outputs look like. These tools help you visualize and work with the data in very different ways.
- Honestly assess your technical resources. Understand what your team brings to the table for setup, analysis, and ongoing maintenance.
- Make a shortlist of 5-7 tools. These should fit your needs and resources, and integrate with any other tools you plan to use.
- Demo the top three. Pay attention to how these tools feel, and get feedback from the different teams who use them. Demo the rest of your shortlist if people aren’t happy.
- Plan the rollout. Migration, training, and setup are all going to take time, so prepare to make the transition smooth.
- Deploy the new tool in parallel. It’s usually a good idea to keep your old tool live for a few weeks while you validate the new one.
If you are truly just getting started, I definitely recommend Crazy Egg: web analytics are free forever, the setup takes about 5-10 minutes, and it’s simple for non-technical users to understand.
It’s still a good option for teams with more sophisticated needs and a deeper bench of technical users, especially if you are interested in A/B testing and conversion rate optimization. No tool on my list lets you do more without developers and data scientists.