Bounce rate and exit rate are two metrics that measure the percentage of users who leave your website: Bounce rate from the first page they visit, and exit rate from a specific page, often after visiting others.
This article breaks down the key differences between bounce and exit rates: how to calculate and track each, how to interpret them, what “good” looks like, and how to reduce both when they signal a real problem.
Bounce rate vs. exit rate overview
| Bounce rate | Exit rate | |
|---|---|---|
| What it measures | Percentage of visitors who leave after viewing only one page | Percentage of visitors who leave from a specific page, regardless of the pages viewed before it |
| Where it matters most | Landing pages / PPC pages, blog posts, homepage | Checkout page, funnel steps, product pages, homepage, thank-you/confirmation page |
| What it tells | The entry page doesn’t engage the visitor (content mismatch, slow load, poor first impression, etc.) | The page where journeys end — because of friction or a natural endpoint |
| How to reduce | Fix entry page problems: content-intent alignment, page speed, first impressions, mobile UX, traffic targeting | Fix journey problems: conversion flow friction, missing information, weak CTAs, technical issues, pricing, and value messaging |
What’s the difference between bounce rate and exit rate?
Bounce rate and exit rate tell you how likely visitors are to leave a page, but in different contexts.
Bounce rate measures the percentage of visitors who land on a page and leave without engaging or viewing another page.
Exit rate is the percentage of visitors who leave from a specific page, regardless of how many pages they viewed before it.
So not all exits are bounces, but all bounces are exits.
What bounce rate tells you
Bounce rate is a first-impression metric. It reflects how well a page engages the visitors who land on it or how well it leads them deeper into the site.
High bounce rates may be caused by:
- Content-intent mismatch. The page doesn’t deliver what the search result snippet or ad promises. For example, a search result about “how to fix a leaky faucet” has no actionable guidance.
- Slow page load. The visitor loses patience waiting for the page to load and leaves.
- Poor first impression. Visually unattractive, cluttered pages may put off visitors before they read a word.
- Wrong audience. A specific channel, say display ads, may be targeting the wrong audience.
- Poor navigation. Without internal links or a clear menu, users don’t know where to go next.
- Poor mobile UX design. If the page isn’t optimized for mobile devices, visitors can’t easily complete tasks or find information.
What exit rate tells you
Exit rate is an end-of-journey metric. It tells you how likely visitors are to close the tab or navigate away from a specific page.
A high exit rate isn’t necessarily bad because all sessions end with an exit.
This makes exit rate harder to interpret than bounce rate.
A confirmation page with a high exit rate means the funnel works well. But a product page with a similar rate may be a disaster because it doesn’t move the customer towards the cart.
But it’s useful for diagnosing problems deep in the user journey.
Some bounce rate causes, like poor navigation or user experience, apply to exit rates.
Other reasons why users exit?
- Friction in the conversion flow. A lengthy, unintuitive checkout or sign-up process may put off the customer.
- Missing information. For example, no sizing guide on a product page or unclear TCO on a pricing page.
- Weak, buried, or invisible CTA. Visitors don’t see it or don’t find it compelling, so they don’t act and leave.
- Technical issues. For instance, JavaScript errors, broken form submissions, or images that don’t load.
- Price shock. The visitor sees the number and decides it isn’t for them. For example, because it’s pricier than competitors, or they don’t understand the value.
What exit and bounce rates don’t tell you
Bounce rates and exit rates show you where users leave, but not why.
A high exit rate on a checkout page could mean confusing form fields, unexpected shipping costs, or a broken payment button. No way to tell from the number alone.
To understand why users bounce or exit, you need qualitative data from:
- Session recordings: show what individual users actually did before leaving
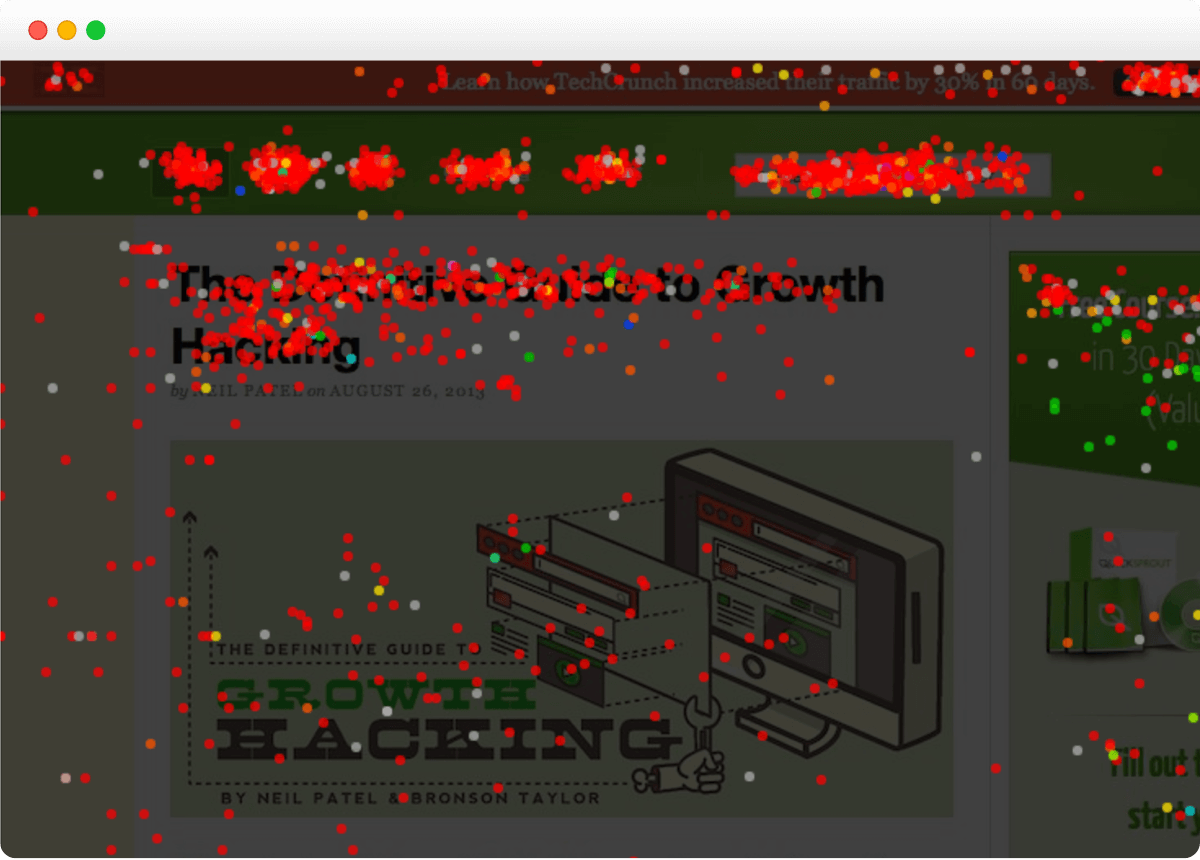
- Confetti and click maps: show user click patterns on the page
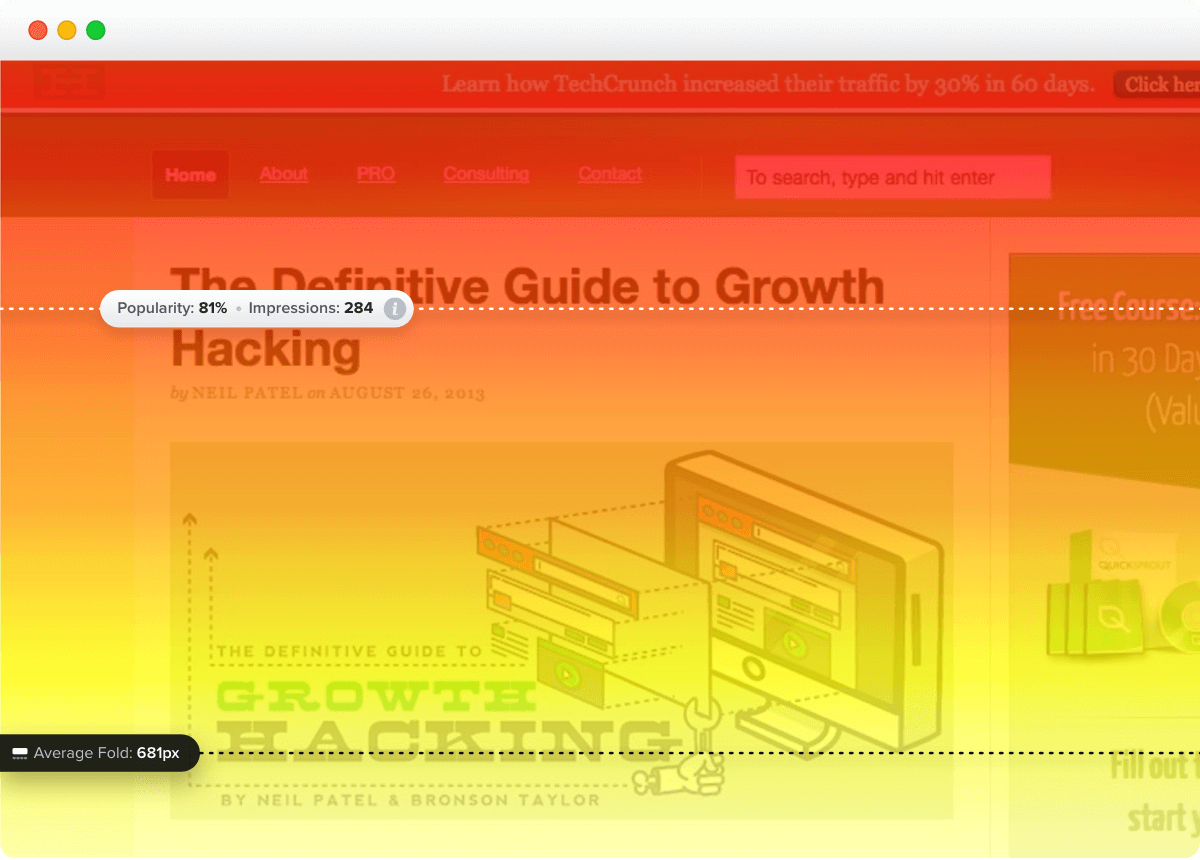
- Scroll maps: reveal how far down the page readers look (Do they even see the CTA button?)
- Error reports: point out issues that prevent users from completing actions or spoil the user experience
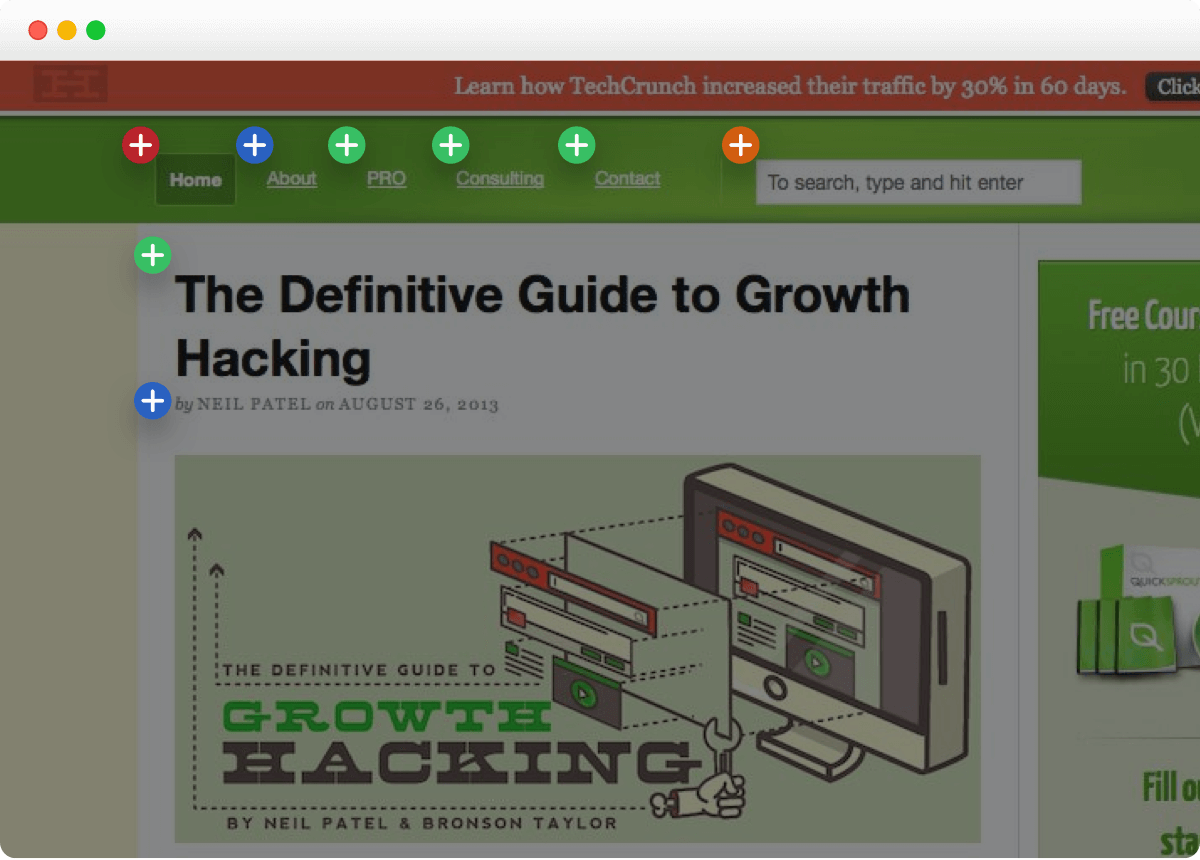
- Overlay maps: show possible exit doors and how many visitors take them
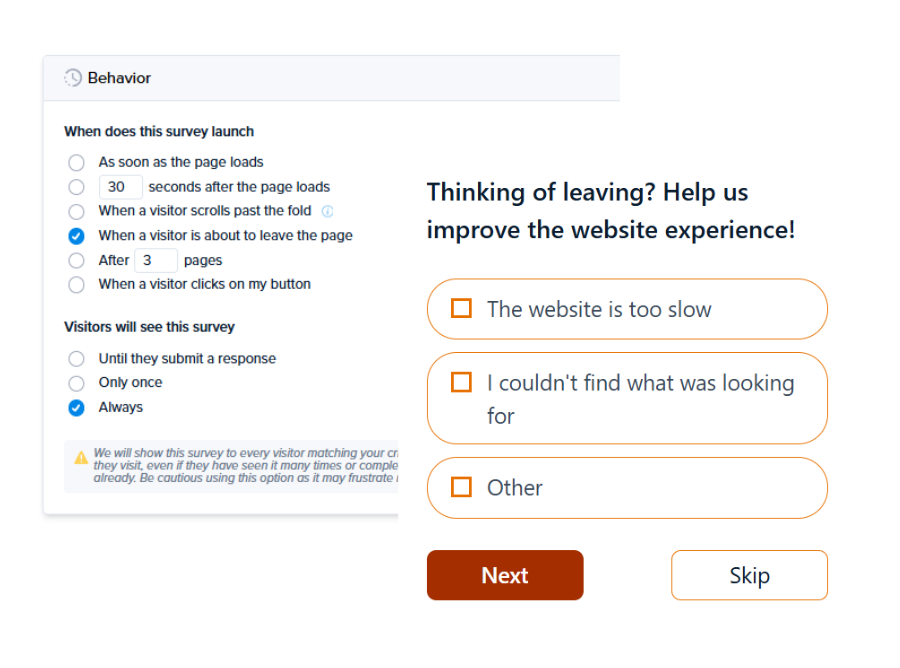
- Exit surveys: triggered when the user is about to leave, asking about their experience and reasons for leaving
- User interviews and user testing: give insights difficult to capture with web or UX analytics.
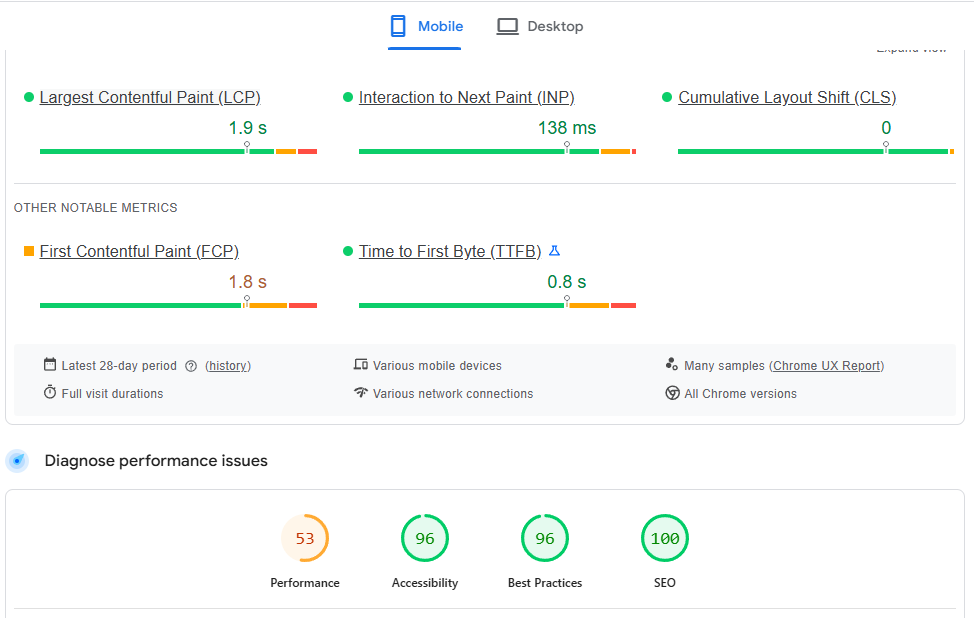
Google PageSpeed Insights and SEO tools, like Ahrefs, can also help you spot technical issues, like slow load times or broken links, and accessibility issues, like missing alt tags.
How to calculate bounce rate and exit rate
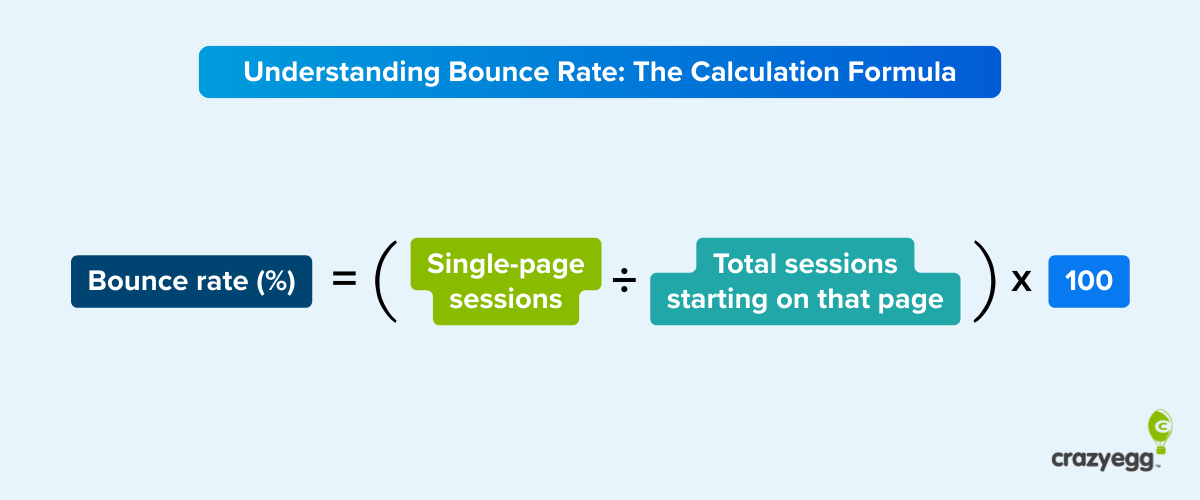
To calculate the bounce rate, divide the single-page, unengaged sessions by the total number of sessions starting on the page, and multiply by 100.
Bounce rate = (single page, un-engaged sessions ÷ total sessions starting on that page) × 100
Example: (300 ÷ 1000) x 100 = 30%
If your homepage had 1,000 sessions start there and 300 of those visitors left without viewing a second page or engaging, your homepage bounce rate is 30%.
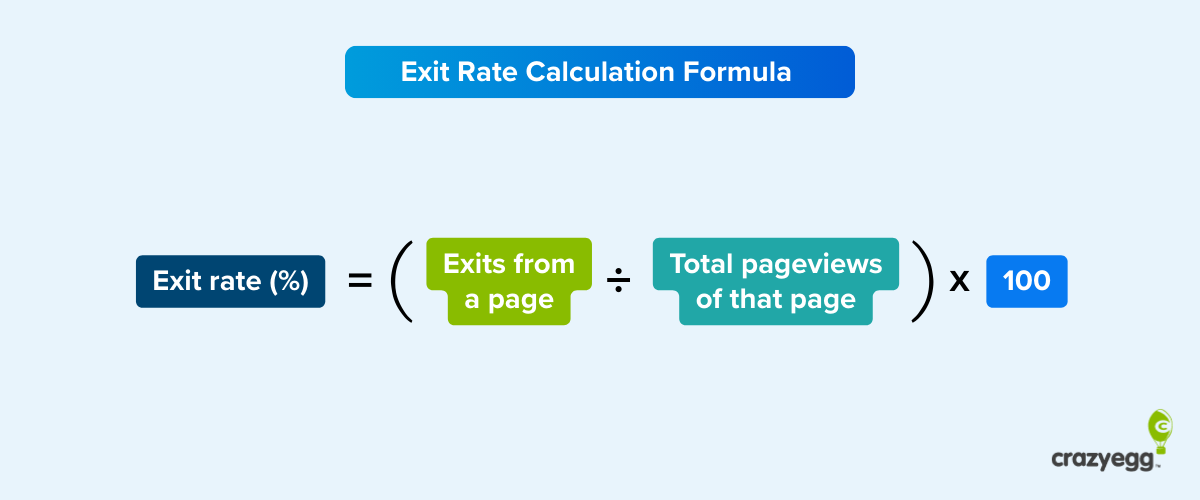
To calculate the exit rate, divide the exits from a page by the total pageviews of the page, and multiply by 100.
Exit rate = (exits from a page ÷ total pageviews of that page) × 100
Example: (150 ÷ 1000) x 100 = 15%
If your product page receives 1000 total pageviews (from any source — direct entries, internal navigation, whatever) and 150 sessions end there, the exit rate is 15%.
The exit rate is often lower than the bounce rate for the same page because we divide exits by pageviews (internal traffic + entry traffic), not just entry traffic.
Bounce rate in GA4
Google Analytics 4 (GA4) defines bounces differently from Universal Analytics (and most ranking articles on the topic).
A user session doesn’t count as a bounce in GA4 when it lasts longer than 10 seconds, includes a conversion event (key event), or has 2+ pageviews.
Let’s imagine the visitor finds your blog post through Google Search, reads the whole piece, and leaves.
In the past, it would count as a bounce because the visitor left from the entry page. Even though the page served its purpose.
In GA4, this would count as an engaged session and wouldn’t be included in the bounce rate calculation.
Much more useful for prioritizing page optimizations.
How to track bounce rate and exit rate in GA4
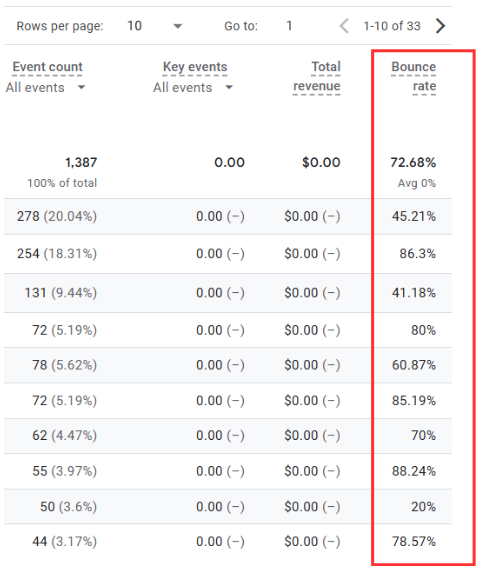
GA4 doesn’t show page bounce or exit rates by default. Here’s how to add them to your reports.
How to track bounce rate
- Go to Reports > Engagement > Pages and screens
- Click the pencil icon in the top-right corner to customize the report
- Click Metrics > Add metric, search for “Bounce rate,” and select it
- Click Apply, then Save
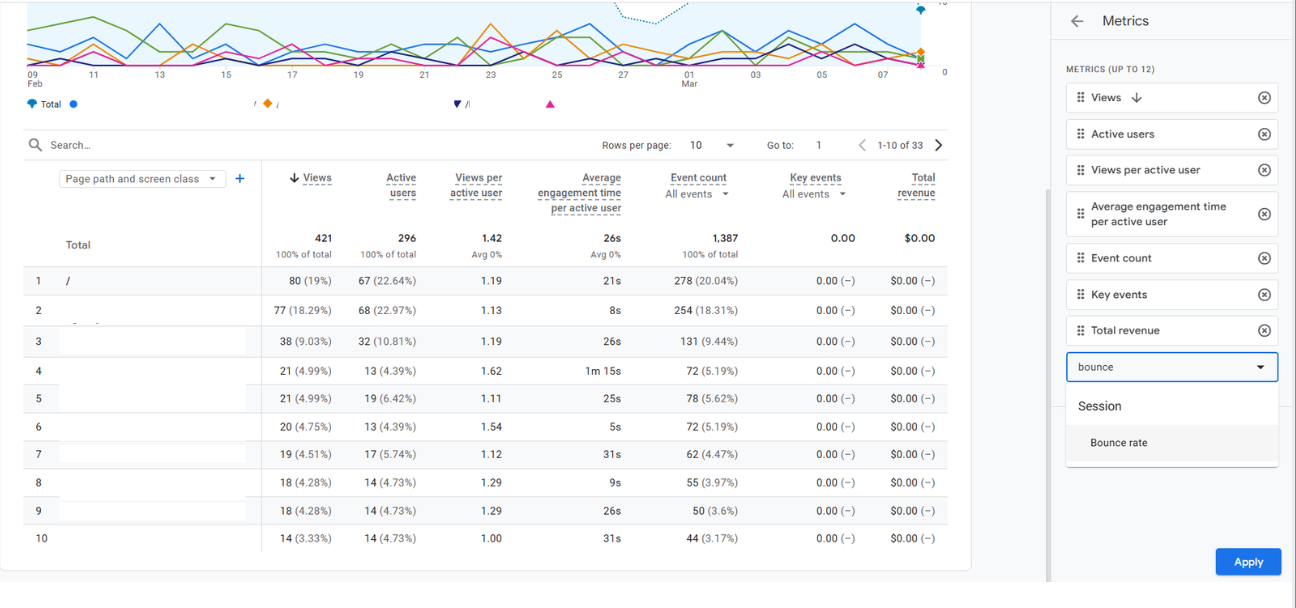
Bounce rate now appears as a column in the report.
How to track exit rate
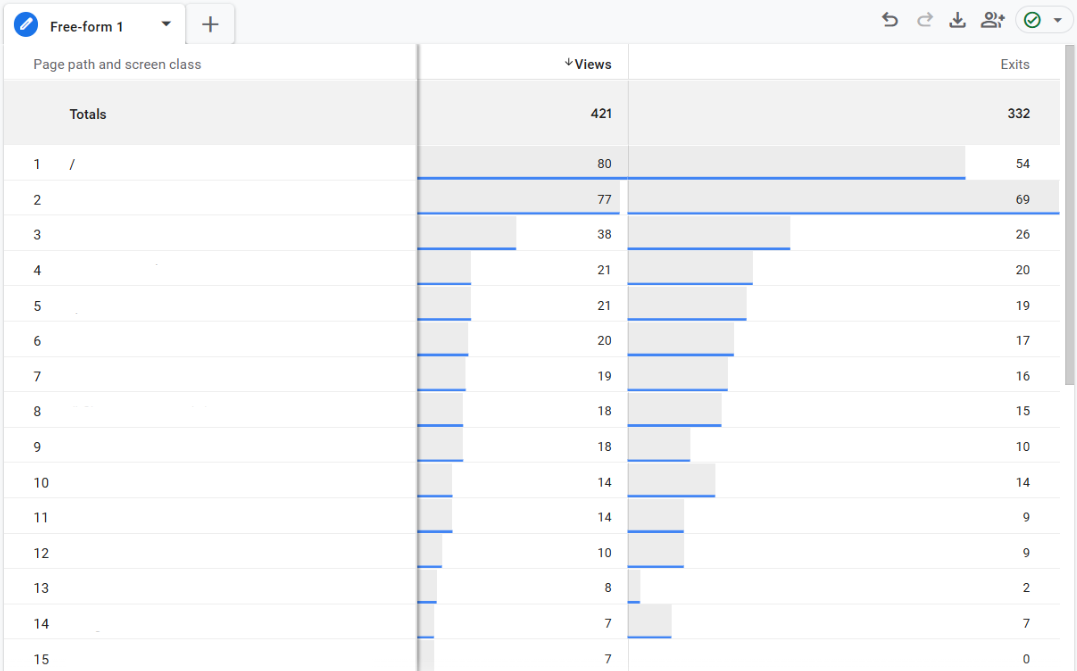
Exit rate has no native column in standard GA4 reports. To see it, build a custom Exploration:
- In GA4, click Explore in the left sidebar, then select Blank
- In the Variables column, click + next to Metrics and add Views and Exits
- Click + next to Dimensions and add Page path and screen class
- Drag the dimension into Rows and both metrics into Values
The easiest way to calculate the exit rates from here is to export the data into a Google Sheet and use the formula above.
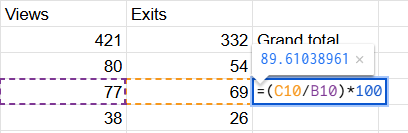
Cumbersome, right? And the data won’t update automatically in the spreadsheet.
If you’re working on customer journey optimization, funnel analysis is an easier way to identify the pages where customers drop off.
What is a good bounce rate?
A bounce rate of 40-50% is considered good.
The median bounce rate is around 44%, according to Databox’s GA4 benchmarks (September 2024).
However, this varies across industries. It’s around 28% for apparel & footwear sites, just over 36% for e-commerce & marketplaces, and it hovers around 48% for SaaS and IT.
The bounce rate also depends on the page type:
- E-commerce product pages: 20–40%
- Blog posts and informational pages: 50–80%
- Landing pages: 60–90%
The device type also affects the bounce rate.
For instance, Calconic cites the average rates of 58-60% for mobile and 48-50% for desktop devices.
When comparing bounce rates across studies, note that they may define bounces differently (GA4 vs. UA).
What is a good exit rate?
What a good exit rate looks like depends on the page type.
Here are approximate ranges to aim for:
- Thank-you and confirmation pages: 70-90% is expected — users completed the goal
- Blog posts and content pages: 60–90% is common — readers leave after getting what they came for
- Product pages: 20–40% is a reasonable target — higher suggests the listing isn’t convincing enough to drive an add-to-cart or signup
- Checkout pages: Under 35% is ideal — a high exit rate on checkout pages signals friction
- Homepages: 20–40% — a navigation hub should route users deeper into the site
Exit rates (and bounce rates) vary from website to website, so use these as rough guidelines. Group similar pages, look for outliers, and start optimizations from them. Once you have more data, use it as a baseline for future improvements instead of benchmarks.
How to reduce bounce rate and exit rate
How you tackle excessive bounce or exit rate depends on the cause.
As mentioned, the bounce and exit rate causes often overlap, so I’ve organized the solutions by categories, rather than metrics.
The list is by no means exhaustive. More of an overview.
Content & intent alignment (bounce rate primarily)
- Match page content to the specific promise in the ad, conversion email, or keyword search intent
- Lead with value — solve the problem or show the product above the fold
- Add missing information visitors need to take the next step (sizing, specs, return policies, clear pricing tiers)
- Improve readability — short sentences, short paragraphs, whitespace, subheadings, visuals to help visitors find what they need
Page speed (bounce rate primarily)
- Aim for load times under 3 seconds.
- Use compressed image formats (WebP/AVIF) and lazy-load images and videos below the fold
- Defer or async non-critical JavaScript
- Reduce third-party scripts (chat widgets, ad pixels, etc.)
- Test on cell connections, not just desktop Wi-Fi/broadband
Traffic & targeting (bounce rate primarily)
- Tighten ad targeting and keyword selection
- Match ad creative to actual page content
Conversion flow (exit rate primarily)
- Simplify forms — remove non-essential fields and add clear labels/placeholders
- Reduce the steps between the cart and purchase
- Offer guest checkout and enable single sign-on (SSO)
- Show shipping costs and total price early — too high extra costs are the main cart abandonment cause
- Add trust signals like security badges, return policies, and reviews at key stages
Pricing & value communication (exit rate primarily)
- Ensure visitors see features, benefits, and social proof before reaching the pricing page
- If visitors arrive at pricing directly from search, the page needs to carry more value messaging
- Add pricing context (comparison to alternatives, ROI framing, “most popular” anchoring)
UX design (both)
- Clean up visual hierarchy — add scannable structure with clear headings
- Remove or delay intrusive pop-ups — especially on mobile, where they can be hard to dismiss
- Eliminate autoplay media
- Declutter pages — remove distractions, surface only what matters
- Use inclusive color patterns for visitors with disabilities and learning difficulties
Mobile UX (both)
- Make tap targets at least 48×48 pixels
- Set body text to at least 16px
- Use single-column form layouts and eliminate horizontal scrolling
- Place primary CTAs in the thumb zone (the bottom half of the screen)
- Make pop-up close buttons easy to tap
- Collapse secondary content into accordions or tabs
Navigation & CTAs (both)
- Add clear internal links so pages aren’t dead ends
- Add related content, “you might also like” sections, or a clear next step
- Make CTAs visually prominent — size, color, placement
- Simplify menu labels — use visitor language, not internal jargon
- Optimize site search to help visitors find what they need
- Trigger pop-ups and banners to guide users to relevant pages

Track the number, then find the cause
Bounce rate and exit rate are starting points, not answers. They tell you which pages are losing visitors. They don’t tell you why.
To close that gap, use behavioral data from heatmaps, session recordings, and surveys.
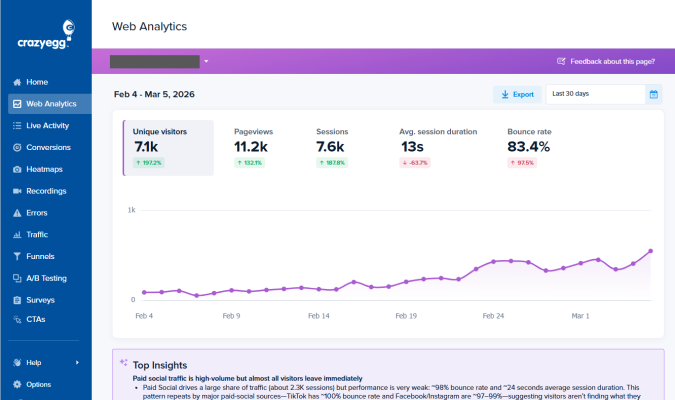
Crazy Egg offers all of these and more. Want to try? Start your free trial today.
FAQs
Is bounce rate a ranking factor?
No, bounce rate isn’t an official Google ranking factor.
However, SEOs suspect it may have an impact. Google collects data about user behavior, including “long clicks” and “short clicks”, and many believe it uses the information to rank pages.
Regardless of whether Google takes bounce rate into account, it’s likely to be correlated with rankings. Pages with low bounce rates generally better match user intent and offer a better experience, which Google rewards.
Can a page have both a high bounce rate and a high exit rate?
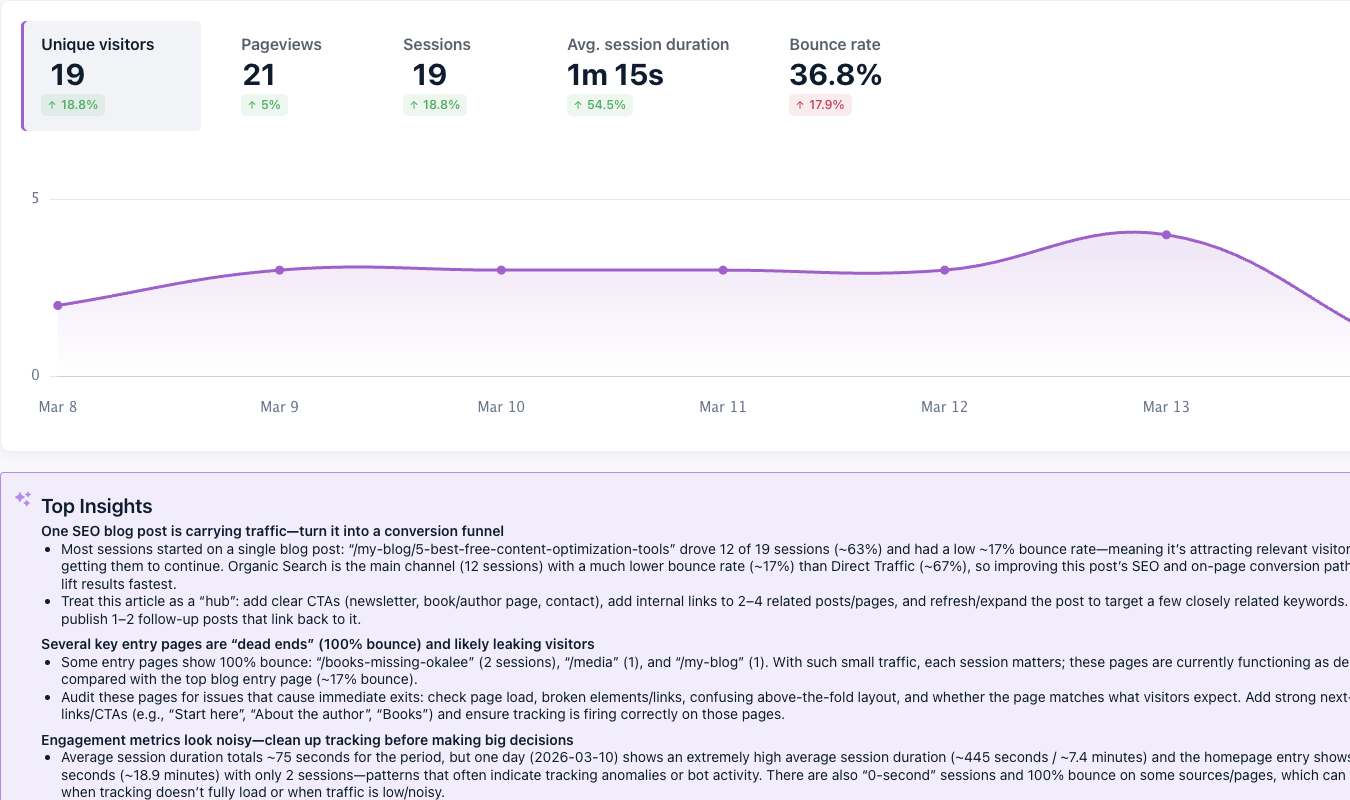
Yes, a page can have both a high bounce rate and a high exit rate, and it can be a red flag. It means all visitors leave immediately without engaging with the page content, regardless of whether it’s the first page they see or one of many.
What is the difference between exit rate and abandonment rate?
Exit rate is a web analytics metric, while abandonment rate is specific to e-commerce. The former describes the percentage of pageviews that were the last in a session, and the latter, the percentage of shopping carts created but not completed.
The two metrics overlap on checkout pages but use different calculations and answer different questions.