Heatmap tools record how visitors interact with your site, visualizing everything in a colorful map. So which are the best?
The best heatmap tools at a glance
Short on time? Here’s our pick for every situation:
- Best overall (and best for CRO): Crazy Egg. It’s the only tool on this list where you can spot a problem in a heatmap, fix it with a built-in A/B test, and confirm the result in the next heatmap, all without adding another tool.
- Best free heatmap tool: Microsoft Clarity. Unlimited heatmaps and recordings at $0, but recordings expire after 30 days and there’s no A/B testing or surveys.
- Best for heatmaps + visitor surveys: Hotjar (now part of Contentsquare). Generous free plan, built-in feedback widgets.
- Best for form analytics and friction scoring: Mouseflow
- Best for small ecommerce stores: Lucky Orange. Every feature on every plan, plus live chat.
- Best for product teams on a free plan: Fullstory. 30,000 free sessions a month and 12 months of history.
- Best for enterprise: Contentsquare (large marketing and UX teams) or Glassbox (banks, insurers and other regulated industries)
Heatmap tools compared
| Tool | Best for | Free plan | Paid plans from | Recording retention |
|---|---|---|---|---|
| Crazy Egg | CRO: heatmap to A/B test to result | Yes: Instant Heatmaps, web analytics, surveys | $29/mo (5,000 tracked pageviews, 50 recordings; billed yearly) | 6 months (Starter), 2 years (Plus and up) |
| Microsoft Clarity | Free, unlimited heatmaps | Free, no traffic limits | No paid plan | 30 days (13 months for favorited sessions) |
| Hotjar/Contentsquare | Enterprise | Yes: 200,000 sessions/mo, 1 project | ~$49/mo (7,000 sessions) | 1 month (Free), 13 months (Growth) |
| Mouseflow | Form analytics, friction scores | Yes: 500 sessions/mo | €25/mo (5,000 sessions; billed yearly) | 1–12 months by plan |
| Lucky Orange | Small ecommerce, live chat | No (removed in 2026) | $32/mo (3,500 sessions; billed yearly) | 60 days (longer as a paid add-on) |
| Fullstory | Product analytics + replay | Yes: 30,000 sessions/mo, 10 users | Quote only | 12 months (Free) |
| Glassbox | Regulated industries | No | Quote only | Custom |
What Makes a Heatmap Tool Valuable?
So how do we tell which heatmaps are the best? Here’s what we look at:
- Session recordings and replays—Elite tools combine heatmaps with session recordings, replays, and analytics, providing contextual relevance to customer actions.
- Multiple heatmap types—They come with a variety of heatmap types, including movement, click, scroll, attention, and geo heatmaps to cover the different user behaviors across your website or application.
- Conversion tracking—Modern platforms provide a correlation between user actions and key outcomes like conversions, revenue, or cart abandonment rate, linking the business impact to specific web elements.
- Dynamic data—Premium contenders feature real-time data monitoring on dynamic elements such as pop-ups, dropdowns, and exit intent banners, allowing instant user activity monitoring over specific time periods.
- Comprehensible UI—The best heatmap tools provide an intuitive dashboard, accessible technical documentation, and a clean user interface, enabling quick access to critical customer engagement metrics like time on site, engaged sessions, and scroll depth.
Here’s a quick roundup of the 7 leading heatmap tools you can start using today.
1. Crazy Egg Heatmap Tool: Best Overall

Pricing:
- A free 30-day trial is available to try out Crazy Egg at any time. The free Crazy Egg plan includes Instant Heatmaps.
- Premium plans starts at $29 per month and includes 5 heatmap reports, 50 recordings, and up to 5K pageviews monthly.

What I personally LIKE about the Crazy Egg Heatmap Tool:
- An easy setup, beginner-friendly UI, and gentle learning curve all come together to provide an outstanding UX, features that both newcomers to heatmaps and experienced conversion specialists will enjoy.
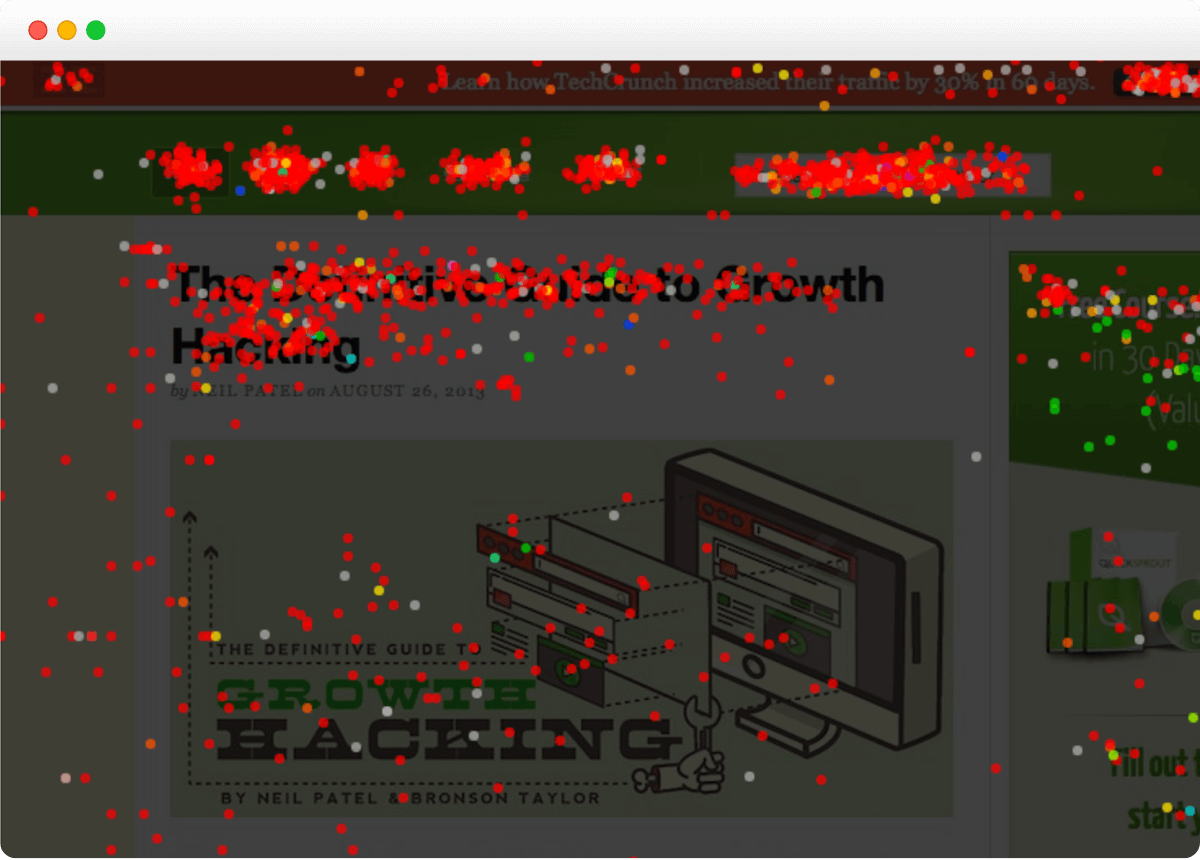
- Different heatmap report types, including Click Maps, Scroll Maps, Confetti Maps, Overlay Maps, and List Maps enable you to dig even deeper into your visitors’ behavior, identifying their path and testing valuable hypotheses about the customer journey from the moment they land on a page to the time they exit your site.
- You can bundle up to 25 snapshots from multiple reports into a single downloadable zip file or send them to an email of your choice.
What I personally DISLIKE about the Crazy Egg Heatmap Tool:
- Minor dashboard quirks might pop up from time to time, but nothing that will lead to significant workflow disruptions.
- Its reports are not as comprehensive as Google Analytics 4 (GA4), but they’re MUCH simpler to configure and run.
- Snapshot filters are limited to the device you’re using.
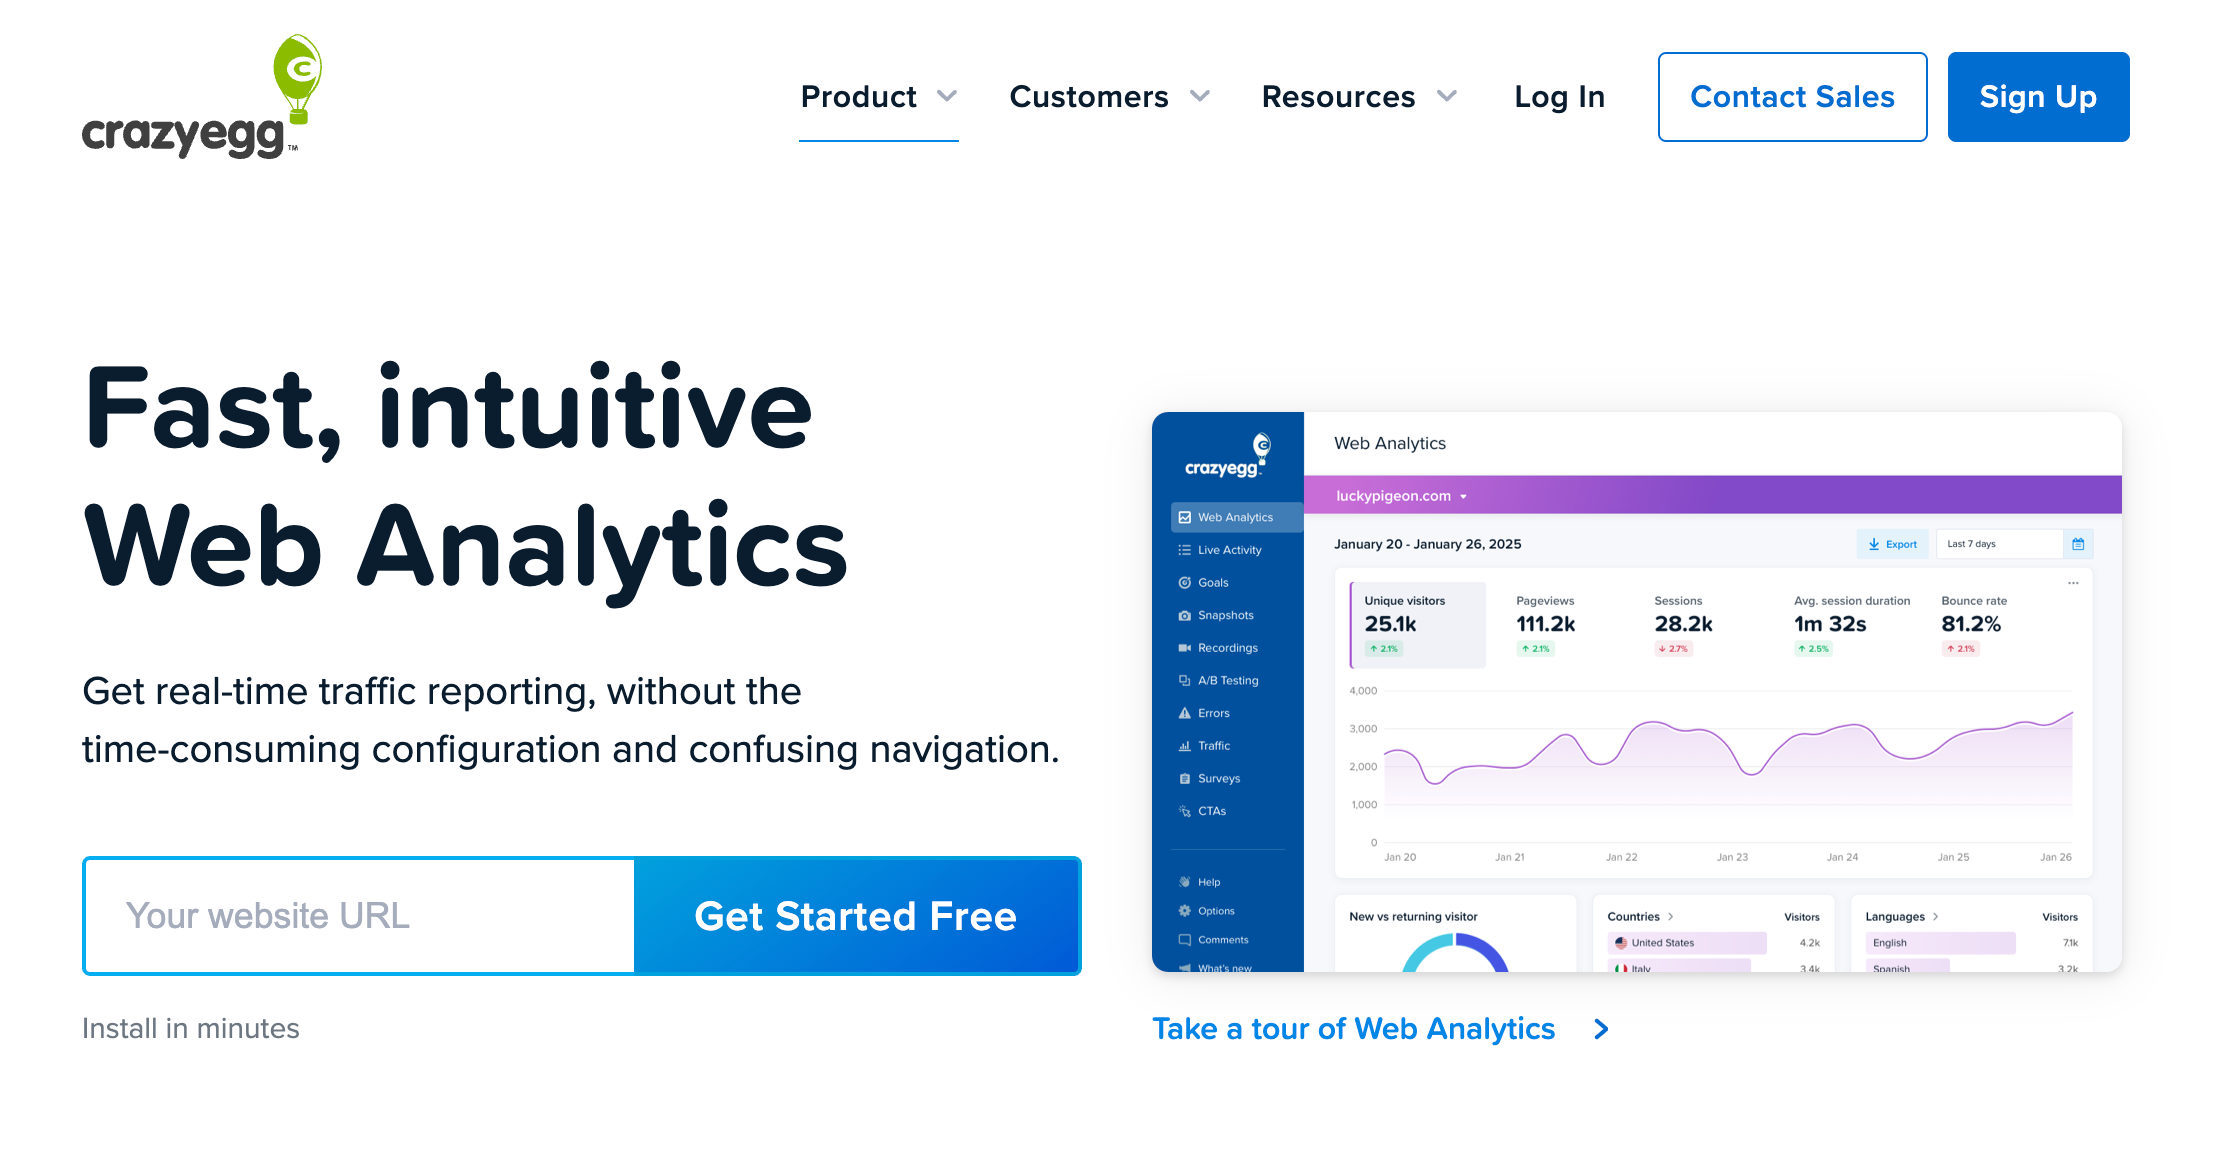
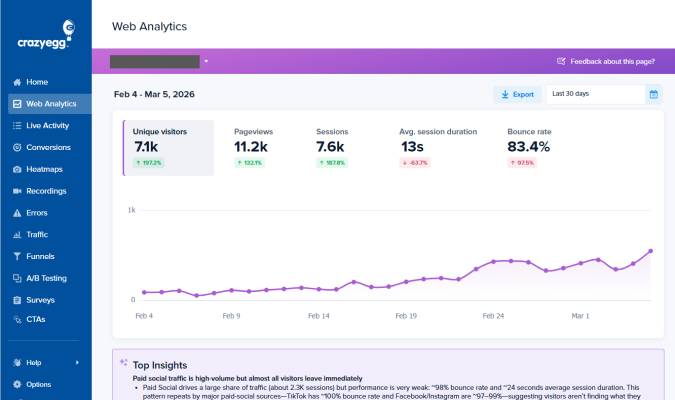
Crazy Egg’s comprehensive suite of tools includes website analytics (which is free forever, just add a code snippet to your site), conversion analytics, and errors tracking which help you uncover the “hows” and “whys” behind visitor behavior. Allowing you to focus on meeting their needs instead of getting sidetracked by anecdotal hunches or random noise in the data. Heatmap reports come in three types (heatmap, confetti, and scrollmap) and use click data to show which areas of your page get the most attention. You can customize these reports to see where visitors are coming from, measure how effectively your marketing campaigns are generating new leads and traffic, and identify which days drive the most engagement. Export reports individually or bundle them together in a zip file for deeper analysis.
Particularly useful is the tool’s snapshot area, where you can select your preferred report type (opens on heatmap by default) for a deeper dive into your site’s analytics. You’ll get a complete overview of key metrics such as page load speed, rage clicks, dead clicks, bounce rate, and site errors. There’s also an explanation for each report on the left-hand side of the main dashboard.
Target Audience: The Crazy Egg Heatmap Tool is well-suited for small businesses, mid-market companies, and large enterprises with a forward-thinking mindset and digitally-oriented customer goals. Folks looking for user-friendly heatmaps, a broad range of report types, and robust documentation will feel right at home with this tool, especially if they value a quick and streamlined onboarding experience.
2. Lucky Orange: Best for Dynamic Heatmap Analysis

Pricing:
- A free trial is available, including a free subscription tier that allows tracking up to 100 sessions per month.
- Paid tier starts at $32 per month, allowing tracking up to 5K sessions monthly.

What I personally LIKE about Lucky Orange:
- On top of heatmaps, the platform offers an extensive range of site analytics tools such as session recordings, live chat, announcement pop-ups, and form analytics, providing an in-depth look into how people explore your site.
- Analyzing dynamic heatmaps may very well become the prevalent heatmap methodology, which is something Lucky Orange already excels at.
- It has an affordable pricing range that balances its value offering with the tool’s unique features and capabilities.
What I personally DISLIKE about Lucky Orange:
- A somewhat steeper learning curve might dissuade users who are unfamiliar with heatmaps from trying out the tool.
- Data retention is limited to 60 days, while funnel tracking might not always work as intended without additional configuration on top of its required setup.
- Occasional data inaccuracies might require double-checking your reports or troubleshooting your setup, an issue which could be exacerbated by the tool’s thin documentation.
Lucky Orange’s marketing push revolves around the software’s dynamic heatmaps, and understandably so, as it allows tracking of a wide array of dynamic page elements like pop-ups, sliders, dropdown menus, and image carousels. Instead of looking at static snapshots, your heatmaps change automatically as users interact with your site. This feature completely transforms the monitoring experience, ensuring you’re always getting up-to-date results regardless of your check-in time.
The platform offers advanced filtering capabilities, allowing you to segment your audience by paid traffic, mobile users, returning visitors, and geographic locations. This detailed overview helps you better understand how different visitor cohorts interact with your online property, opening up the door for highly targeted optimizations. Also, the in-house monitoring tool enables you to keep track of key metrics, including abandonment fields, repeated entries, and time to complete, helping to uncover critical pain points in the customer journey.
Where Lucky Orange’s heatmaps really shine is with bloggers and content creators. The scroll heatmap helps you identify critical drop-off points in your content, demonstrates exactly how readers interact with it, and uncovers what needs to be changed to keep them on the page. Essentially, it eliminates any guesswork in favor of a strictly data-driven approach.
Target Audience: Lucky Orange is the preferred tool of choice for early adopters of the dynamic heatmaps methodology, allowing bloggers, businesses, developers, and content creators to track user behavior on all page elements as it happens in real time.
3. Mouseflow: Best for UX/UI Optimization

Pricing:
- The essential tier is free forever, allowing tracking up to 500 sessions per month.
- Paid tier starts at $31 per month, allowing tracking up to 5K sessions monthly.

What I personally LIKE about Mouseflow:
- Comprehensive session recordings capture everything you need to enrich your data-driven decision-making process, including clicks, mouse movements, and user interactions.
- Seven different heatmap types provide a one-of-a-kind insight into on-site activity, helping you plan, craft, and execute better conversion strategies in the long haul.
- The entire Mouseflow platform was built with API-first in mind to help with additional tool integrations and data syncing across different platforms, while the added benefit of robust documentation helps with tool setups, usage, and potential troubleshooting.
What I personally DISLIKE about Mouseflow:
- Owners of websites with a large number of visitors might find themselves overwhelmed by the sheer amount of data generated by the tool, making it tough to separate the noise from the critical information.
- WordPress heatmap users might encounter crashes or problems due to outdated plugins, leading to potential syncing issues with the platform.
- New users, especially ones who don’t have tons of experience using behavior analytics tools, may consider the dashboard hard to navigate at first.
Mouseflow is an all-encompassing user behavior analytics platform designed to collect information, visualize data, and create reports that help you better understand your audience and how they use your site. It has seven different heatmap types, including click, movement, scroll, attention, friction, interactive, and geo heatmaps, allowing teams to perform a granular foray into not just the areas visitors click on, but also revealing the reasons behind those specific interactions.
One of the tool’s most compelling features is its friction detection module, which automatically recognizes when visitors get irritated (typically after an action doesn’t deliver the expected result) and start clicking repeatedly in frustration. In turn, they might hesitate to continue browsing and instead bounce right away. Mouseflow helps you detect these occurrences early on in the customer journey funnel, and, ideally, fix them before they accrue to dangerously high levels and start having a negative impact on your existing and future conversion rates.
Target Audience: Given its ability to process complex data in a tangible way, Mouseflow is great for site developers, marketing agencies, and UX/UI designers looking to identify and promptly fix any underlying issues related to their website’s user interface, shaping the user behavior to align with their long-term business goals.
4. Glassbox: Best for Mobile Heatmaps

Pricing:
- You’re required to schedule a demo presentation to get a recommended plan and pricing quote.

What I personally LIKE about Glassbox:
- Its advanced interaction maps deliver the most comprehensive overview of visitor behavior to date, paving the way for a fresh and innovative take on heatmap analytics.
- There’s no shortage of filters to segment your audience into specific groups, leading to a better understanding of your visitors and enabling a sharper, more strategically apt analysis down the line.
- You can track the percentage of people who clicked on a web element after seeing it, revealing the hidden factors that drive audience behavior.
What I personally DISLIKE about Glassbox:
- Referencing older visitor sessions might prove difficult since the tool’s session recording retention extends to 30 days only.
- The UI, while extremely detailed, is also complex, overwhelming, and features a steep learning curve that some users might find too much to handle.
- Users generally need to come from a technical background to leverage the platform’s full capabilities, which may leave non-technical customers feeling left out of its intended user base.
Glassbox is a digital conversion platform focused on helping you boost conversions, capitalize on visitor data, and achieve optimal UX through the leverage of a unified, all-in-one analytics package. The tool’s flagship feature offers a comprehensive overview of visitor clicks, depicted not only as hot zones but as potential jumping boards to the next step in the conversion funnel system.
In other words, Glassbox also shows by how much different web elements impact the revenue stream of each page, leading you to make better decisions on what to keep, what elements to change, and what to remove with surgical-level accuracy.
On top of that, the conversion analytics platform also dabbles in what it calls tagless data capture, which is essentially an improved version of Google Tag Manager, and it doesn’t require any continuous IT involvement for the service to keep working as intended. It tracks clicks, taps, hovers, and other complex gestures in real time, providing a granular deep dive into people’s on-site behavior without missing any critical bits.
Lastly, Glassbox’s heatmap capabilities also work with mobile devices and operating systems, extending the range of what’s possible even while you’re casually strolling in the park.
Target Audience: Glassbox’s innovative feature set is particularly appealing to mobile-first developers, large-scale organizations, and high-traffic online businesses planning to extend their heatmap capabilities and gain a deeper understanding of on-site behavior across multiple web and application platforms.
5. Microsoft Clarity: Best for Users on a Zero Budget

Pricing:
- It’s completely free, forever (or until someone in charge changes their mind).

What I personally LIKE about Microsoft Clarity:
- It’s 100% free.
- Very easy GA4 integration is a plus.
- Provides tons of different filtering options to keep track of specific pages, elements, or CTAs, including the ability to skip a period of inactivity in session recordings and thus save time.
What I personally DISLIKE about Microsoft Clarity:
- The UI, while sufficiently powerful, can feel chaotic or cluttered, pulling control away from the user instead of giving them free rein to test new ideas and explore novel approaches.
- Compared to some of the paid alternatives on this list, MS Clarity is somewhat lacking in advanced heatmap and analytics features.
- Microsoft claims Clarity is fed anonymous user data to train its AI and improve its machine learning models, which they allegedly don’t share with third parties. If you’re not comfortable giving away your site or app’s user insights, MS Clarity likely won’t be the ideal choice to meet your analytics needs.
Microsoft Clarity is a powerful tool that offers a complete web analytics package, including highly detailed heatmaps, visually enhanced session recordings, and advanced attention maps—at zero cost. There’s a demo tour where you can explore Clarity’s core features to evaluate whether the tool fulfills your business needs, with presumably real data from the Microsoft Clarity landing page.
The platform’s dashboard uses machine learning to automatically highlight unusual user behaviors, such as frustration clicks, excessive scrolling, or immediate page bounces, offering a helping hand in identifying problematic UX elements and possible suggestions on how to fix them. Additionally, its comprehensive filtering tools allow you to further segment user data according to a specific time frame, OS, device, location, browser, new or returning users, or a unique user ID assigned by Clarity. This opens the door for a deeper analysis without limits on the features you can use.
Clarity is fully GDPR and CCPA compliant, meaning that it anonymizes sensitive user data and leverages asynchronous JavaScript code for faster page loads. However, the platform openly states it’ll use that data to train existing or new Microsoft AI models and improve upcoming products, at its discretion. Lastly, MS Clarity also easily integrates with GA4 for a more streamlined analytics experience across multiple platforms.
Target Audience: Microsoft Clarity is a great pick for bloggers, individuals, and mid-sized businesses on a shoestring budget who also feel comfortable sharing their anonymized customer data with Microsoft in exchange for a surprisingly capable heatmap and user behavior analytics tool.
6. Fullstory: Best for User Segmentation

Pricing:
- A free 14-day trial of Fullstory’s Business Plan is available, with up to 5K sessions monthly.
- Convoluted pricing scheme. You must reach out to get a pricing quote and demo access for Fullstory’s analytics module.

What I personally LIKE about Fullstory:
- The tool comes with a detailed session replay and real-time user interaction analytics, making it convenient to identify pain points, troubleshoot potential issues, and improve the user experience.
- It has highly responsive and knowledgeable customer support that you can always rely on.
- It’s fairly easy to set up and use, and it integrates well with other analytics platforms like GA4 with the Data Layer Capture program.
What I personally DISLIKE about Fullstory:
- The pricing can be prohibitive for individuals or small businesses, not to mention that it can become difficult to figure out the full extent of the pricing tiers.
- Minor quirks like missing sessions or data not loading properly, in aggregate, might frustrate some users to the point of giving up on the platform.
- A steeper learning curve makes operating the tool more difficult for rookie users.
Fullstory’s heatmap-focused feature set offers a modernized approach to analyzing visitor behavior for your website or application, including classic heatmaps, scroll maps, and rage clicks. Combined with its powerful filtering options, the tool can help with important design decisions and reveal subtle clues about how to refine an existing UI without rebuilding the site or app from scratch.
Apart from a few minor UI quirks, Fullstory works as intended. It has all the necessary features and requirements expected of a modern heatmap tool, and it doesn’t radically stand out from some of the other competitors on this list. However, its powerful user segmentation options allow you to really dive deep into, in its own words, the “why” behind user behavior patterns. As a result, you can better diagnose and solve both common and rare UX/UI problems as they arise.
Target Audience: Fullstory’s ideal user base consists of brand marketers, software engineers, UX/UI designers, and customer support teams seeking to improve digital experiences through detailed user behavior analytics.
7. Hotjar: Best for Novice Conversion Specialists

Pricing:
- The Basic plan offers a free-forever option, with unlimited heatmaps, basic filters, and HubSpot integration.
- Paid plans start at $32 per month, offering additional filters and API integration on top of the basic plan features.

What I personally LIKE about Hotjar:
- It includes customer feedback polls and surveys, making it easy to gather data from regular site visitors.
- Installation is quick and intuitive, with a lightweight script that performs well under heavy load.
- You can filter visitor data using UTM tags, helping you focus on specific traffic sources to better understand where people are coming from when they land on your site.
What I personally DISLIKE about Hotjar:
- Even on paid plans, you can record a limited number of sessions. This can prove a bit problematic with large sites and traffic-heavy blogs.
- It’s not compatible with mobile apps, severely limiting your workflow and day-to-day operations.
- Occasional performance hiccups may sour the experience, with no clear reason as to why they happen.
Hotjar is a professional web analytics platform that offers a wide range of tools, including heatmaps, session recordings, user feedback and poll forms, and trend tracking. Unfortunately, it doesn’t have a built-in A/B testing module, but it makes up for it with robust integration with other testing tools and platforms to deliver a more complete experience.
In terms of heatmaps, you can easily switch between visitor hot zones and session recordings to understand the specific context behind each click. Additionally, you can also launch surveys, polls, and forms to gather information directly from your user base. Hotjar is also championing trend tracking, or using existing data to extrapolate visitor pain points and offer solutions in the same breath.
Target Audience: Hotjar is a great tool for novice conversion specialists or up-and-coming brand marketers to test their mettle before graduating to more advanced platforms for improved performance.
How to choose the right heatmap tool
Almost every tool on this list can draw a click map. What separates them is what happens before and after the heatmap: what you can track, how much it costs as you grow, and what you can do with what you find. Answer these five questions and your shortlist will pick itself.
1. Are you analyzing a website or a mobile app?
Most heatmap tools (Crazy Egg, Contentsquare, Mouseflow, Lucky Orange) are built for websites, including your mobile site. If you need heatmaps inside a native iOS or Android app, go with a tool that has a mobile SDK: Fullstory or Microsoft Clarity. For enterprise scale, Contentsquare or Glassbox.
2. What will you do once you’ve found the problem?
This is the question most buyers skip. A heatmap shows you that visitors ignore your CTA or never scroll to your pricing table. It doesn’t tell you which fix will work. To find out, you need to test it.
- If you want to test fixes, pick a tool with built-in A/B testing (Crazy Egg). Otherwise you’ll pay for and connect a separate testing tool.
- If you want to ask visitors why, pick a tool with on-site surveys (Crazy Egg, Hotjar, Mouseflow, Lucky Orange).
- If you only need to look (a quick audit, a one-off redesign), a free tool like Microsoft Clarity may be all you need.
3. How much traffic will you track, and how is it priced?
Paid heatmap tools charge by sessions (Hotjar, Mouseflow, Lucky Orange) or by tracked pageviews (Crazy Egg). The two units aren’t the same: one session usually includes several pageviews. Before you compare prices, work out what your traffic would cost on each plan, not just the entry price.
Also check what happens when you hit your limit. Some tools charge overages. Crazy Egg pauses data collection until next month, so you never get a surprise bill. And you only pay for the pages you choose to track, not your whole site’s traffic.
4. How long do you need to keep the data?
Retention ranges from 30 days (Microsoft Clarity recordings) to two years (Crazy Egg Plus and up). If you want to compare this quarter’s checkout behavior against last quarter’s, or go back to a session a customer complained about six weeks ago, short retention will hurt.
5. Do you have privacy or data-location requirements?
All the tools here offer masking for sensitive fields. If your legal team has stricter requirements, look closer:
- Data processing agreement (DPA): Crazy Egg, Hotjar, Mouseflow and the enterprise tools offer one.
- Data controller vs. processor: Microsoft Clarity acts as a data controller under its own terms, which some legal teams won’t accept.
- Regulated industries (finance, insurance, healthcare) usually end up on Glassbox or Contentsquare.
Our rule of thumb: start with the decision you need to make next. If it’s “where are people getting stuck?”, any tool on this list will tell you. If it’s “what should we change, and did it work?”, choose a tool that can test the fix too.
My Verdict: Which Is the Best Heatmap Tool?
After spending some time with each tool, a few contenders rose above the rest. Here are the top three heatmap tools you simply can’t go wrong with.
Best overall: Crazy Egg
The Crazy Egg Heatmap Tool stands in a league of its own. The combined power of its slick and intuitive UI, extensive heatmap features, and diverse report types all come together to produce the most streamlined data analytics experience you could ask for from a tool of this caliber. It’s my preferred choice as the best overall heatmap tool by a wide margin.
Best for analyzing mobile heatmaps: Glassbox
Crowned as the most advanced analytics platform for native mobile app users, on top of its best-in-class API and SDK integrations, Glassbox is currently the most logical choice if you want to monitor how mobile users behave on your site. Other notable features of the platform include audience segmentation, A/B testing, zone analysis, interaction maps, exposure tracking, and side-by-side maps to compare data across different segments and time periods.
Best for users on a tight budget: Microsoft Clarity
Given that it’s free to use forever, Microsoft Clarity is the obvious choice for individuals, teams, or organizations that want to get all the perks of a quality heatmap tool without dishing out a dime. And it’s not like Clarity is inferior either: it offers a great feature set, is easy to install, and it supports most major browsers and operating systems. It’s my third and final choice as the top pick among the seven heatmap tools.
Frequently asked questions
What is the best heatmap tool?
For most marketing and CRO teams, Crazy Egg is the best heatmap tool. It combines five heatmap views (click, scroll, confetti, overlay and list) with session recordings, surveys and built-in A/B testing, so you can find a problem and test the fix in one place. If you need a free tool, choose Microsoft Clarity.
What is the best free heatmap tool?
Microsoft Clarity is the best free heatmap tool. It has no traffic limits and includes heatmaps, session recordings and AI summaries. The trade-offs: recordings are deleted after 30 days, and there’s no A/B testing or surveys. Other good free options include Hotjar’s free plan, Fullstory’s free plan, and Crazy Egg’s free Instant Heatmaps.
Is Microsoft Clarity really free?
Yes. Microsoft Clarity has no paid tier and no traffic caps. The real costs are elsewhere:
- Session recordings are kept for only 30 days (heatmap data for 13 months).
- Each heatmap is capped at 100,000 page views.
- There’s no A/B testing or on-site surveys.
- Microsoft processes your visitor data under its own terms, which some legal teams don’t allow.
Which heatmap tool is best for mobile apps?
Fullstory and Microsoft Clarity offer mobile SDKs. For heatmaps of your mobile website, any tool on this list works, including Crazy Egg, which lets you filter every heatmap by device.
What is the best heatmap tool for web apps and SaaS products?
For web apps and SaaS products, choose a tool that handles dynamic, single-page interfaces and connects behavior to product data. Fullstory suits larger product teams. For SaaS marketing sites and signup flows, Crazy Egg is the best fit.
How much traffic do you need for a heatmap to be useful?
As a rule of thumb, wait until a page has at least 1,000 to 2,000 pageviews before drawing conclusions. With fewer, a handful of visitors can skew the picture. High-traffic pages give you a clear heatmap within days. Low-traffic pages may need a few weeks. Crazy Egg tracks 100% of pageviews on the pages you choose by default, so you aren’t working from a sample.
Can I use two heatmap tools at the same time?
Yes. Heatmap scripts don’t conflict, and many teams run two. A common setup is Microsoft Clarity for free, always-on recordings across the whole site, plus a paid tool like Crazy Egg on the pages that drive revenue, where you need A/B testing, surveys and longer data history. Just make sure both are covered by your consent banner and privacy policy.
Do heatmap tools slow down your website or affect GDPR compliance?
Modern heatmap scripts load asynchronously, so they have little to no effect on page speed or Core Web Vitals. On GDPR: heatmap tools collect behavioral data, so in the EU you’ll usually need visitor consent before the script loads. Pick a tool that masks sensitive fields and offers a data processing agreement (Crazy Egg does both).