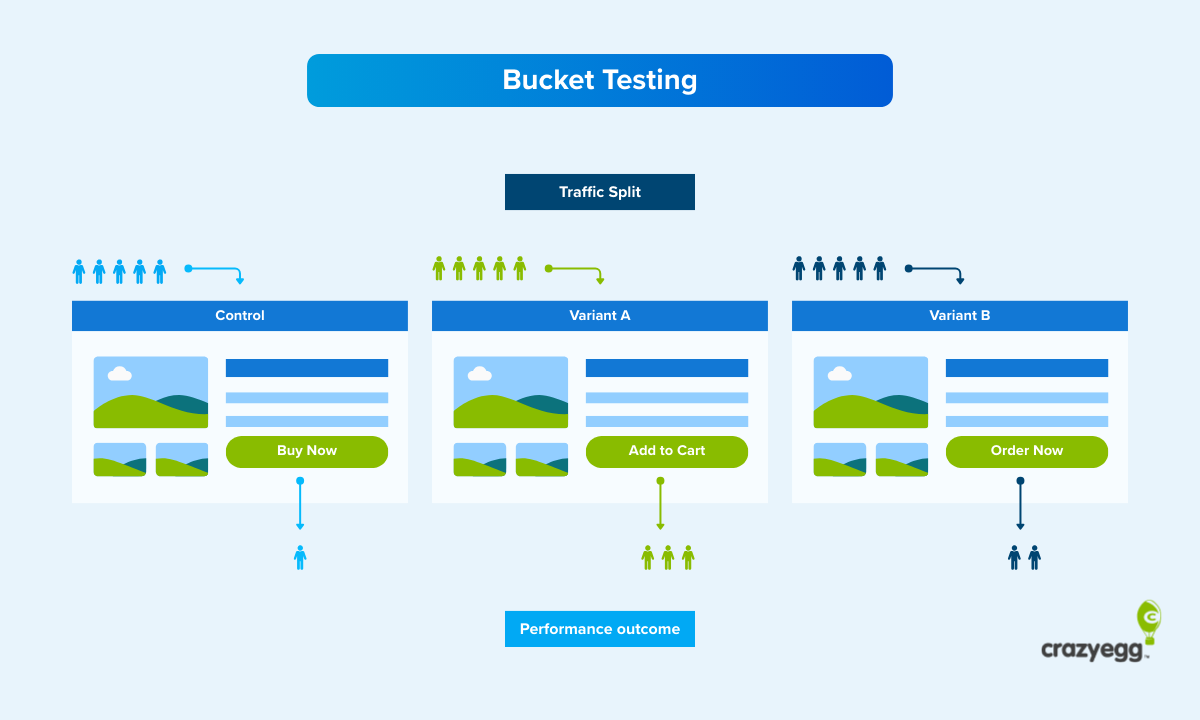
Bucket testing is a controlled experiment where you split website traffic between two or more page versions to find which one converts better.
In the article, I’ll explain what bucket testing is, when it makes sense to use it (and when it doesn’t), and how to run a test grounded in real visitor behavior, not guesswork.
What is bucket testing?
Bucket testing is a controlled experimentation method in which you randomly split your audience into two or more equal groups, or buckets, show them different versions of a page (or any other marketing asset), and measure which one performs better against a specific goal, like improving the conversion rate.
A bucket test example
Imagine your product page attracts traffic but doesn’t convert. You analyze heatmaps and session recordings and realize there might be an issue with the call-to-action button placement.
You have some ideas on how to fix it, but it’s just a hunch.
With bucket testing, you can validate your ideas and find the CTA position that performs best.
You would do it by:
- Creating multiple versions of the page with the buttons in different places
- Splitting the visitors into equal groups
- Sending one group to the original version, called the control
- Sending the other groups to the other versions, called the treatments or variations
- Measuring the performance of each
Visitor buckets engage with the different versions of the web page over the same period, you know the performance shifts due to design changes rather than external factors, like seasonal fluctuations or competitors’ marketing campaigns.
Bucket testing benefits
Thanks to bucket testing, you can:
- Understand target audience preferences. The test is a chance to learn about your visitors’ motivations.
- Make data-driven decisions. Instead of debating which option is better, you let the data decide.
- Get a stakeholder buy-in. Quantitative test results are easier to defend to decision-makers than gut feelings.
- Reduce risk. You test changes on a portion of your traffic before rolling it out to everyone. If the variation underperforms, only a fraction of visitors are exposed.
- Boost profits through compounding gains. Improvements stack up across the funnel, increasing revenue and reducing overheads.
Bucket testing vs. A/B testing vs. split testing
Bucket testing, A/B testing, and split testing refer to the same kind of controlled experiment — randomly splitting traffic between versions and measuring which one performs better.
The three terms come from different contexts:
- Bucket testing comes from software engineering, where frameworks assign users to buckets for experimentation.
- A/B testing is the most common term today and covers experiments with two or more variants.
- Split testing originated in direct mail marketing, where marketers would split a mailing list between two versions of a letter to see which pulled more responses.
Use whichever term your team uses. I will stick to bucket testing in this article.
Bucket testing vs. multivariate testing vs. multi-armed bandit testing
The main principle behind bucket testing, multivariate testing, and multi-armed bandit (MAB) testing is the same: you show different versions to different groups and measure performance.
The difference is in how many elements you test and how you split the traffic.
- In bucket testing, you change one element and split traffic evenly between a control and variation(s). It answers a single question: Did this specific change improve the key metric?
- In multivariate testing, you make changes to multiple elements at the same time — say headline, image, and CTA button — and test every combination to find which mix performs best. If your page gets enough traffic, multivariate testing compresses several rounds of bucket testing into one experiment. If it doesn’t, seeing statistically significant differences takes a lot of time.
- In multi-armed bandit testing, you split traffic between variants just like in bucket testing. But the split isn’t fixed. An algorithm monitors conversion rates and gradually shifts more traffic to the better-performing version. The advantage is speed. You stop sending visitors to a losing variant while the test is still running. The tradeoff? The variants don’t see the same volume of traffic under the same conditions, so the results are less definitive.
| Key difference | Best use case | Main limitation | |
|---|---|---|---|
| Bucket testing | One change at a time, traffic split evenly. | Measuring the impact of one change | Multiple experiments needed to test many elements. |
| Multivariate testing | Multiple elements simultaneously | Finding the best mix of elements | Needs high traffic to reach statistical significance. |
| Multi-armed bandit testing | Dynamically shifts traffic toward better-performing variants during the test | Optimizing conversions quickly | Results are less definitive |
When should you run a bucket test?
Use bucket testing when:
- You need certainty to make key decisions: Bucket tests give you the definitive answer. Vital for major decisions that are likely to move the metric, but also time-consuming, and so not practical for minor, less consequential tweaks.
- You test a single change: The test works for individual changes to one design aspect. If you change two or more at the same time, you won’t know which one caused the lift. For multiple changes, use multivariate testing.
- You have an evidence-based hypothesis: A data-backed assumption about user behavior gives the test focus.
- The page gets enough traffic to produce a statistically significant result within a reasonable timeframe (1-2 weeks): If you can’t get big enough samples, use qualitative research methods like session recordings or heatmaps. They’re no substitute for experiments, but might be enough to surface the root cause.
- The experiment isn’t time-sensitive: The bucket test takes at least a week, so it works best for ongoing optimization, rather than short campaigns, like flash sales or seasonal promotions. Multi-armed bandit testing is better here.
- When you don’t know the answer: Statisticians may frown here, but the solution is sometimes obvious without testing.
How to run a bucket test in 6 steps
Running a bucket test comes down to six steps:
- Define your goal and choose the metrics to track
- Formulate the hypothesis
- Design variations
- Split the traffic and launch the test
- Gather enough data for statistical significance
- Analyze the results and iterate
1. Define your goal and choose the metrics to track
First, pick the key metric you’re trying to improve.
These could be:
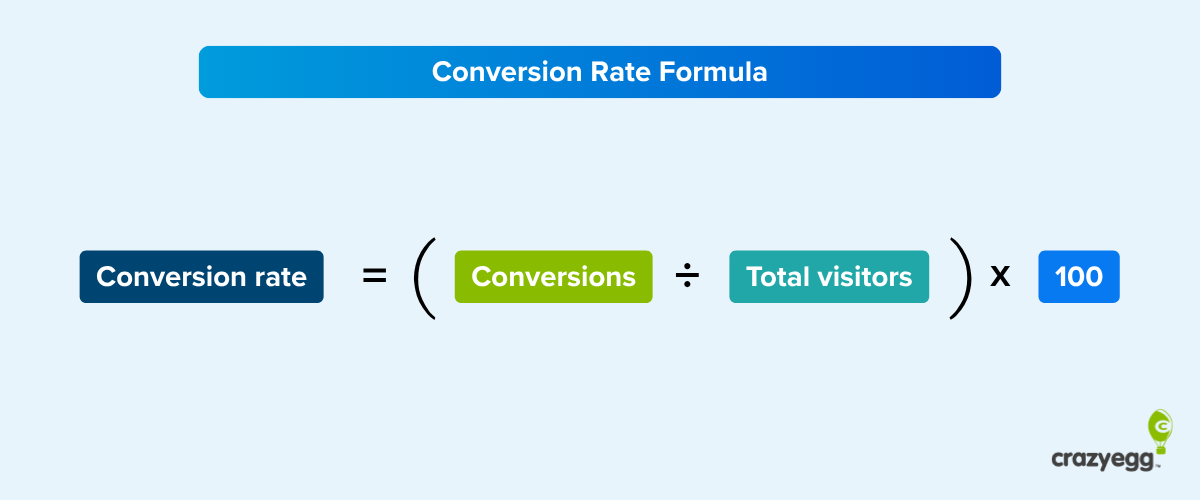
- Conversion rate
- Click-Through Rate (CTR)
- Average Order Value (AOV)
- Bounce rate and exit rate
- Time on page
- Scroll depth
- Page load speed
Or any other metrics aligned with your goal.
Pick also countermetrics to monitor for unintended side effects.
A variation may increase the conversion rate, but if the bounce rate skyrockets at the same time, it may cancel all gains.
2. Formulate a hypothesis based on insights from analytics
To write your hypothesis, use this template.
“Changing [element] from [current state] to [proposed state] will increase [metric].”
For example, “Moving the CTA button to the center of the page will increase the conversion rate by 7%.”
Formulating the hypothesis requires an understanding of the issue and its impact.
This understanding comes from quantitative and qualitative data:
- Web analytics: Find pages that attract traffic but fail to convert. Or where visitors bounce.
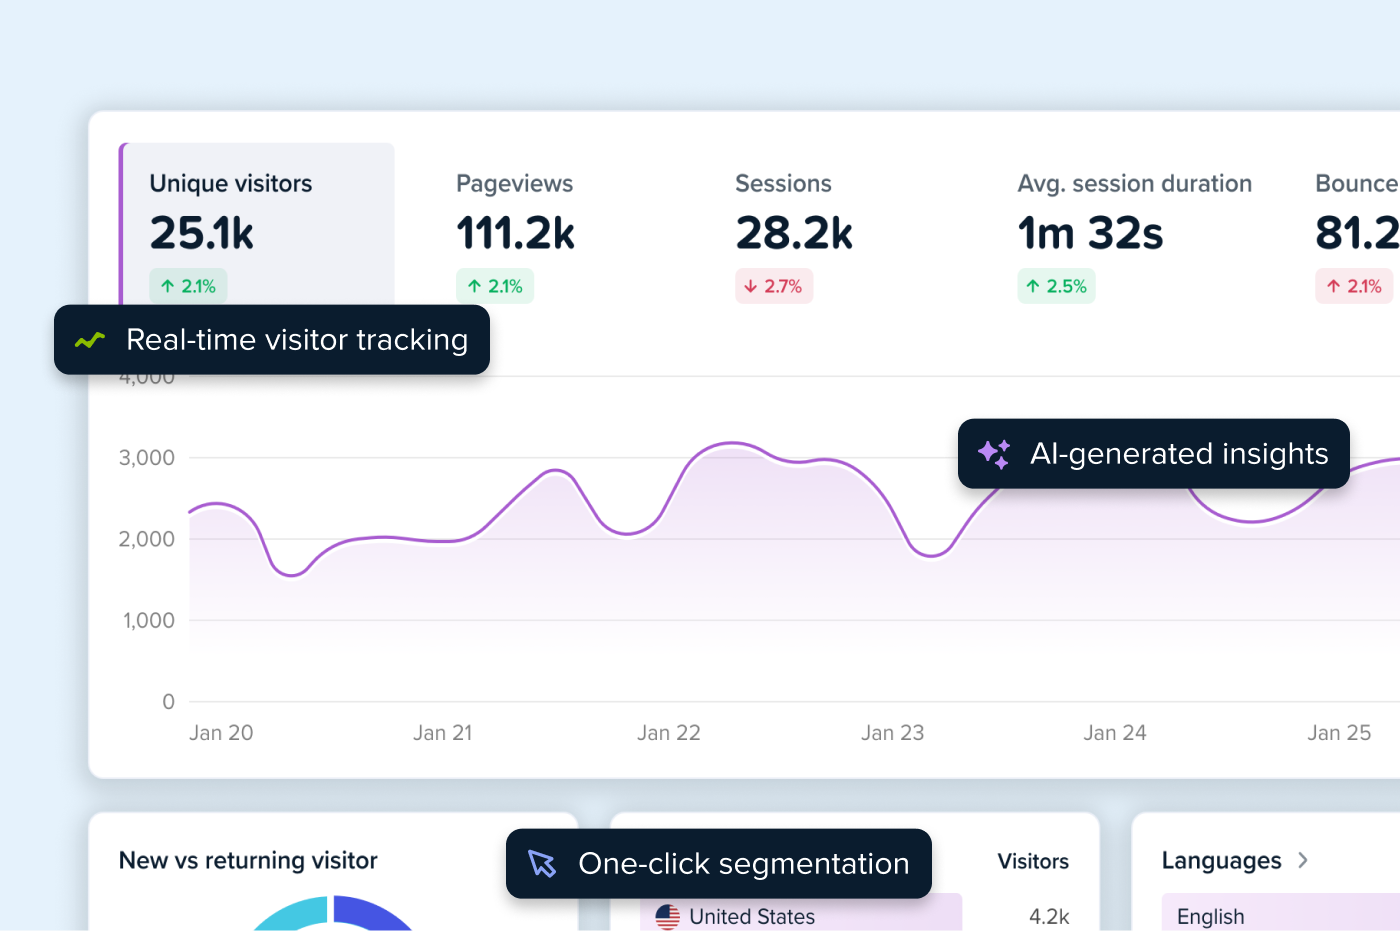
- Funnel analysis: Analyze user journeys across your website and learn where they drop off.

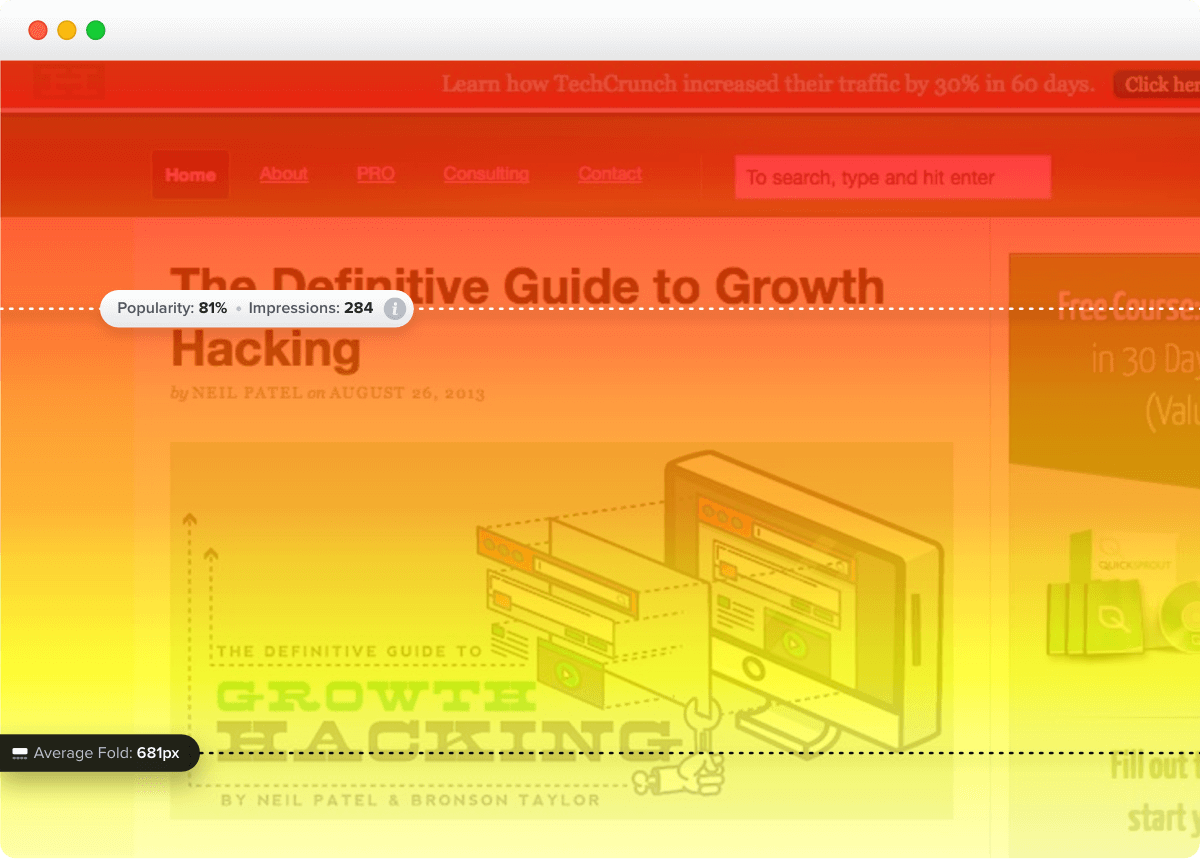
- Confetti and click maps: Discover where exactly your users click and how often to identify focal points. That’s how Wall Monkeys realized their website visitors preferred to jump right into search instead of clicking on the CTA button.

- Scroll maps: Learn how far users scroll and which parts of the page they never see. This can explain why they don’t engage with user interface elements or miss crucial information.
- Session recordings: Watch your clients interact with your pages. Their hesitations, rage clicks, back-and-forth scrolling. Intuit used them to understand why the Tsheets pricing page wasn’t converting despite high user engagement.
- Error reports: Find JavaScript errors that cause user friction.
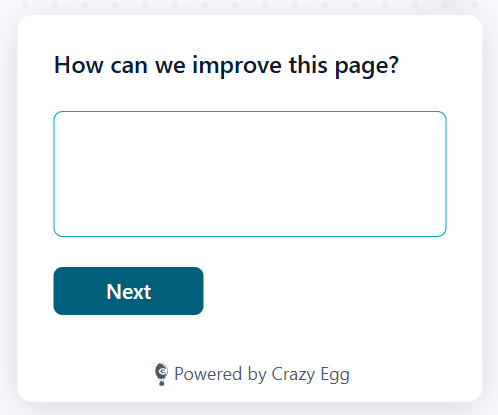
- User surveys: Ask visitors to report bugs, errors, or poor user experience, or suggest improvements.
To get a complete picture, you’ll likely use a number of the tools.
For example, funnel analysis to find the pages where users drop off, heatmaps to find patterns in how different segments interact with the page, and session recordings to see what exactly individual users do.
3. Design the variations
To run the bucket test, you need at least two versions: the current one, the control, and a new one, the variation or treatment.
Common elements to test include CTA buttons, headlines, images, page layout, forms, and navigation.
| What you can change | |
|---|---|
| CTA buttons | Text, color, size, shape, placement on page |
| Headlines and copy | Wording, length, tone, value proposition framing |
| Images and video | Hero image, product photos (lifestyle vs. product-only), video vs. static, sliders vs. single image |
| Page layout | Content order, column structure, spacing, what appears above vs. below the fold |
| Navigation | Items shown, labels, placement, full nav vs. stripped-down vs. hidden |
| Forms | Number of fields, which fields are required, validation style, single-step vs. progressive |
| Checkout flow | Single-page vs. multi-step, guest checkout default, progress indicators, express payment placement |
| Pricing presentation | Tier structure, anchoring, annual vs. monthly default, trust signals near price |
| Social proof | Review placement, testimonial format, trust badges, and customer counts |
| Pop-ups and opt-ins | Timing (immediate vs. delayed), trigger (scroll, exit intent, time), incentive type, display format |
| Urgency and scarcity | Stock level warnings, countdown timers, free shipping thresholds |
| Mobile UX | Tap target size, sticky CTA bars, thumb-zone placement, simplified navigation |
For example, Miller and Smith removed images from their pages to help visitors find what they needed more quickly, and they added links to unclickable elements to improve navigation and reduce dead clicks.

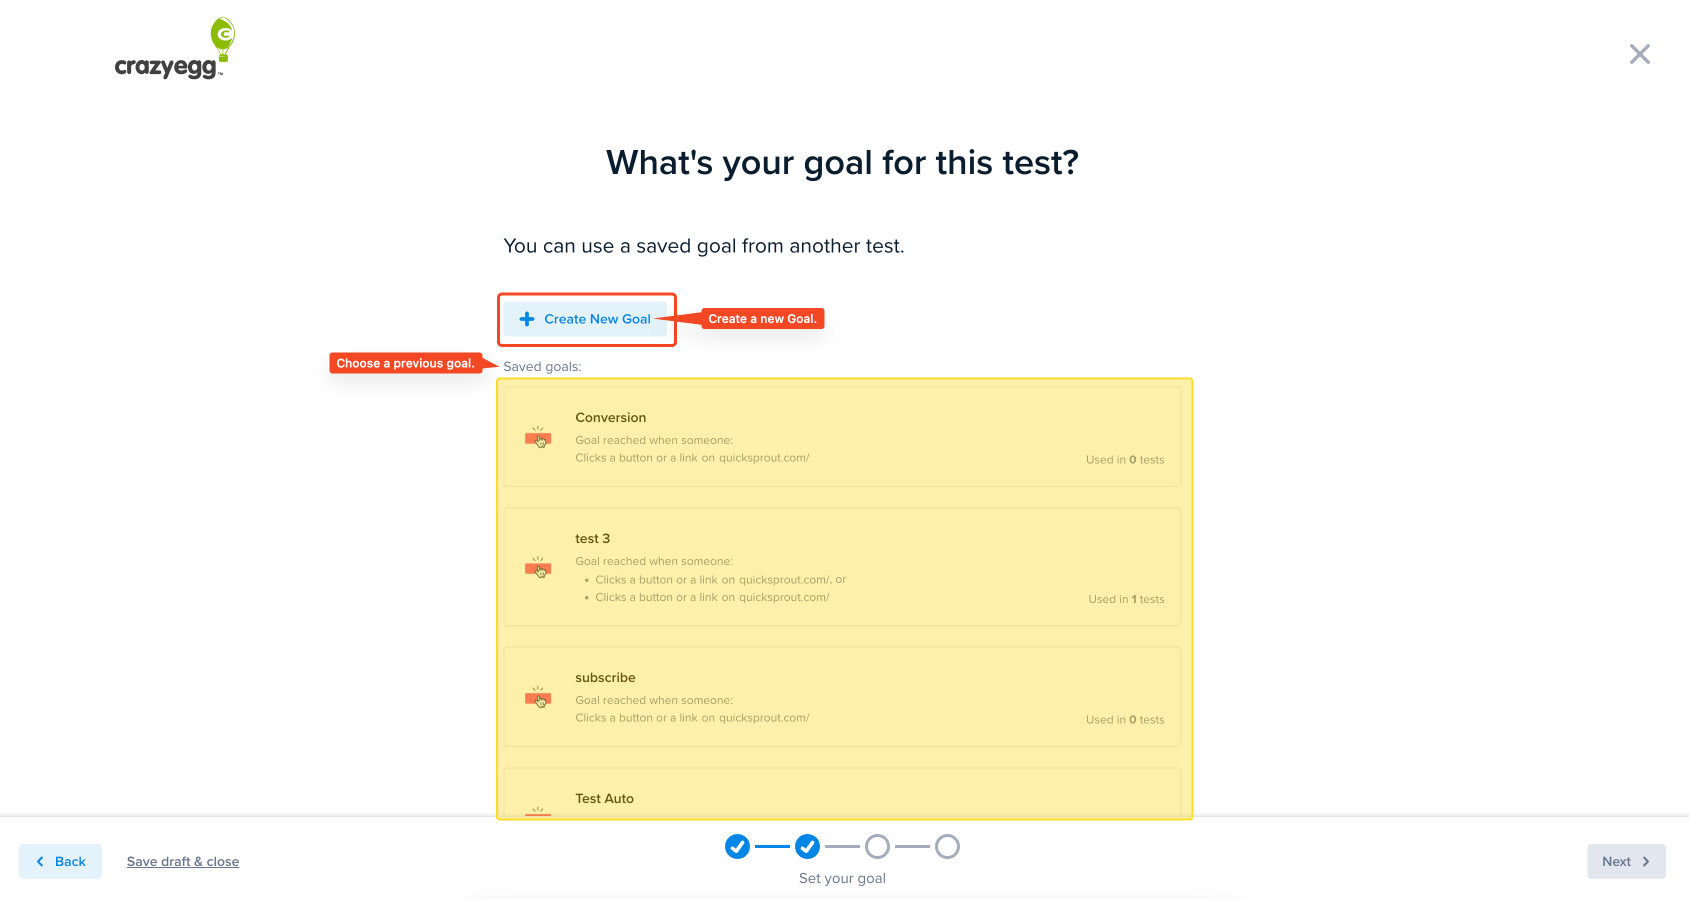
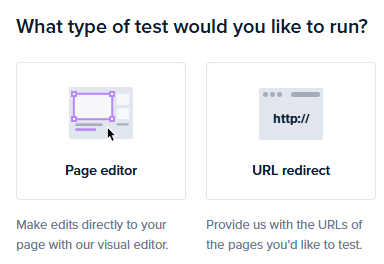
With Crazy Egg, you can create your variations inside the app with the visual page editor. So no need to wait for your busy developers.
4. Split traffic and launch the experiment
Once your control and variation are ready, and you’ve set your goals, randomly assign visitors to each version.
A couple of things to bear in mind:
1. Each visitor must see the same version every time they return.
We call it ‘sticky assignment’, and you enforce it with cookies or user IDs that lock visitors into their assigned bucket. Without it, the same person might see the control on Monday and the variation on Tuesday, which skews the test results.
On sites using a CDN, caching can break sticky assignment and result in the wrong variant being served to returning users. You can prevent it by adding experiment-assignment cookies to cache keys.
2. If you’re running multiple tests at once, use mutual exclusion groups so each visitor only enters one test. Otherwise, you can’t isolate the impact of each test.
Most A/B testing tools, including Crazy Egg, handle all this automatically, but if you’re running a custom setup, it’s worth checking.
5. Wait for statistically significant results
Statistical significance means the difference between your variants is unlikely to be due to chance.
The 95% threshold is the norm. It means that if you repeated the test 100 times, you’d see a similar outcome 95 times.
Statistical significance requires the right sample size.
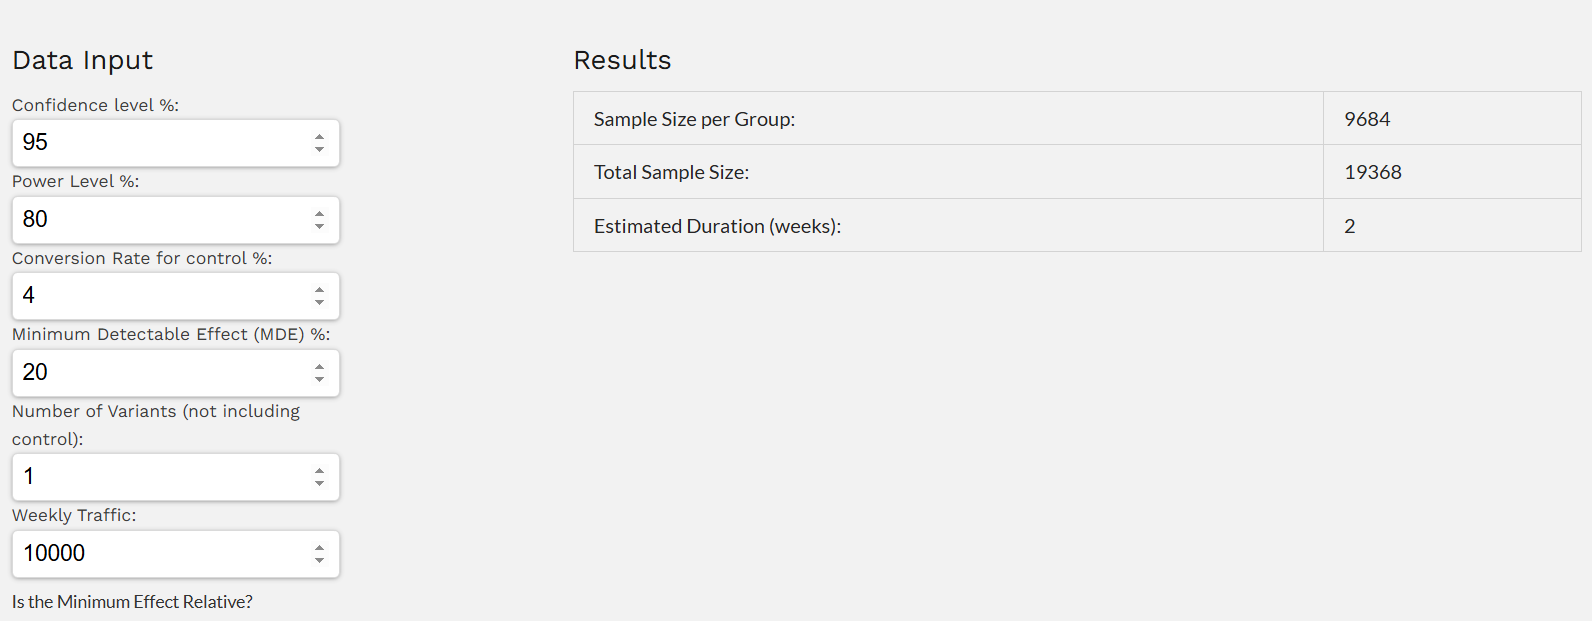
There are a bunch of online calculators, like the CXL one, that you can use to determine the minimum sample size, as long as you have the three inputs:
- Baseline conversion rate
- Minimum effect you want to detect
- Confidence level
Let’s say your baseline conversion rate is 3% and you’re hoping to achieve a 20% lift at 95% confidence, you will need roughly 9,500 visitors per variant.
In practice, most teams don’t take the time to calculate sample size ahead of time, then sample sizes are accidentally too small. So teams assume they have statistical significance before they actually do.
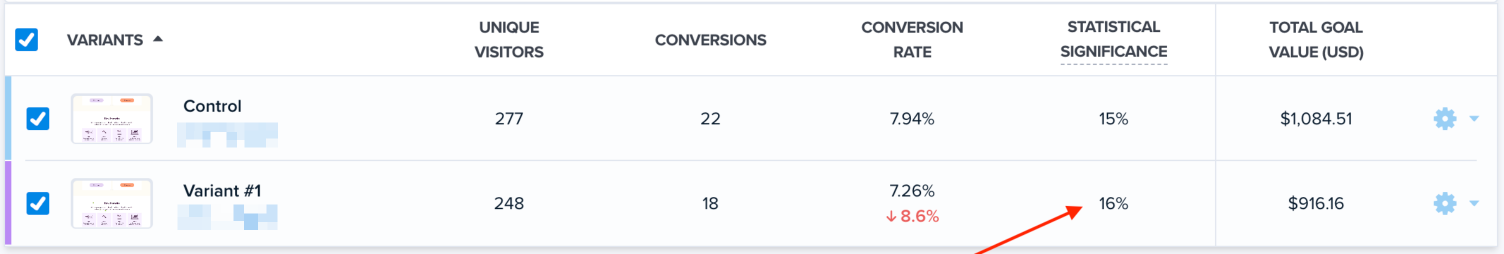
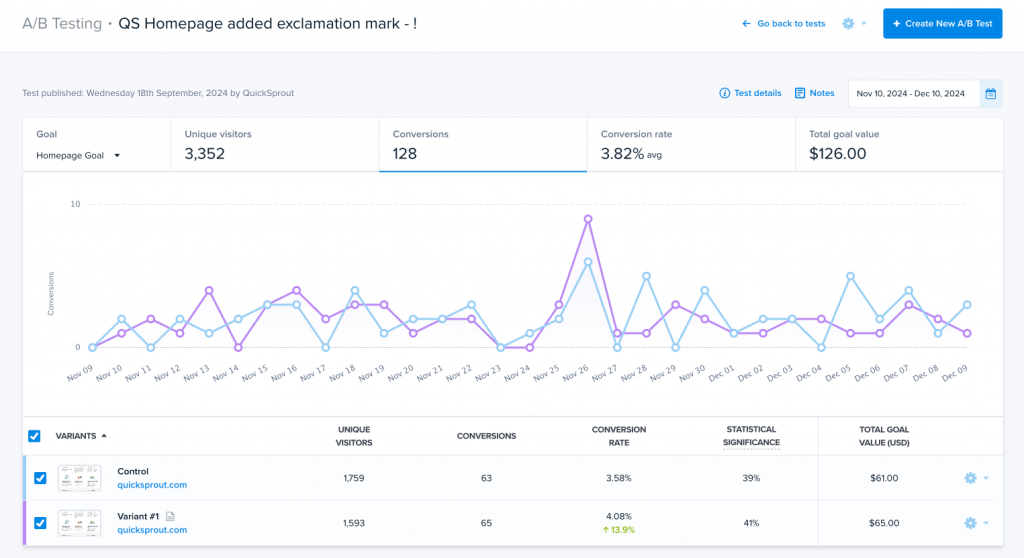
A simple workaround is to not worry about sample size and wait for the test to hit 99% statistical significance instead. Crazy Egg displays the figure on the A/B testing dashboard as results come in, so anyone can do it.
Whichever approach you choose, follow these two rules:
- Run for at least one full business cycle. On an e-commerce website, that’s a week because purchasing behavior patterns change between weekdays and weekends.
- Run the complete test. Don’t rush to call the winner even if the initial results seem clear.
6. Analyze, implement, repeat
When the test reaches your target sample size, the difference is statistically significant, and the treatment wins, deploy it.
But don’t stop there:
Go back to behavioral data.
Study the heatmaps. Watch the session recordings. Formulate new hypotheses.
Remember Wall Monkeys I mentioned above? Their first test saw “only” a 27% conversion rate increase. But it informed a second one, which brought a 550% lift.
And if the difference isn’t statistically significant?
Check other metrics. You may not have hit the primary goal, but you might have improved the user experience or made the page easier to maintain, and the change may still be worth deploying.
And even if not, it isn’t a wasted effort. You’ve just eliminated one insignificant variable. So it’s easier to find the significant ones.
The bucket test is only as good as the hypothesis behind it
Most bucket testing guides start with “pick something to test” and jump straight to setup.
To make consistent improvements, you can’t guess what to test.
You need to identify underperforming pages, watch what visitors actually do on them, look for the friction, and build hypotheses around that evidence. And only then use bucket tests to validate them.
Crazy Egg combines bucket testing with analytics, heatmaps, session recordings, and surveys in one platform. So, you can start analyzing user behavior, collecting feedback, and testing today — for free!