Most companies know CLV matters. Few actually measure it. Why?
The math is hard, the data is messy, and the results don’t feel trustworthy.
This guide gives you a reasonable path: a simple CLV framework you can implement using data you already have. No fancy tools or data science degree required.
What Is Customer Lifetime Value?
Customer lifetime value (CLV) is an estimate of how much revenue or profit a typical customer will generate for your business over the course of their relationship with you.
No matter how complicated your CLV model becomes, there are always three core variables that attempt to describe your average customer:
- How much revenue they generate
- How often they buy
- How long they stay with your brand
Businesses use different formulas to capture CLV. The formula needs to account for the way the company makes money and how customers buy.
A SaaS startup looking to sell annual subscriptions starting at $2,400/month needs a different model of CLV than an online store that sells funny T-shirts for $12 each.
For example, the SaaS provider is going to be looking at startup metrics like average revenue per user (ARPU), average contract value, and churn.
The ecommerce brand will care a lot about average order value, revenue per session, and repeat purchase rate.
Both of these brands care about the value they generate, but because their customers buy in vastly different ways, they need different CLV models in order to accurately capture data in the real-world.
What’s the point of measuring customer lifetime value?
While businesses use different models to calculate CLV, their goals are fairly consistent. The difference here is how much they’re willing to invest in accurately modeling CLV, and how much weight they put on it in terms of decision-making and goal-setting.
Even if you use a fairly straightforward formula in a basic spreadsheet, CLV can help you:
- Identify your best customers and segments. A rough estimate can still make it clear which groups are worth more than others.
- Prioritize your marketing efforts. If one channel delivers customers that spend more and stay longer, this is where the budget should go.
- Set realistic acquisition budgets. Knowing CLV means you can avoid spending an unsustainable amount to acquire new customers.
- Optimize customer retention strategies. You can focus on retaining the most valuable customers.
As companies invest more in CLV modeling, the uses get more sophisticated:
- Find more customers like your best ones. High-CLV profiles can feed into lookalike modeling for ad platforms.
- Set smarter prices and discounts. Understanding lifetime value helps you weigh short-term promotions against long-term profitability.
- Shape the product roadmap. The behaviors of your most valuable customers can guide which features or services you build next.
- Forecast future value. Predictive CLV models estimate how new customers are likely to perform based on their early actions.
Consider AirBnB, which sells to both the owners of the properties and the patrons who rent them. How do they determine the value of a new listing?
There is a ton that they have to take into account in order to measure the real incremental value created by a new listing. How much value, for example, does a new listing cannibalize from existing listings? How much of the new listing’s value is a result of AirBnB’s own marketing initiatives?
You can read about how Airbnb measures listing lifetime value on their tech blog, which illustrates both the complexity of measuring CLV and why it’s so valuable to understand.
Is CLV the same as LTV?
No. Most people use CLV and LTV interchangeably, and honestly, that’s fine for everyday conversation.
The difference is that LTV looks backward at what customers have already spent, while CLV looks forward at what they’re going to spend.
LTV is historical. It’s the actual revenue sitting in your bank account from past purchases.
CLV is your best estimate of future revenue based on purchase patterns, retention rates, and customer behavior. You are looking forward, using CLV to set
The Simple Way To Model CLV
Many businesses use a rudimentary CLV model to guide decision-making. It’s not intended to be 100% accurate so much as a directionally useful model.
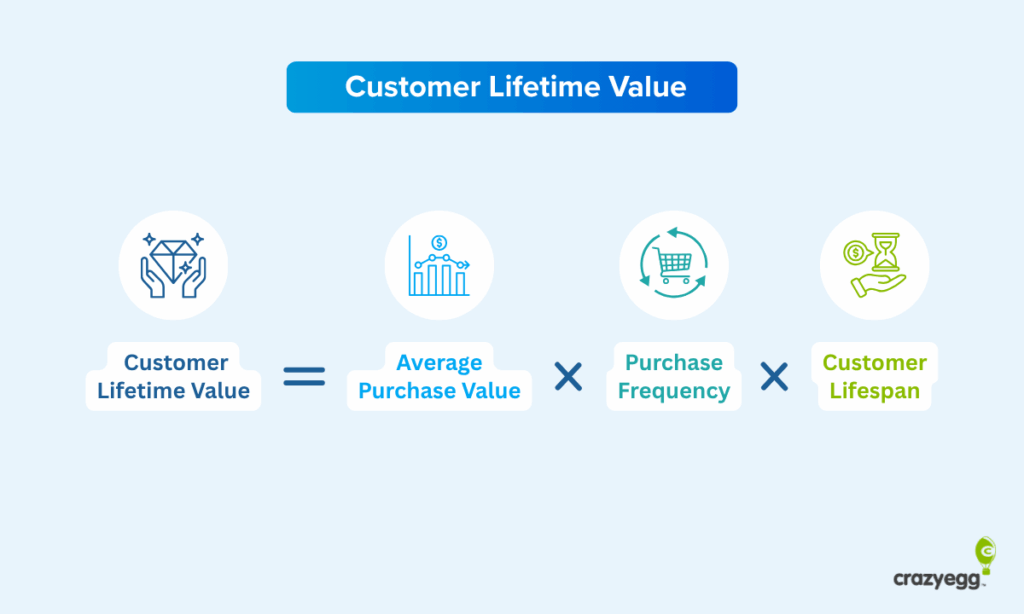
The really simple formula that works well enough is:
CLV = Average Purchase Value × Purchase Frequency × Customer Lifespan
That’s it. There are three variables.
Let’s walk through a simple example. Say you run an online store:
- The average purchase is about $25
- Customers tend to order 6 times per year
- Most customers stay active for about 2.5 years
Plug those numbers into the CLV equation: $25 × 6 × 2.5 = $375.
That’s a rough CLV. Is it perfectly accurate? No. Is it going to help you value your company in the eyes of an investor? Absolutely not.
But for everyday operators, this number is very useful. One obvious use is to line CLV up against your customer acquisition costs. If you’re spending $50 to bring in a customer who’s worth about $375 over their lifetime, that’s sustainable.
You can make enough to reinvest in your business and pay good people what they are worth. But if acquisition creeps closer to $150-$200, the math stops making sense. It’s going to be really hard to grow.
It’s also useful for quick comparisons between groups of customers.
For example, if your CLV for customers who buy jackets and outerwear is far higher than those who shop T-shirts and pants, that tells you something about where to focus your marketing spend.
Refining the Simple CLV formula
The 3-variable CLV formula is fast, easy, and gives you a basic sense of customer value.
But these variables aren’t appropriate for every business model. That’s one issue.
And, even where the variables are appropriate, there is some real-world nuance that needs to be taken into account to ensure that the calculation is accurate enough to be useful.
Let’s dig a little deeper into each variable and where some brands will have to adapt the simple CLV formula to more closely mirror their business model.
Average purchase value
Average purchase value is what it sounds like: how much money comes in per transaction, on average.
In ecommerce, you’ll hear it called average order value (AOV). In B2B, it might be average contract size or deal value. Service businesses may just think of it as the typical invoice amount. Whatever you call it, the idea is the same.
This seems straightforward: take your total revenue, divide by the number of purchases, and you’ve got an average.
But there are a few things to keep in mind:
- Margins matter. A $100 order with a 10% margin is very different from one with a 60% margin ($10 profit vs. $60 profit). Many brands factor in their margins to calculate an average profit per purchase instead of gross revenues. This way, they aren’t overestimating the actual value customers have on their bottom line.
- ARPU works better for some models: In a subscription model (like SaaS), customers pay recurring fees rather than make discrete “purchases”. Here, a monthly average revenue per user (ARPU) is more useful than average purchase value.
- Product mix can mask useful averages. A handful of high-ticket deals can make the average look higher than what most customers actually spend. For example, if you sell $20 and $2,000 items, you might have an average of $175, which doesn’t really represent a typical transaction at all.
- Discounts and returns eat into value. Refunds and promotions lower the real purchase value. If 15% of orders are returned, or you are always running a 20%-off sale, ignoring these factors inflates CLV and hides the true picture.
Purchase frequency
This measures how often the average customer buys in a given period, usually a year.
In businesses with contracts, you are basically tracking the billing cycle (i.e. how often invoices go out). In non-contractual models, like retail or ecommerce, you are looking to find a realistic purchase frequency that predicts future behavior based on historical performance.
Some things to think about include:
- Irregular purchases. Seasonal businesses (like, florists, ski rentals, tax prep) will have lumpy purchase patterns. Always measure across a full annual cycle to capture the true pattern.
- Light vs. heavy buyers. If your top 10% of buyers purchase every month, but the other 90% buy once or twice a year, the blended average might be 4 purchases a year. Yet that doesn’t help you capture or predict behavior for either type of customers. Segmenting light vs heavy users avoids being misled and helps you accurately model CLV for both types.
Lifespan
This is the trickiest variable: how long does a typical customer stick around?
It’s crucial to understand because lifespan is a multiplier on everything else. Small improvements in lifespan can lead to massive increases in CLV.
The challenge is that lifespan is backward-looking, but you need it to accurately predict future value. Here are a few things to help you think through lifespan:
- Fixed horizons. Instead of assuming “forever,” many companies calculate 12- or 24-month CLV. This avoids older customers making new cohorts look weak by comparison.
- Renewal rates. In B2B, lifespan is tied to renewal probabilities. If contracts run for two years with a 70% renewal rate, that math tells you how long revenue will realistically last. For example, if you start with 100 customers, you will have 70 by the end of the first contact, 49 by the end of the second, and so on.
- Subscriptions and churn. Lifespan is a direct function of churn: if 5% cancel monthly, the average lifespan is about 20 months (1 ÷ 0.05). In other words, 5% churn means it takes your average customer about 20 months to churn out.
Collecting and Analyzing CLV Data
The first step is pulling together the basic transactional data, like revenue, purchases, and how long customers stick around. For most businesses, this data lives in:
- Ecommerce platforms like Shopify and BigCommerce, which track orders and customer purchase history.
- Payment processors like Paypal and Stripe, which track transactions and timing.
- CRM software like HubSpot and Salesforce, which record customer details and interactions.
- Accounting and billing software like Quickbooks and Xero, which track invoicing and payments.
You do not need expensive data infrastructure to get started. Export all the transactions into a spreadsheet and organize it so that you can get a clear picture of your customers, purchase dates, order values, and if they are still active.
From there you can start to calculate the averages you need to run some basic CLV numbers.
Adding behavioral data to the picture
The transactional data we’ve described so far is very good at telling you what has already happened. Behavioral data can help you understand why the results happened and forecast what’s likely to happen again.
This is where you start to see patterns in customer engagement metrics that can help you distinguish between one-time buyers and high-value customers.
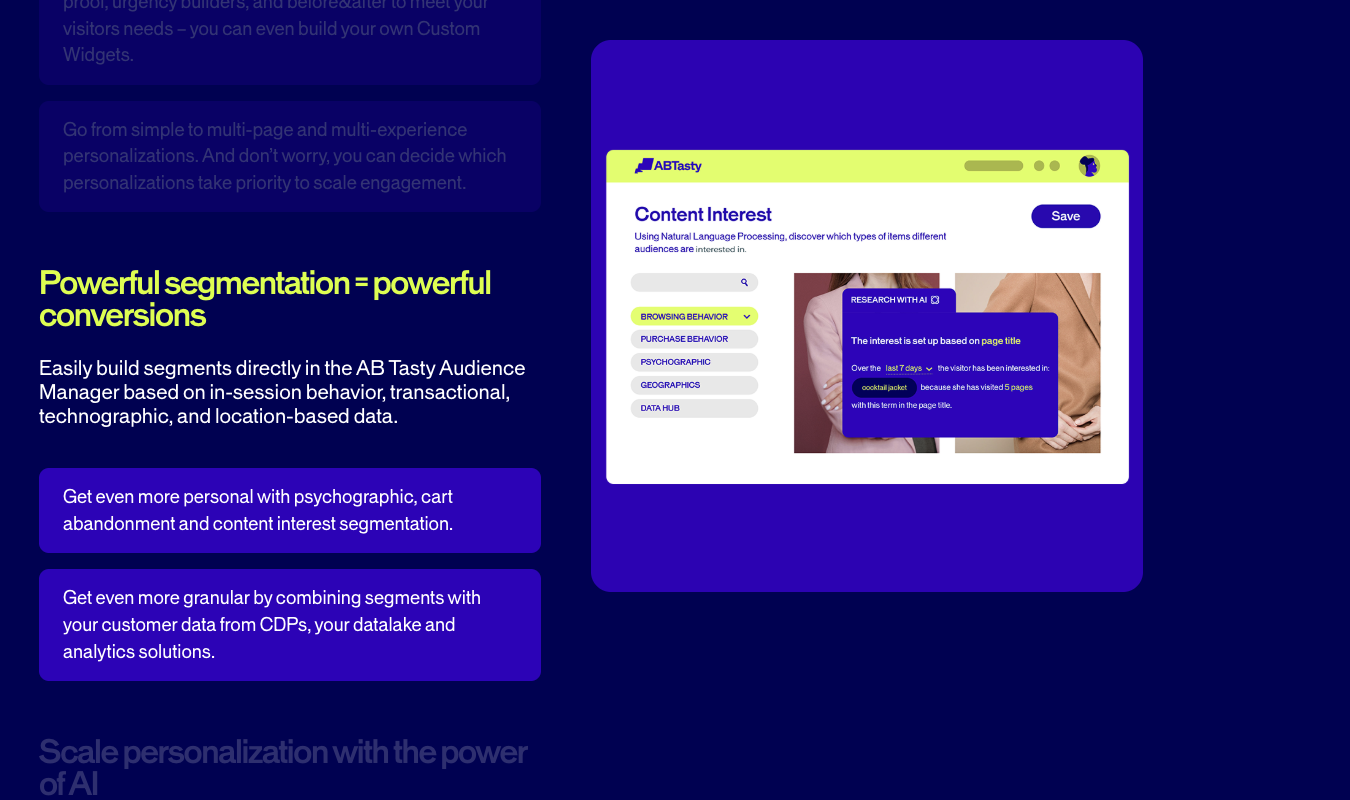
Analytics platforms like Google Analytics 4 (GA4) and Crazy Egg can help you see:
- How often customers return to your site between purchases.
- Where potential buyers lose interest and drop out of your website funnel.
- Which products, content, and topics they engage with most.
- Where your highest-CLV customers are coming from.
Additional marketing and engagement tools help you understand which customers are likely to generate more value over time.
Ad platforms like Meta Ads and Google Ads let you compare CLV across different acquisition channels to see which traffic sources bring higher-value, longer-lasting customers.
Email marketing services like Mailchimp or Klaviyo let you segment customers by engagement. For example, you could see if high open rates signal someone will be a high-CLV customer. You can also see which campaigns correlate with longer customer lifespans or higher purchase frequency.
You might discover that customers who open three emails in their first month have 4x higher lifetime value than those who open none. Or, that customers who engage with educational content stick around twice as long.
This kind of insight lets you refine your CLV estimates and focus retention efforts where they’ll have the biggest impact.
Cohort-Based CLV Modeling
This is where you break customers into cohorts, which are simply groups of people who share a common starting point, like the month they signed up.
Why does this matter?
Because cohorts reveal the story behind the topline numbers. You might have overall revenue growth, but if each new group of customers is churning faster, long-run growth will be very challenging.
Conversely, if retention is improving with each new cohort, your growth should stack over time. Instead of filling a leaky bucket, your new users are joining others who stick around.
SaaS startups in particular live and die by this view. They need to know if the cohort that joined in January sticks around longer than the one from June, or if a new feature rollout improved retention for customers who came onboard after launch.
Cohort-based CLV is how you answer questions like:
- Are our newest customers more valuable than the ones before?
- Are product or marketing changes showing up in customer value?
You don’t need a custom data science stack to get started. Many analytics tools offer cohort reports out of the box or with very little setup.
With a little effort, you can build a simple cohort view in Excel or Google Sheets. As the business scales, you can layer on more advanced analytics platforms.
Tips for Measuring Customer Lifetime Value
Getting this right takes multiple iterations. Here are a few practical tips to help you start building an accurate CLV model without getting overwhelmed:
- Start small. Pick a single, easily-defined group of your customers, like one product, one service, or just the loyalty program. Figure out how to accurately model and track the data at that small scale and build out from there. This allows you to figure out a lot of the issues (and there will be many) that come with accurately tying revenue and costs to customers.
- Use behavior over demographics. Put more weight on what customers do than who they are. Something like a RFM analysis where you look at purchase recency, frequency, and value of transactions is more helpful for identifying high-value customers than where they live or how old they are.
- Be realistic about lifespan. Estimate lifespan conservatively until you have enough historical data to make credible projections. Don’t calculate CLV based on customers who stay active forever.
- Test your model. Plug in 10-20 actual customers to your model to see if they fit. Does your best customer have the highest CLV? Do the one-time buyers show appropriately lower CLV values? This is a quick way to see if your model’s assumptions hold water. If possible, run formal backtesting to validate your model using historical data.
Having a simple model of CLV is better than having no idea what type of revenue you can expect from new customers. As new data come in, use it to keep improving and refining your model.