With the sunsetting of Universal Analytics (UA) and the promotion of its successor Google Analytics 4 (GA4) back in July 2023, A/B testing took a back seat.
Even worse, Google Optimize was discontinued. This was an A/B testing tool built by Google with a deep integration with Google Analytics. Ite was praised by many as one of the best freemium A/B testing tools on the market.
As of September 2023, Google Optimize no longer works. Google’s reason: it didn’t have the features and services customers requested to perform valid and effective A/B tests. In turn, most of the old A/B testing methodologies that were used alongside Google Optimize are no longer supported.
Don’t fret, I’ve got a step-by-step approach on how to set up an A/B test in the newest iteration of Google Analytics. Along with some alternative tools.
A Step-by-Step Guide on Setting Up an A/B Test in GA4
Before we start, it’s important to note that GA4 cannot run an A/B test by itself. For that, you need to use a third-party tool such as Optimizely or VWO.
However, you can still interpret the results from your A/B tests in GA4, and here’s how to do it properly.
Step 1 – Create your event
First, log in to your GA4 account.
Then hover on the gear icon in the bottom left-hand side of your main dashboard and click the Admin button that appears.

Scroll down until you find the Data Display section, and click Events. This section will allow you to specify the actions you want to keep a tab on.

Click Create Event.

Name your event—preferably something unique you can remember and important to the test you’re about to run. Finally, click Create.
Step 2 – Configure your variants
Now it’s time to configure your variants in your newly created event. In GA4, variants refer to different versions of your pages which you’ll be comparing against each other. You need to be very careful in configuring your variants to ensure you’re testing the correct web elements as outlined in your initial A/B testing strategy.
First, navigate to Events. Here, you should see the new event you just created.
Then, choose your new event and click Add Variant. This option will let you create different versions of your web page or application.
Additionally, you can also configure your variants to test different versions of your headlines, images, and call-to-action (CTA) button placements.
Step 3 – Set your objectives
Setting up A/B tests via GA4 can result in getting extensive amounts of data in return. If you don’t know which data points to track, you’ll likely lose sight of the most important metrics in your testing campaign. This is why it’s critical to set clear objectives before initiating your A/B tests, and here’s how.
First, start by defining your metrics. Do you want to get more prospects to sign up for your online service, or get more customers to buy your flagship product from your online store?
Then, pick your target audience. You can filter visitors according to their countries or states of residence, their spending levels, and the amount of times they’ve purchased your products. One example could be a person from Reno, Nevada who has purchased three items in the last five days and has spent less than $100.
Step 4 – Start your test
First, review your campaign and make sure that everything is in the right place.
Depending on the A/B testing tool you’ve decided to use, locate the main control area and initiate your experiment. This action will start your test.
Note: for now, running an A/B test experiment via GA4 is only possible with the integration of a third-party tool like AB Tasty and VWO. More on these tools later.
Once you start the test, and assuming you have a sizable amount of web traffic, GA4 will show different page versions to your visitors and record their subsequent reactions. This part is crucial in understanding how different users access your site, what they do once they get there, and how they navigate through it before taking action or leaving the site.
Step 5 – Analyze your results
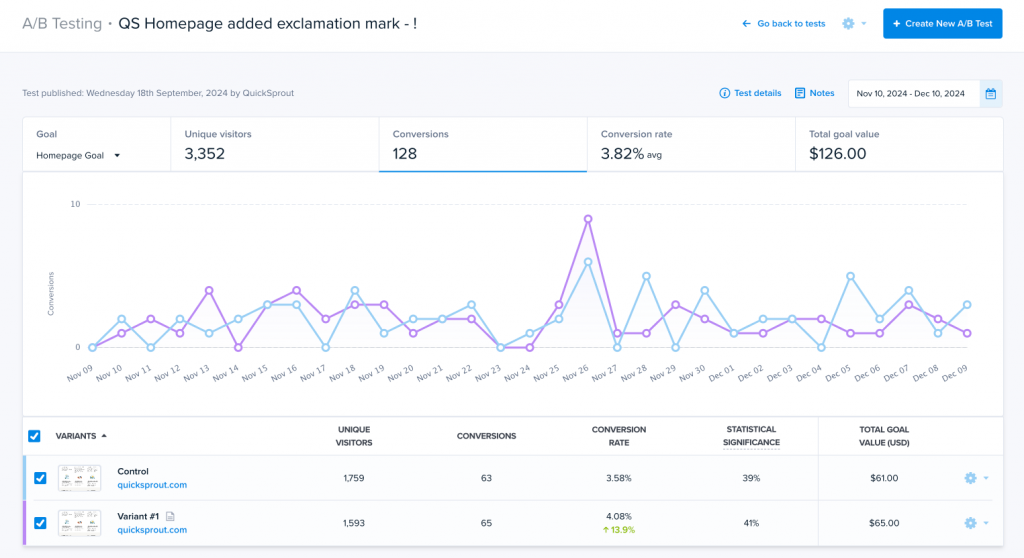
Once your A/B test has been running for a couple of weeks, it’s time to analyze the results. This step is important in determining which page version works best in terms of clickthrough rates (CTR), the amount of time users spend on your pages, and the number of conversions it generates for your business.
To start, make sure you’re still logged in to your GA4 account.
Then, navigate to the Explore section on the left-hand side of your dashboard.

You can think of the Explore section as the main hub of A/B testing in GA4. This is where your testing data is kept and where you’ll spend the most time analyzing your results.
Next, click your newly created A/B test event to open up a card with a more detailed view.
Finally, compare the metrics of how each of your variants has performed over time. Try to look for patterns manually or use GA4’s advanced machine-learning features to identify emerging trends. This will help you decide the page versions you want to serve to your audience moving forward.
Step 6 – Interpret your results
Analyzing your results without proper interpretation of your data can lead your website down the wrong path. To avoid an undesirable outcome, make sure to apply the correct methodology in interpreting your results—and here’s how.
First, take a good look at your metrics and record them in a separate spreadsheet. Important metrics include the percentage of new users, the percentage of users who engaged in new sessions, the total engagement rate, and the average engagement time for users.
In GA4, the most important metrics that typically determine the success of your website are called Key Events. You can mark any event as a key event and track it as such in your reports.
Next, it’s time to compare the two or more variants you’ve created to determine their performance. Which version is keeping the users more engaged, making them stay longer on the page? Are more users interacting with a certain version of the page over the other version?
Once you thoroughly review your data, it’s time to plan your next steps. Is it a good idea to employ the better-performing variant right then, or maybe run more A/B tests before making permanent changes to your web pages?
If the answer to these questions leans significantly more towards a certain page variant over the other, go ahead and implement the changes. If not, maybe it’s better to run additional A/B tests and postpone making a final decision.
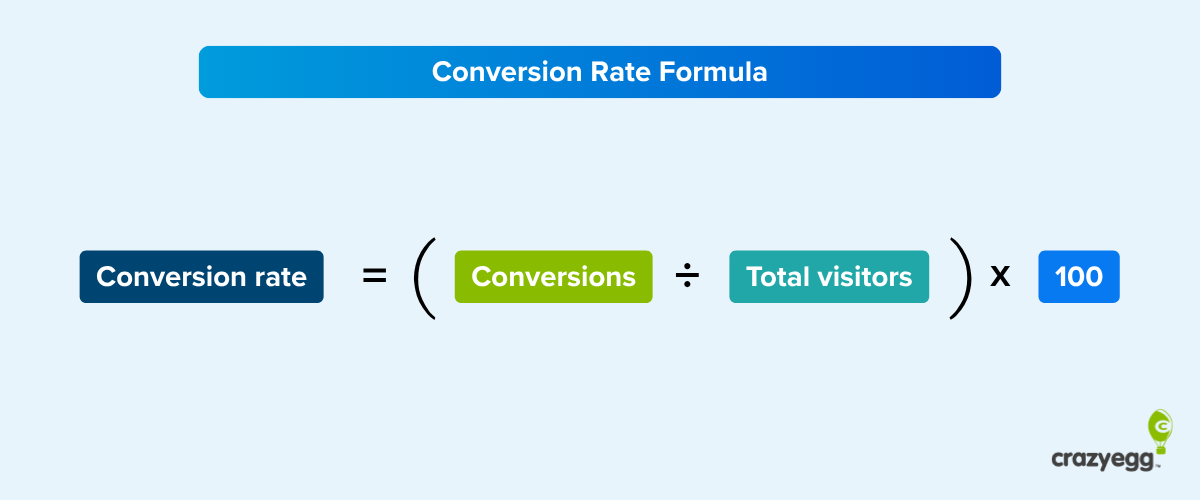
The entire point of A/B testing is to make gradual improvements to your pages in order to optimize your conversion rates. You can do this by singling out a highly impactful page element and tweaking it a little until your visitors start noticing it and engaging with it more (like CTA buttons, headlines, and affiliate link placements). Paired with the correct interpretation of your data, you can make informed decisions to build a winning online business.
Other Ways to Run A/B Tests With Google Analytics 4
You can’t use GA4 independently to perform A/B tests (testing two web elements) or multivariate tests (testing more than two web elements). To enable the full extent of GA4’s A/B testing capabilities, you need to integrate a third-party A/B testing tool with Google Analytics 4.
The most popular A/B testing tools include:
- Optimizely
- AB Tasty
- VWO
All of these are paid tools. Here’s a general overview of each of them.
Optimizely
Optimizely is a multi-purpose digital SaaS that offers content management, content marketing, and digital asset management solutions. You can run A/B tests using its widely popular Web Experimentation tool.

On top of A/B testing, Optimizely also supports multivariate testing. Multivariate tests include comparing many web elements at the same time, as opposed to A/B testing which only compares two web elements at once.
Additionally, the software has a what-you-see-is-what-you-get (WYSIWYG) visual-style editor that requires little or no code knowledge to use. In other words, it can be used by beginners and seasoned marketers alike without requiring outside help from a software developer to run A/B tests.
Optimizely and GA4 integration
Optimizely uses the Google Cloud Platform to enable many of its capabilities, including an integration with GA4. Once connected, you can track your Optimizely Web Experimentation tests directly from the GA4 dashboard.

Furthermore, the software also allows you to send experiment variations to Google Analytics 4 as audiences to compare the performance of your variations in your A/B tests. To access this capability, you need to use the Report Generation feature.
If your websites (known as properties in GA4) use Google Tag Manager (GTM), you need to integrate your GA4 account with GTM and then integrate GTM with Optimizely to unlock the full extent of Optimizely’s A/B testing capabilities.
AB Tasty
AB Tasty is a modern, powerful, and multifaceted A/B testing tool that helps users maximize their conversion rates, improve their website’s search performance, and use statistics to grow their online business.

The platform is open to everyone regardless of their professional vocation in the wider search industry. Put differently, AB Tasty features an intuitive user interface (UI) and a seamless user experience (UX) that can be utilized by digital marketers, product managers, developers, and software engineers.
Additionally, AB Tasty offers a WYSIWYG-type editor to overcome the need for writing excessive amounts of code. Instead, you can focus on optimizing your audience engagement tactics, picking the best-performing web element, and determining the ideal course of action for your site.
The editor comes with a wide selection of widgets, including Countdown, Before-After Image, and Dwell Time Tracking, giving you a well-rounded idea of how your web elements perform over time.

The simple drag-and-drop nature of AB Tasty editor’s design allows you to set up A/B experiments quickly and efficiently.
AB Tasty and GA4 integration
AB Tasty offers two types of GA4 integrations: pull and push.
Essentially, the AB Tasty pull integration happens across three different platforms, including Google Cloud Platform, GA4, and AB Tasty. All three platforms need to be connected so you can perform valid tests. More specifically, the pull integration allows you to receive audience data from GA4 in the AB Tasty dashboard.
On the other hand, the AB Tasty push integration lets you send your AB Tasty data to GA4 while your A/B testing campaigns are running. Once it’s adequately set up, you can use the GA4 features to create reports about your audience, analyze your return on investment (ROI) for paid campaigns, and track the most important key performance indicators (KPIs) for your website.

VWO
VWO is an all-encompassing digital marketing platform that offers access to user behavior analytics, comprehensive A/B testing, and versatile program management solutions.

Following in the footsteps of its many competitors, VWO features an extensive WYSIWYG visual editor to help ease beginners into the software without forcing them to learn the intricacies of writing code. For more advanced users, the tool offers an HTML editor as well.
Additionally, WordPress users may find VWO’s dashboard instantly recognizable due to their similar style and menu arrangement in both interfaces.

Depending on your plan, the software can also grant you access to a broad selection of different A/B testing functionalities, including integrated heatmaps, customer surveys, cross-domain testing, and device-specific campaigns.
VWO and GA4 integration
VWO lets you integrate both your existing and upcoming A/B testing campaigns with GA4 via two different methods.
If the GA4 code is installed directly on your website, you need to consult the following VWO and GA4 integration guide. Once you configure the integration, you can create GA4 audiences directly from the VWO dashboard and save your audience filters for future use in your GA4 and VWO accounts. You can also import your GA4 audiences to your VWO account.

If the GA4 code on your website is installed through Google Tag Manager, you need to follow the steps from this VWO and Google Tag Manager integration guide in order to sync your GA4 account with your VWO account.

Crazy Egg
Crazy Egg A/B Testing is a tool you can set up in seconds and start testing in minutes. It’s simple to use, it enables both A/B and multivariate testing, and it supports AI automated split testing alongside a manual traffic split.

With Crazy Egg A/B Testing, you can experiment with different headlines, product descriptions, and sales copy to filter out and implement the ideas that perform the best on your site. It’s accessible and open to beginner marketers and professional data analysts alike, offering a guided three-step process to start your testing today.
Crazy Egg and GA4 integration
Crazy Egg A/B Testing has the capability to send custom events in your GA4 account whenever a user views one of your testing variants. These custom events come with the name and ID of the viewed testing variant, as well as the name and ID of the full A/B testing campaign.
The tool can be connected to your GA4 account via two main methods:
- If you have GA4 installed directly on your website, follow this Crazy Egg A/B Testing and GA4 integration guide
- If your GA4 account is set up using Google Tag Manager (GTM), follow this Crazy Egg A/B Testing and GTM integration guide

Either installation method works well between your website, your GA4 account, and your Crazy Egg A/B Testing tool account. Once completed, you’ll have access to a comprehensive dashboard to view your statistics, a clean and modern UI to configure your tests, and an AI-powered text suggestion feature to help you generate new testing ideas in times of a creative setback.
Tips for Running A/B Tests
A/B testing is a tough skill to master. Why? It requires creative thinking, advanced knowledge of statistics and data, and making hard decisions that sometimes go against the common wisdom of the masses.
However, that doesn’t mean you can’t learn the intricacies of A/B testing and apply them in your campaigns. Here are five A/B testing tips to help improve your conversion rates and take your business to the next level.
Come up with a clear test hypothesis
Instead of randomly creating different variants without rhyme or reason, a better approach would be to decide on a reasonable A/B test hypothesis and try to prove or disprove it.
For example, one hypothesis could be the following: “Headlines with odd numbers in them have better clickthrough rates (CTRs) compared to headlines with even numbers or headlines with no numbers at all.”
Then, you can focus on the benefits of proving or disproving your initial hypothesis. In our example, we can extrapolate the following idea: “Publishing more top X lists, with X being an odd number, can greatly increase our user engagement and may contribute to a natural bump in our organic traffic.”
Even if your hypothesis turns out to be incorrect, which is how it typically goes, you can always modify it accordingly to reflect the newest information from your tests.
Create a system and stick to your rules
A/B testing is a science, and it needs a clearly defined structure to work.
According to conversion rate optimization expert Lars Lofgren, A/B testing can triple your conversion rates by strictly following these seven rules:
- Treat your control as the golden standard—Your test variants do not stand on equal ground. Unless your variants outperform your control by a large margin (more than a 10% improvement), the control is usually the one to beat.
- Get at least 2000 users within 30 days—If you’re not getting enough traffic, there’s no point in running an A/B test. The ideal outcome is to get more than 20K users through your test within 30 days, but, if you’re a smaller website or blog, you can probably get away with 2000 people interacting with your testing variant for your strategy to work.
- Wait for one week—Users don’t behave identically over a week, or even during a single day. If you get significant improvements right out of the gate (something like a 10% increase in hits), it’s necessary to wait for at least a week before you declare your new variant a success.
- Only adopt variants at 99% statistical significance—The old academic wisdom of accepting a result with a 95% statistical significance is not fully applicable to the online world of digital marketing. Adopting any variants with less than a 99% statistical significance rate will result in launching way more false positives than initially thought, leading to a significant decline in the performance of your erroneously chosen variant over time.
- Drop tests below a 10% improvement rate—You can’t allow 2-5% improvement rate tests to run for months on end, it’s simply not cost-effective. Instead, launch between 6 and 12 tests in that same time frame and shut down all tests that perform below the designated 10% lift.
- Shut down underperforming tests after one month—If a test doesn’t cross the 10% improvement rate mark after running for 30 days, shut it down. Some tests may be trending toward a winning outcome, but they can quickly decline into the low one-digit percentages if you let them run on a long enough time frame.
- Keep testing while you wait for your results—Composing new A/B tests takes time. If you time the creation of your next test to coincide with the end of your current test, you’ll be wasting data that could’ve been used for at least two more new tests. Having virtually no downtime between your tests is the only winning strategy.
Collect user feedback
A/B testing is heavily dependent on your customers’ opinions about your brand. Hence, it’s important to collect information about your products or services before running a lengthy test.
For example, if you plan to test your logo’s tagline, you can ask your customers to define your product or service using a multiple-choice questionnaire. This approach will increase the chances of them answering the question, as well as attract more people to participate in the survey. Then, you can take the winning variants and test the ones that received the most votes.
Here are some questions you can ask in the survey:
- What’s the one defining thing that makes you want to own our product/service?
- What convinced you to make your first purchase?
- How would you describe our product/service to a friend?
Make big changes to test user behavior
Testing the color of a CTA button or the placement of an affiliate link is a tried-and-true methodology to improve your conversion rates. These tests are simple to set up, result in easy wins, and you can shut them down quickly if they’re not showing any long-term potential.
Sometimes, however, it’s good to jump out of your comfort zone and start testing on a deeper strategic level.
For example, one idea could be to remove an entire section of your landing page or significantly alter the entry-level pricing of your main service. This will give you a better idea of your users’ behavior and how it oscillates when encountering bigger and more impactful changes to your website.
Don’t blindly copy your competitors’ hypotheses
Even if your business models are similar, mindlessly copying your competitors’ A/B testing hypotheses is a fruitless exercise. The circumstances under which they were performing their tests were probably vastly different than yours. Plus, their customer base is likely not identical to yours, so, why should they behave the same?
Sometimes, it won’t hurt to get inspired by your competitors. But, everyone repeating the same testing tactics will render those same tactics ineffective in the long run.
Case in point, be as ingenious and creative as you can while running your tests. Avoid short-term thinking and future-proof your A/B testing methodologies with hard work, originality, and clear strategic business goals.