There are smart people who say that running an A/A test on your website is a waste of time.
But there are also other smart people who consider running routine A/A tests necessary to ensure that you are really finding wins with A/B testing.
Both perspectives are valuable. Let’s cover everything you need to know in order to determine when to run A/A testing, and when there are better uses of your resources.
Overview of an A/A Test
In this section, we’ll cover the purposes of an A/A test, how it works, how it is different from A/B testing, and some of its drawbacks.
An A/A test is an experimental technique used to make sure that your A/B testing tool is working as it should. Think of it as a quality assurance (QA) check that verifies your experimental setup is:
- Allocating traffic correctly
- Collecting data reliably
- Reporting results accurately
The point of running an A/A test is not to discover anything new. It’s simply a reliable way to ensure that your testing tool is working correctly. That way, when you run an actual experiment, you can be confident that any interesting results you observe were not caused by the tool itself.
In addition to showing you that your testing environment is in working order, an A/A test is also a good way to:
- Establish an accurate baseline conversion rate, which will help you determine an appropriate sample size for future experiments.
- Quantify the natural variance in conversion rates, which helps you wisely interpret the results of real experiments.
Knowing both of these factors is important if you want to run A/B testing to improve your site. To understand why, let’s take a closer look at the experimental design of an A/A test.
How A/A testing works
During an A/A test, you split traffic randomly between two identical versions of a web page. Because both groups of users are seeing the same page, there should not be a significant difference in the results.
To break the A/A test process down into steps:
- Traffic to a page is divided into two groups
- Both groups are shown the A version of the web page
- Data for key metrics is collected for both groups.
- Once enough users pass through the test, you can interpret the results.
What you expect to see in the results of an A/A test is that there is no significant difference in the performance between groups. Since they interacted with an identical page, you ought to see near identical results.
If you do see a large difference in results, that’s problematic. It could indicate that traffic was not randomized correctly or that there is a problem with how the tool is collecting data. The A/A test has alerted you to a problem that you should investigate.
The results for both groups won’t be 100% identical.There are bound to be slight differences between the performance, even though both groups of users saw the same page. Quantifying this “natural variance” is important for interpreting future results.
For example, during an A/A test, you might see a 3.1% conversion rate on one page and a 3.3% on the other. This does not mean your tool is broken (most likely), it just means there is a natural variance of about 0.2%. You can factor this “noise” into later A/B testing, which will help you conduct more accurate analysis.
A/A test vs A/B test
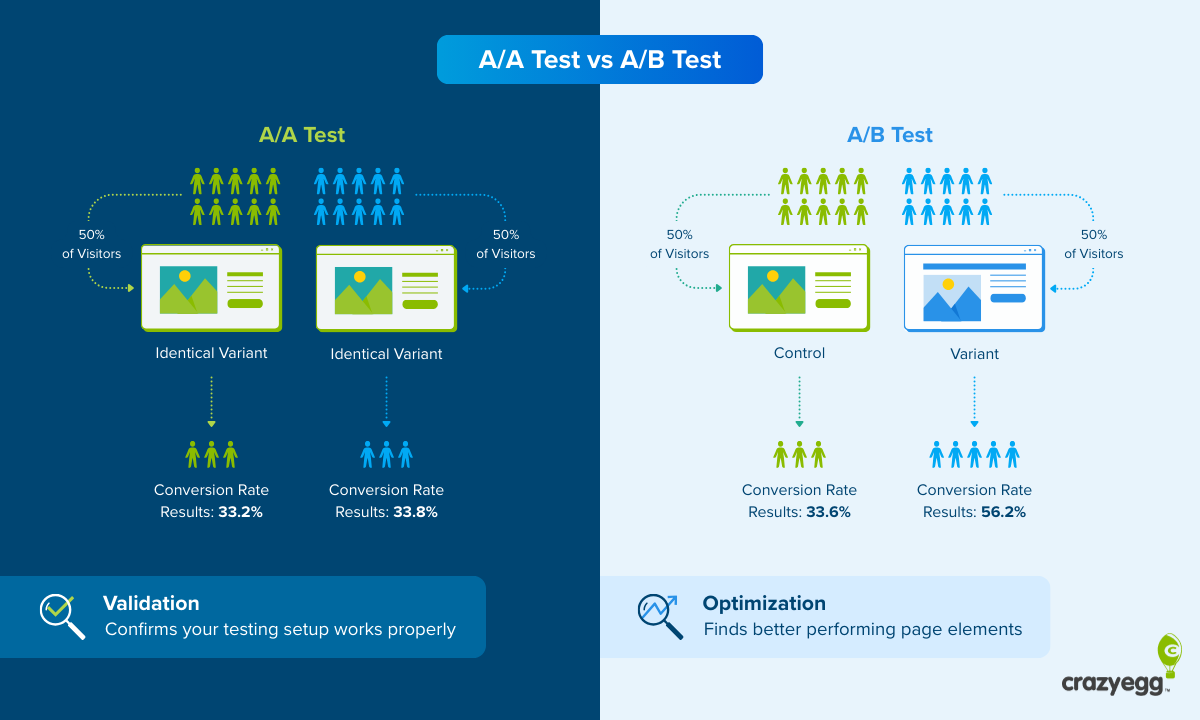
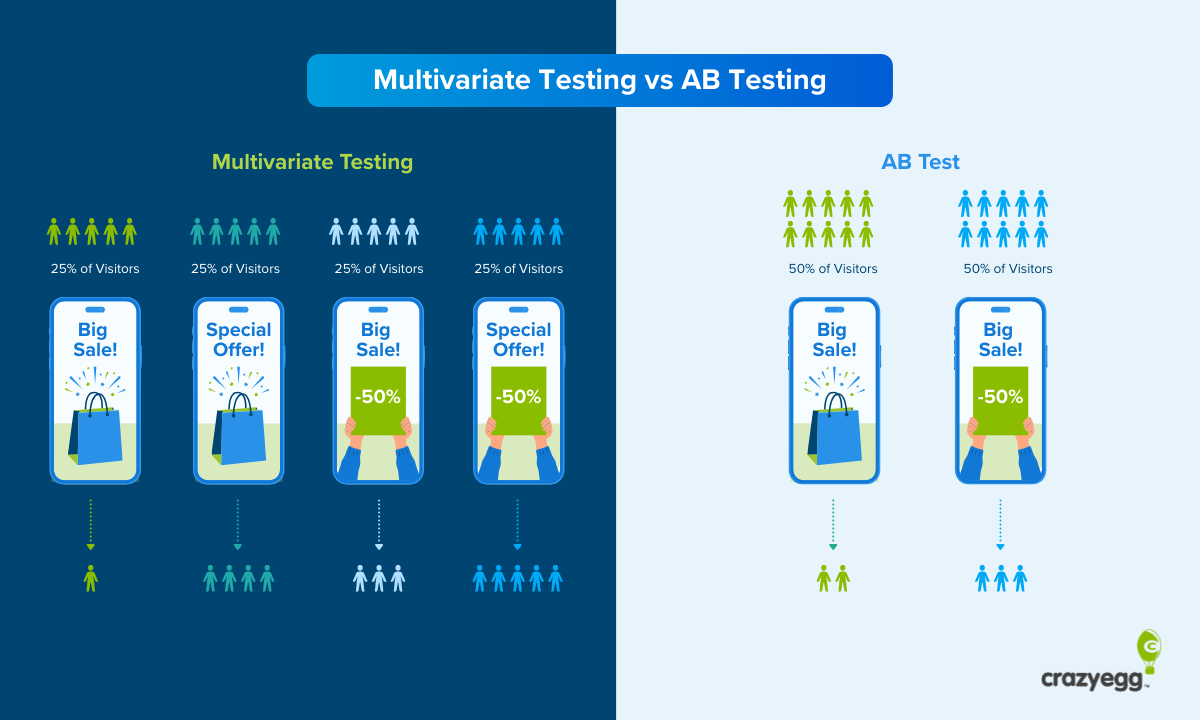
Where an A/A test shows different groups of users the identical web page, an A/B test shows groups of users different versions of a web page: either the A version (the control) and a B version (the variant). In a standard A/B test, a single element is changed. In a split test, more dramatic changes are tested.
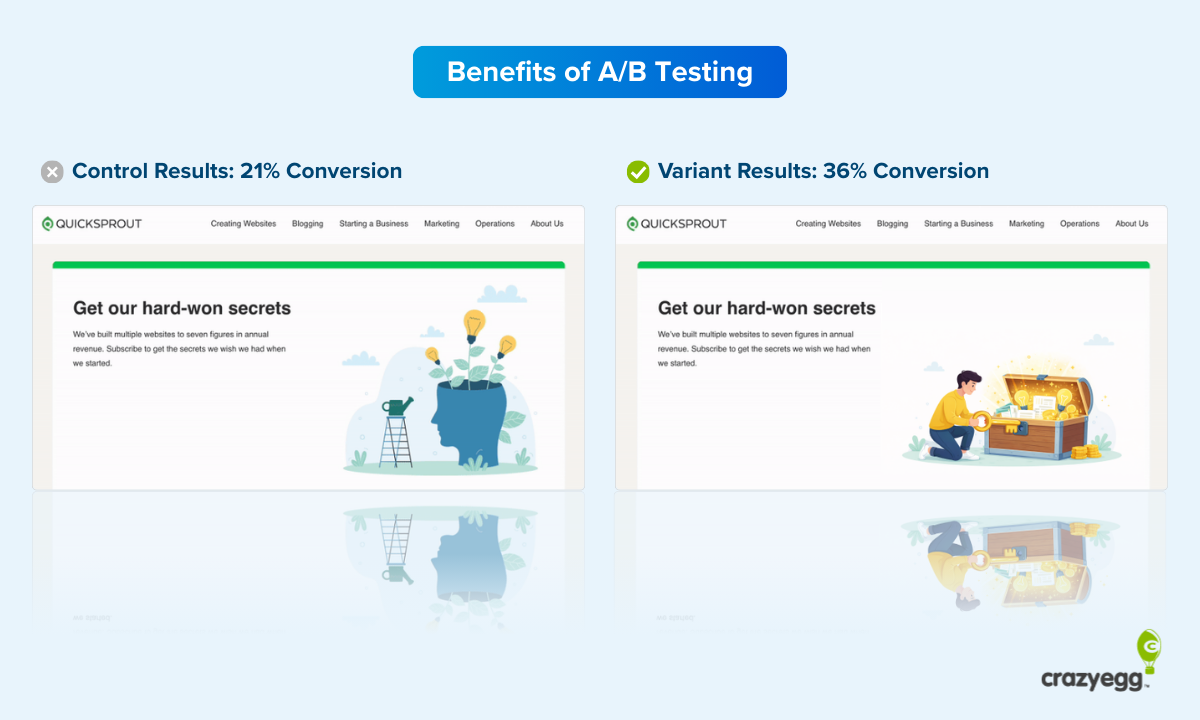
In either case, the purpose of running A/B tests is to discover whether or not a variant outperforms a control, with the long-term goal of finding improvements that are proven to increase key website metrics, like clicks and conversions.
Because you are showing users different pages during A/B testing, you can see whether or not the change that you made has a positive impact.
If you have run A/A testing ahead of A/B testing, then you have a good idea of the natural variance. You’ll know how much “noise” to expect in your test results, which can prevent you from over-interpreting the meaning of small differences in performance observed after an A/B test.
Drawbacks of running an A/A test
While it is a very reliable method to ensure that your testing platform is functioning correctly, there are some tradeoffs to running A/A testing:
- It takes time away from conversion rate optimization (CRO). An A/A test needs to run for at least one or two weeks, sometimes longer. During that time, you can not alter the page in any way. This means that you will be unable to make changes that might increase the page’s performance, such as running an A/B testing or CRO audit, which could lead to lost revenue.
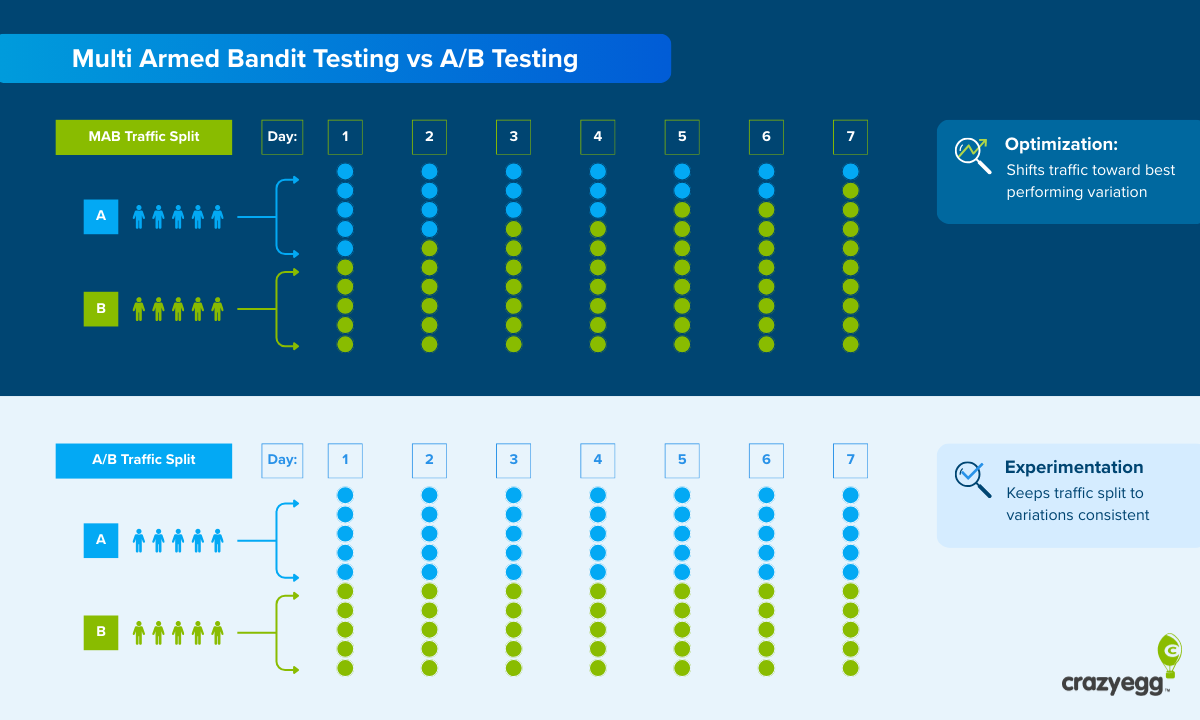
- It won’t help you check the accuracy of multi-armed bandit (MAB) testing. If you run A/B testing using multi-armed bandit (MAB) algorithms, running an A/A test won’t validate your testing environment. An A/A test requires a fixed, randomized split, whereas MAB methods dynamically shift traffic toward variants that are performing better.
- It will declare false positives some of the time: If you use a 5% significance threshold (which is normal), then you can expect about 1 in 20 A/A tests will show a statistically significant difference in performance.
As long as you understand these drawbacks, A/A testing is a safe and fairly low-risk way to reduce uncertainty and prevent you from misreading results.
When Should You Run an A/A Test
Some people advocate running routine A/A testing (say once every quarter), which will help you feel confident that your tools are working properly. But even if you didn’t want to do that, there are a handful of scenarios where you should really run an A/A test.
1. Validate your testing environment
Because it can prove that your setup is working properly, many teams choose to run an A/A test:
- When they are using a new testing tool. Whether it is their first time running A/B testing or they have migrated to a new testing platform, many teams elect to run an A/A test to ensure that everything is working correctly.
- When they see a discrepancy in testing results. For example, let’s say that an A/B testing tool reports a different conversion rate than you see in your web analytics, or different sales numbers than you see in your ecommerce platform. The data is getting messed up somewhere, and an A/A test will show whether the tool is at fault, or let you rule it out as the source of the problem.
- To assure clients who are suspect of A/B testing. Sometimes people who are not familiar with A/B testing are skeptical of the results. Agencies can use an A/A test to show their clients that the tool has no effect on the outcomes they see in test results.
2. Validate your testing methodology
Beyond confirming that your testing tool is working properly, A/A testing can be used to QA your entire experimental setup and design. It can be used to help you:
- Find implementation errors. A broken tracking code or faulty integration might lead to an A/B test that shows significant results accidentally. An A/A test will surface that problem immediately because any significant results are a red flag.
- Test new workflows or reporting. If you have changed how tests are launched or analyzed, an A/A test is a low-risk way to validate the new workflow end to end.
3. Establish baseline ranges for conversion rate
A/A tests show you how much the conversion rate naturally fluctuates. You are almost always going to see a range between the performance of one group and another (even though the pages are identical) and
Quantifying this range helps you avoid overreacting to small “wins” in future A/B tests that are more likely just random noise, and set realistic expectations of what a real improvement looks like.
4. Determine appropriate sample size
By observing the real-world variance in an A/A test, you can make better decisions about:
- How large your sample size needs to be
- How long future tests should run
You can estimate conversion rates and variance based on historical data, but an A/A test will give you real data on how the traffic behaves.
How To Run an A/A Test
Running an A/A test is fairly straightforward using an A/B testing tool like Crazy Egg. You follow the same basic process as you would for an A/B test, except that you show the same page to all users in the test (A/A instead of A/B).
But, because the goal of A/A testing is completely different from A/B testing, the key considerations at each step are different as well.
Let’s walk through the full process.
1. Pick a page to test
The best page to run an A/A test depends on your goals.
If all you want to do is validate that the tool is working properly, then you can run the test on any page that:
- Has a lot of traffic. About 8-10k sessions per month is good. Less traffic than that will require you to run the test for a long time in order to reach statistical significance.
- Let’s test your primary metric. If you plan to A/B test a conversion metric like sales, then you want to run an A/A test on a page where sales occur and you will be able to monitor that metric.
If you are interested in benchmarking the typical conversion rate, then you will want to run an A/A test on a page that mirrors the page (or pages) you plan to test.
For example, if I run an A/A test on my homepage and discover the conversion rate is 1.7%, that will give me a good benchmark for my homepage. I can’t then go and A/B test a product page or a pricing page and assume that the conversion rate benchmark I got on my homepage is going to hold true for these pages.
So if you plan to A/B test a landing page, and you want to find the baseline conversion rate, you should run an A/A test on that landing page.
2. Set up the test
Once you select a page to test in your testing platform, it will usually ask you to create a variant. You may be offered a discrete option to run an A/A test, but often these tools are set up for A/B testing, so just follow that process and create a “variant” that doesn’t have any changes.
Once you have your pages set up, the tool will ask you for several inputs:
- Average monthly traffic: estimate this based on historical data. If you have steady traffic, averaging the last three months of traffic is reasonable.
- Average conversion rate: estimate this based on historical data. If you are tracking multiple conversion types, use the primary conversion goal for this rate.
- Minimum detectable effect: enter the smallest change in the conversion rate that you are looking to detect. About 1-2% is probably fine. The smaller the MDE, the more traffic you will need to reach statistical significance.
- Significance level: enter 0.05 (5%), which is the default setting for most tools. This means you are willing to accept a 5% chance that the results you get are due to random chance.
- Statistical power: enter 0.8 (80%), which is the default setting for most tools. This means there is an 80% chance you will detect a real effect, and a 20% chance your test will fail to detect a real effect.
With an A/A test, there shouldn’t be any significant change in conversion rates, which means that you are probably safe using an MDE of 1-2% and the standard settings for significance level and statistical power.
That said, if you have conversion rates below 1%, you may have to set MDE lower in order to be sure that you are able to detect a problematic variation.
Once you plug in the inputs, most testing tools will calculate the necessary sample size and estimate the test duration.
3. Run the test
Let the test run until it has reached statistical significance and it has completed at least 2 full business cycles. I would stop the test after 14, 21, or 28 days in order to minimize any day-of-week effects.
Don’t look at results during the test. Early results are likely to be skewed one way or the other, which will make you think something is wrong. But until the test has hit statistical significance, the results are not reliable.
Think of it like this: if I flip a coin 10 times and get tails 7 times, it doesn’t mean that the coin is bad. That’s a completely reasonable outcome.
If, on the other hand, I flip the coin 10,000 times, and get tails 7,000 times, then there is probably something unfair about that coin.
With a large enough sample size, the effect of random chance should dissipate. By waiting for the test to gather a large enough sample size to hit the significance level you entered, you can be confident that the results you observe are not a product of random chance.
Once enough traffic has passed through the test and it has reached statistical significance, you will usually be notified by the testing platform. You can end the test at this time.
Interpreting A/A Test Results
You will get to see the performance of both variants across the entire duration of the test, as well as with their observed conversion rates with confidence intervals.
The observed conversion rate tells you what happened during the test, and the confidence interval expresses the range that the true conversion rate is likely to fall within.
All that means is that, if you were to keep running the test, 95% of the time you would see a conversion rate that falls within this range (assuming you have statistical significance of 0.05).
If everything goes well, you should not see any meaningful difference in performance.
Here’s an example of some results you might get during a successful A/A test:
| Variant | Observed conversion rate | Confidence interval |
| A | 2.5 | 2.2% → 2.8% |
| A* | 2.7 | 2.4% → 3% |
In this example, the observed conversion rates are very close and the confidence intervals overlap. It’s not 100% identical, but it is very close.
With results like these, you can feel confident that your testing environment is functioning properly.
What if I do see a large difference between variants in an A/A test?
It could be a major red flag. It doesn’t automatically mean that your tool is broken, but it’s worth investigating.
Here’s what I would do:
- Confirm that you have hit a large enough sample size. If you haven’t, I would let the test keep running until you do.
- Verify that the traffic is being split evenly (50/50), and that there aren’t any segmentation issues. For example, was one page shown mostly returning users and one to mostly new users? That could cause a difference in outcomes that would not be caused by the tool. Look at different segments (traffic source, device type, country etc.) to ensure that your audience isn’t accidentally getting split into meaningfully different groups.
- Inspect tracking, reporting, and codes. Are there missing or faulty parameters that could skew the results? Are all of your integrations and APIs working properly?
If you find any bugs, fix those and rerun the test.
If you are confident there are no bugs, traffic is being split evenly, and you have not inadvertently created different audiences due to segmentation errors, then your A/B testing tool might not be working properly.
Reach out to the vendor and share results. They may be able to spot an implementation issue that you missed, and if there is a problem on their end, they should address it immediately.
Just bear in mind that 1 in 20 tests will still show a statistically significant difference, if you set the significance level at 5%. Such false positives are expected, even with a perfectly functioning tool. This is simply the nature of hypothesis testing.
Repeated failures, however, are a sign that you have a problem.Once you have completed a successful A/A test, you can begin running CRO testing with confidence that your tools are working.