Being data-driven is good.
Unless, of course, all that data driving your decisions is wrong.
Google Analytics does a lot of good. It might look fine and seem correct when Goals are firing properly. But just because it’s working, doesn’t mean it’s accurate.
Most analytics programs have to make a few implicit assumptions. They’re taking leaps of faith in some cases. And unless you know where to look, you could fall victim to these little white lies.
Here are seven of the most common (along with how to fix them).
Lie #1. Growing “Dark Traffic”
“Dark traffic” sounds ominous. And that’s because it is.
It’s hiding in plain sight. It looks and calls itself “Direct.” When, in reality, it’s everything else.
It’s a little email. A bunch of social. And, most likely, a whole lot of organic search.
The problem is that many analytics packages (including Google’s) have trouble properly attributing sources.
Classic example:
You finally put the finishing touches on that big email campaign. It’s lookin’ spiffy. The “branding” peeps in your office will undoubtedly gush over it.
Only one problem…
Outgoing promo links weren’t tagged properly. Which means when you hit the Send button and it goes out to that massive list, there’s gonna be issues.
Subscribers open up their desktop-based Outlook in the morning and the referral string “don’t pass Go” (or at least, doesn’t make it back properly).
What’s the end result?
A ton of Email or Referral traffic gets lumped under Direct. (Which means you, dear marketer, also aren’t getting the proper credit you deserve.)
But, wait, because it’s about to get a whole lot worse. The same exact problem is eroding your well-deserved organic search traffic, too.

Groupon confirmed this by voluntarily de-indexing themselves (yes, you read that correctly) in the name of SEO science.
The result? They discovered that up to 60% of their direct traffic should actually be classified as Organic Search.

Good news and bad news.
The first instance is easy to solve. Google provides an easy-to-use UTM builder to tag all of your links across email or social (two of the biggest problem areas). Make sure those babies are tagged before going live, and you’re mostly good to go.
The second instance, Direct eating away your Organic Search, ain’t so easy, unfortunately. There are two ways to think about it, though.
This “dark traffic” is going to affect your easy-to-remember URLs first — so the homepage, or perhaps one step deeper like your /services/ page. The Direct traffic here could go both ways. Some of it’s probably legit, but some of it won’t be and there’s not a whole lot you can do (currently) to change that.
Long, hard-to-remember URLs like “https://domain.com/search-engine-optimization-services-orange-county” probably aren’t seeing a ton of Direct traffic. Just think about it logically: No way people are typing that thing in every time to visit there. So that Direct traffic can probably be considered something else (organic search, social, email, etc.).
But the second way to think about it is to de-emphasize your focus and attention away from vanity metrics like “traffic” in the first place.
Here’s why that’s helpful.
Lie #2. Vanity Metric Emphasis
Traffic and pageviews are fine.
To glance at briefly, perhaps. Or quickly benchmark this month vs. the prior.
But that’s about it at the end of the day. Because they often don’t lead to anything concrete. And they can often be misunderstood for “doing well” when you’re not doing so well.
Here’s an example:
Take a look at your most popular content from search engines. Check out all those blog post visits and pageviews you’re getting!

You SEO savant, you. Only one problem…
Overlay the bounce rate and exit rates on those individual pieces of content to see how many people are sticking around. Not such a rosy picture now, unfortunately.

The VAST majority of people coming into this blog post turn around and go right back out the door. So who cares if there are 5,000+ monthly sessions on a single blog post if 4,300 of them leave immediately.
Instead, look at these vanity metrics holistically. If blog posts are a revolving door, the problem isn’t necessarily traffic but what’s happening when people are on your site.
That could lead to setting up events to better judge page interactions, having better Goals that lead to “hard” actions you track, or even looking elsewhere for help in analyzing user behavior (*ahem* Crazy Egg).
This all-too-common scenario is also a perfect example of what happens when you’re looking at raw numbers without any context of what’s really happening.
Lie #3. Little-to-No Context
So a high bounce rate is bad… right? Not exactly. It depends largely on the type of site.
Google Analytics provides a bunch of raw data. But not a lot of context. Instead, you have to go digging.
According to a RocketFuel study, most websites will see bounce rates between 26% and 70%.

In my own anecdotal experience, content-driven sites like blogs tend to be on the higher end (60-70%). This traffic is a little more fickle.
Whereas e-commerce and other commercial sites tend to be in the lower ranges. Visitors are there for something specific.
But here’s where things get murky.
Let’s say you have a commercial site and you’re worried about that higher-than-average site-wide bounce rate. Digging deeper, you notice that a few landing pages have extremely high bounce rates that might be artificially driving up that site-wide number.
Is that a bad sign? Landing pages with high bounce rates?
No, not really. It means they’re doing their job.
You don’t want people spending five+ minutes consuming your landing page (unless it’s a super duper long-form one). You want them doing one thing and one thing only: converting.
If that pushes up a misleading “bounce rate” number, who cares?!
Well, the HiPPOs do. And that’s the problem.
Or what if that high bounce rate is because of something completely different? Something you haven’t even thought of?
Kinsta’s page speed guide says nearly three-quarters of your site traffic will bounce if a page fails to load within five seconds.

If you’ve got a slow hosting provider, your website will be slow. Period, end of story. Doesn’t matter how clean your code is, how many images you compress, or what CDN you use.
True to form, the earlier page example from the last section is almost 200% slower than the site average:
![]()
So here we thought it was one thing. And it turns out it might be something else entirely.
Combine vanity metrics with a lack of context and you’ll be in the proverbial dog house for no reason, attempting to ‘splain away what’s happening and why it’s happening to someone who doesn’t know or care enough to listen. (#realtalk)
The fix? Be super careful about how you report numbers (especially vanity ones). And instead:
- Create a full-funnel dashboard like Rand’s that takes into account the stuff happening before and after.
- Always compare against prior periods and prior years to see how trends are changing over time.
Lie #4. Last Touch Bias
Paid search drives the most conversions. Twitter barely any. That’s the common theme anyway.
Instead, what’s happening is that you’re only looking at the very “last touch” (by default). And neglecting everything else leading up to that point. Including the other channels and tactics that commonly “assist” conversions.
Evidence of this first popped up years ago when Forrester Research analyzed over 77,000 e-commerce purchases. Their goal was to identify which channels buyers were coming from.
Search (both paid and organic) ranked supreme in driving purchases from new customers. While email was the winner for repeat ones.
How about social?
And I quote, “Social tactics are meaningless sales drivers.” Accounting for less than 1% of sales studied. So that’s it. Right? ‘Nuff said. No need to dig deep for new marketing ideas.
But… on the other hand, kid’s clothing designer SpearmintLOVE just grew revenue 991% year over year predominately through Facebook advertising.
Why the discrepancy?
Google’s Customer Journey to Online Purchase can help us figure this out once and for all. Select your industry, location, and size. Then they’ll give you a visual illustration of which channels “assist” conversions and which ones drive them last.

On the far left, Social and Display ads introduce people to new products. In the middle, the people start evaluating different options through search engines. Before going directly to the website to purchase at the end.
The trick is to switch from the default of only tracking the “last touch” to a multi-step process instead. Google Analytics comes stocked with a few you can try depending on your business model or customer’s purchasing behavior, including:
- Last Non-Direct Click: Ignores Direct clicks and picks up the channel they used previously.
- First Interaction: Exactly like it sounds — picking up the Social or Display advert that first generated their site visit.
- Linear: Attribution is shared equally across every channel that individual used prior to purchase (so four channels = 25% each).
- Time Decay: The channels someone used right before converting will get more credit than those used days, weeks, or months before.
- Position: First and last “touch” channels get the bulk of the credit, with a tiny bit assigned out to the ones in between.
Lie #5. No Offline Conversion Tracking
What’s the average website conversion rate? A percent or two maybe?
Now compare that to phone calls which convert somewhere between 30-50%.
That’s great, right? Want more conversions, just polish up that phone number. What could possibly be the problem then?
The problem is that the lion’s share of phone calls are being driven by digital efforts (up to 70% according to Invoca). And, once again, none of that information shows up in Google Analytics out of the box.
So here’s what happens:
You work hard on new campaigns that are generating results. Yet, drawing a simple, straight line between your efforts and the ringing phone is next to impossible. Instead, bosses and clients merely believe it’s their “good word of mouth” or some other inane reason.
It’s true. You can technically track AdWords phone calls on your site extension. But what’s more likely is that someone bypasses the phone number on an ad, and instead clicks through to your website in order to browse around for a little while.
Then, and only then, do they pick up the phone and give you a ring.
While not completely foolproof, the easiest solution is to set up event tracking for when people click a phone number on your site. (Grasshopper has an excellent resource that walks you through this process.)
Basically, you’re just tracking each time a click-to-call link would be used. So, for example, you might add this to your website’s header:
<a href=”tel:+18001234567″>800-123-4567</a>
And then when someone’s on their mobile device, they can hold the phone number down to automatically call it…

In which case, your event tracking should automatically pick it up ASAP.

Source
Lie #6. Misleading A/B Test Confirmation Bias
A/B tests fail more often than they succeed.
Which isn’t a good statistic to start with. However, the ones you need to worry about are the ones which do, on the face of it, “succeed.”
Google Analytics content experiments isn’t a strict A/B test. Instead, it allows you to compare different page variations to see which “bigger” changes result in improvements. (So it’s technically called an A/B/N model instead.)
The danger sets in when you take this too far.
For example, wanna test form field conversions? Simply remove a few fields and you might be able to quickly increase conversions by 11%. Not bad for a few minutes of work.
The same thing happens when you remove the requirement to provide a credit card when signing up for a free trial. Initially, things look great with a higher-than-average conversion rate.
But dig a little deeper into the funnel and you’ll quickly discover a problem. One study showed that only about 15% of non-credit-card-providing visitors convert to paying customers, while 50% of those who do provide a credit card convert.

Another separate study shows how a higher landing page conversion rate typically results in lower lead quality.

Once again, don’t neglect context. Testing landing page variations is fine and dandy.
If — and that’s a big IF — you’re also looking at how those changes are affecting your revenue-generating numbers deeper in the funnel.
Skip the overly general Goals Overview in Analytics in favor of the Funnel Visualization report so you can see how changes affect your bottom line.

Lie #7. Conversions Aren’t Always Paying Customers
Paid campaign A drives ten leads.
Paid campaign B only five.
We all know what happens next. Bosses and clients LOVE the first one. The one that drove the most conversions. So it gets the attention, adoration, and resource allocation.
But… once again, these numbers are a little bit misleading. Because leads aren’t paying customers.
So instead of tracking “macro” conversions like purchases, everyone’s basing their decisions off “micro” conversions instead.
Here’s how this scenario goes off the rails:
- The second campaign has a higher lead-to-customer close rate. So at the end of the day, you might have two paying customers from the second campaign vs. only one from the first.
- Or the second campaign could have a higher average sale value or LTV. So if both generate a single, paying customer, the second’s $1000 LTV is better than the first’s $500.
The point is that Goals — while great — don’t show you everything. We just saw that in the last section. So when it comes time to compare ad spend… you can’t. At least, not accurately.
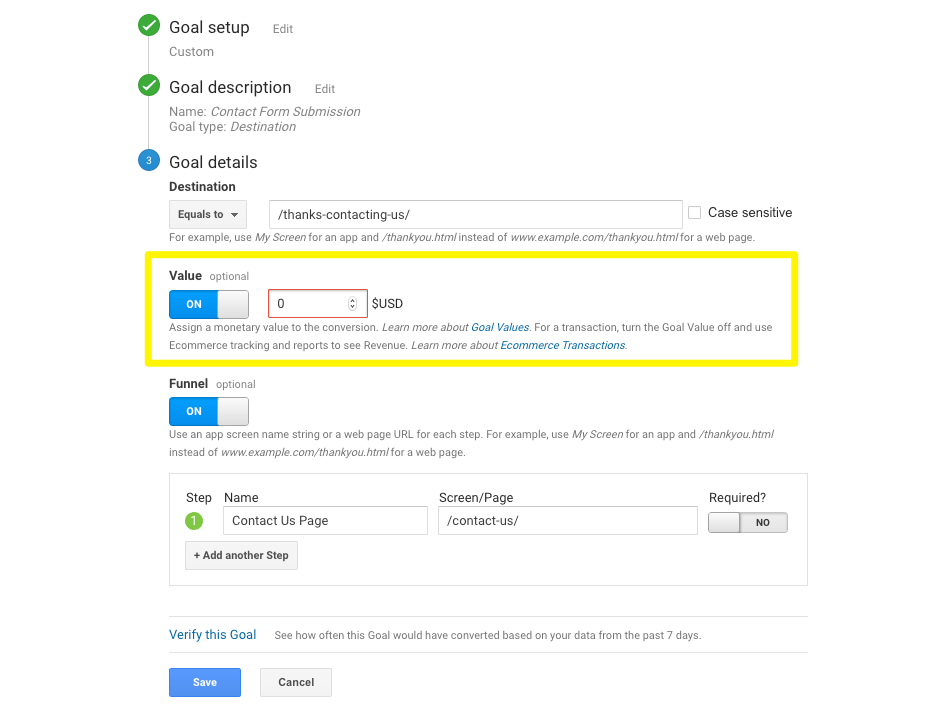
Whenever possible, add a monetary value to conversions so that you’re comparing apples to apples.
For example, if an average client’s LTV is $1,000, and your historical close rate is 25%, you can safely assume that each new lead is worth around ~$250.
Would that pass for a forensic accountant? No. But it’s a start.
Don’t have a historical conversion rate or even customer average value numbers to use? Compare it to what your alternatives might be. For example, fire up a paid advertising campaign and see how much it costs you to generate a lead. Then simply use that basic cost per lead number as your estimate in the meantime.
It’s far from perfect. But it does get you one step closer to forcing Google Analytics to tell the truth.
Conclusion
Google Analytics is great. It’s an amazing, free tool that gives you all kinds of valuable data.
However, it also has a few pitfalls. There are even a few cases where Google Analytics outright lies. And if you fall for those lies, your results will suffer.
The trick is to know where the metaphorical bodies are buried and react accordingly. Some metrics you can take at face value, while others require a bit of extra digging.
It takes some work. It’s not enjoyable. But it’s also the only way to give your campaigns a fighting chance so that your clients or bosses ultimately give you the credit you deserve.
Feature image by Thomas Guest.
About the Author: Brad Smith is a marketing writer, agency partner, and creator of Copy Weekly, a free weekly copywriting newsletter for marketers & founders.