Know your audience. It’s one of the key rules of getting better conversions. These days, knowing your audience isn’t simply about overall web traffic analytics; it means understanding your mobile and social audience too. Here’s why.
How Big is the Mobile and Social Audience?
In the US alone, according to Pew Research Center:
- Two-thirds of Americans own a smartphone
- 15% of Americans own smartphones and have limited other options for getting online.
- 10% of Americans own smartphones with no other way to get online.
Worldwide, the number of smartphones is forecast to reach 2.06 billion by the end of 2016.
There’s more. Another study by Pew Research Center shows that 40% of cell phone owners use social media on their phones, with 28% doing so daily. Social media users are active, sharing zettabytes of data every minute of every day. In fact, the majority of Facebook’s billion-plus users use the site only on mobile devices.
In other words, you can’t ignore these audiences when undertaking your conversion optimization strategy. Gathering data on what’s happening now is an important part of this. Google Analytics has always been a great tool to gain audience insight, and that includes your mobile and social audience. Here’s how you get started.
Setting Up Viewing Segments in Google Analytics
When you login to Google Analytics, the first step to finding out what’s happening with mobile traffic is to add a new segment to the dashboard view.

You can choose from the options available in the dropdown list. In the screenshot below we are comparing all traffic with mobile and tablet traffic.

You can also choose to add a third segment and view mobile and tablet traffic separately, as in the screenshot below.
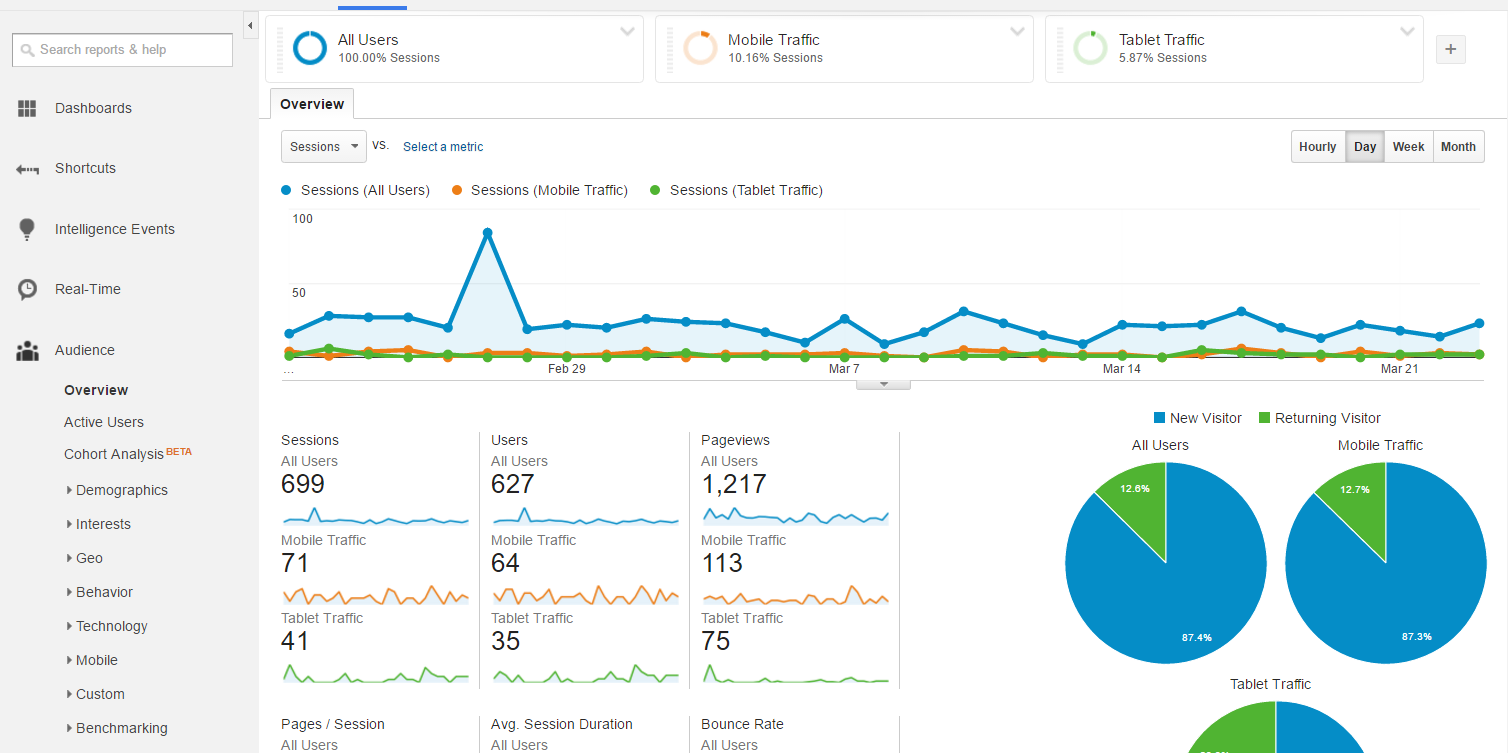
Examining the Audience with Google Analytics
Once you have added those segments, you will see segmented data for all the Google Analytics reports and can note and analyze how and why behavior differs. For example, this overview shows that tablet traffic bounces less and spends longer looking at traffic than either of the other types, and are more likely to return than the other two segments. Keep your eyes peeled for similar insights on your web traffic.

This broad overview helps you gain an initial understanding of users’ behavior so you can form the hypotheses to help your conversion optimization strategy. Then you can start to dig deeper, mining the different reports for more audience insight.
For example, you can learn:
- What percentage of your audience do mobile device users represent?
- What age and gender are users of the different types of devices?

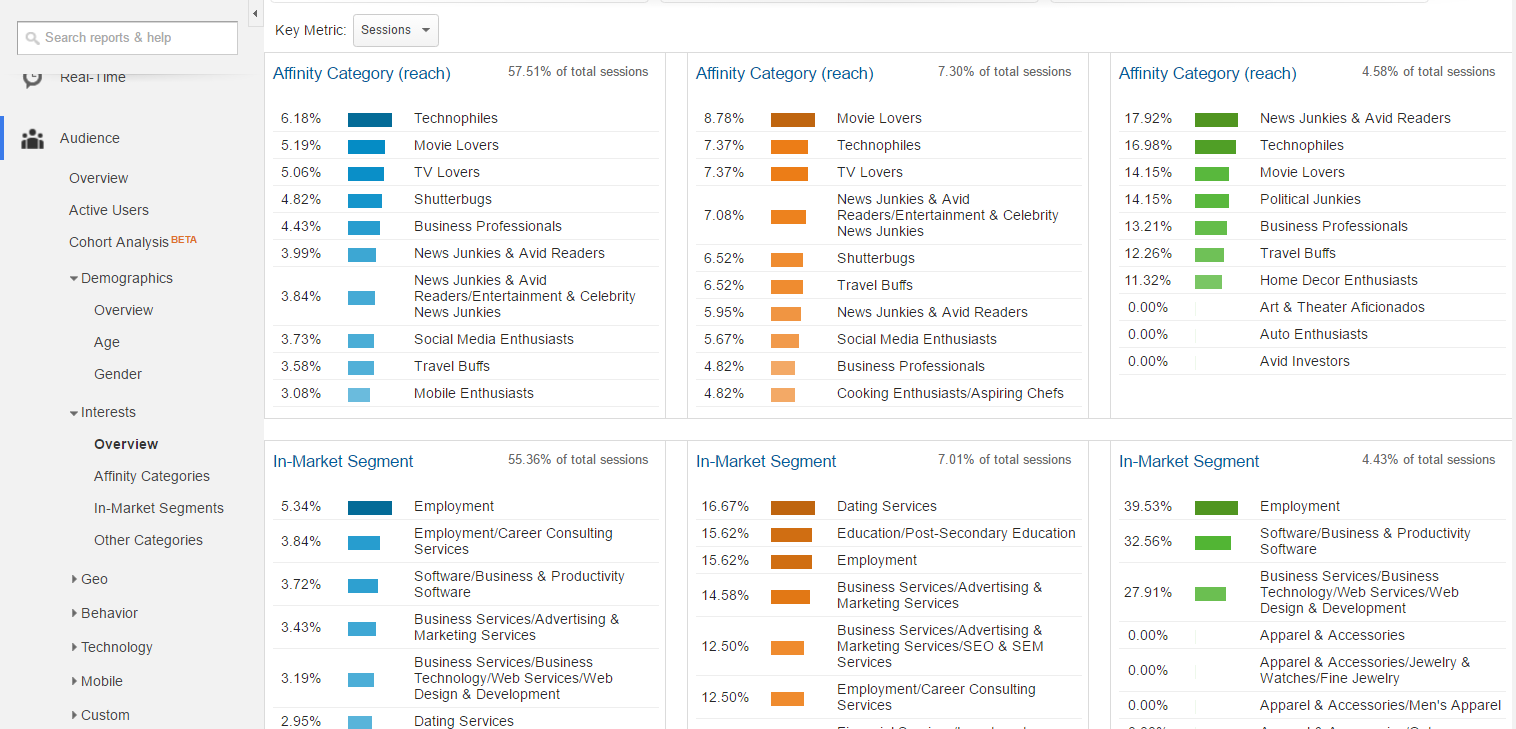
- Is there a difference between the interests and market segments of different device users?
- Does device usage shift depending on where your audience comes from?

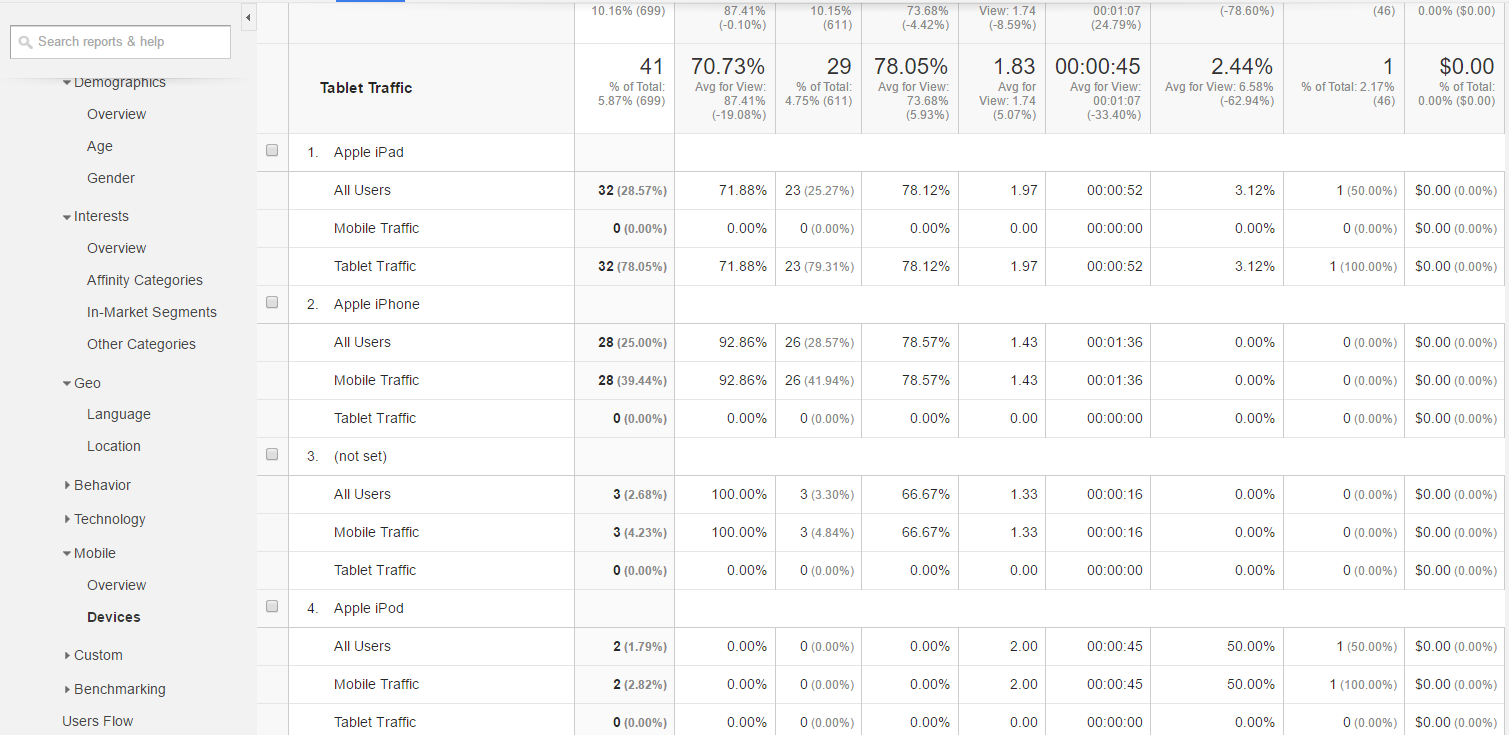
You can even drill down into which browsers people are using and get details on which mobile devices they use to visit your site. This can help with campaign targeting.
Google Analytics – Acquisition and Behavior
To learn even more, keep the segments in place and move through the rest of the Google Analytics reports. For example, you can see whether there is a difference in referral sources for the different types of devices and think about what that means for your strategy.

If you have linked your AdWords account, you can also see how your ads perform for the different devices, and you can also check the performance of your campaigns.
For example, in the screenshot below, mobile and tablet users spend more time on the site than the overall average across all devices and the bounce rate for tablet users is lower. This would be an opportunity to dig deeper into the data and form some hypotheses about the reasons.

Social data is also part of this report, but we’ll get back to that in a while.
The behavior report will let you see whether the type of device changes how audiences interact with your site and content, which again has major implications for your conversion optimization strategy.
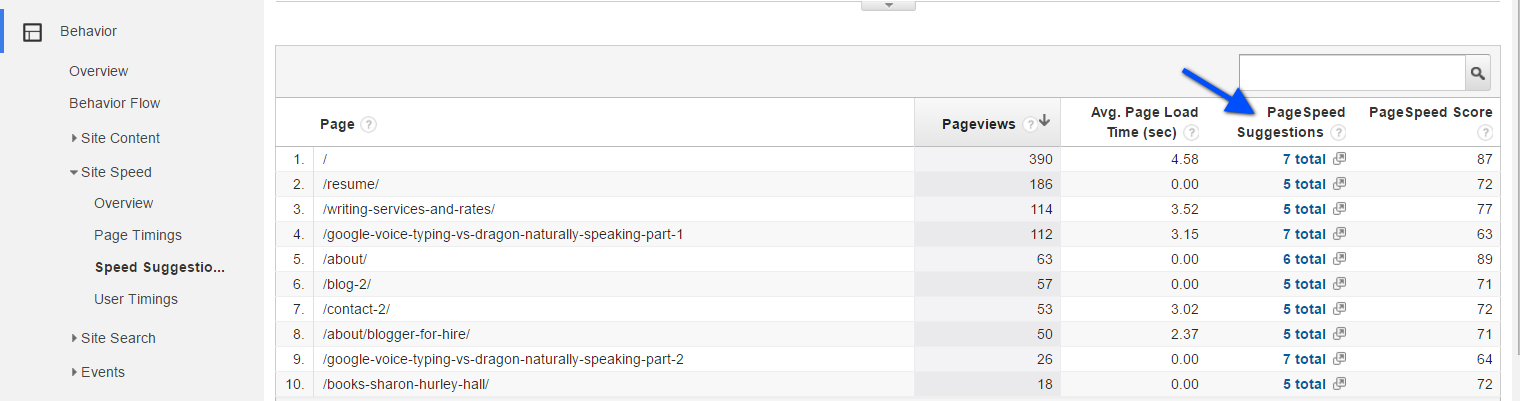
Since page speed has such a huge impact on conversions, it’s useful to navigate to this part of the analytics dashboard and see if there are any problem pages in terms of load times. In the screenshot below, there are clearly some issues, though not for mobile device users.

Google Analytics also provides suggestions for improving load times for the most problematic pages. Clicking on the link takes you to the Page Speed Insights tool which does a full analysis and gives detailed recommendations.
Exploring Social Traffic with Google Analytics
Let’s go back to Acquisition – Social. This is where you get more detail on traffic from this referral source. The overview shows you what percentage of your traffic comes via social referral, and you can also see which social networks work best for you.
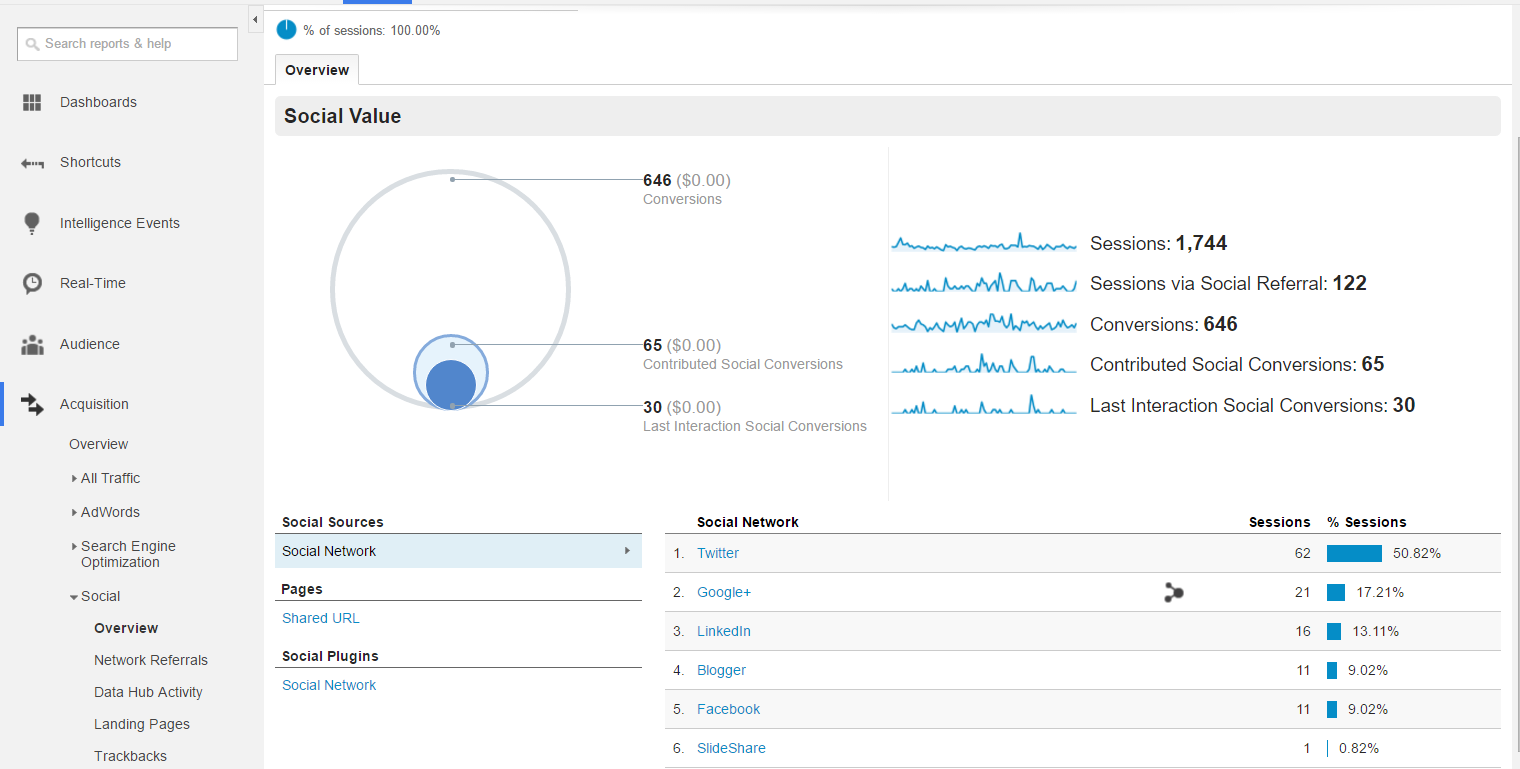
Moving down, the Network Referrals report gives you more information on each network. Click on the network name to see which URLs on your site have been shared by users of particular devices.

The Data Hub report lets you see the actions users took for the sites that form part of Google’s Data Hub network. You can also explore landing pages, trackbacks, social plugin use and social conversions.
It’s worth clicking on the Social Users Flow report to see a visual representation of how people arriving via social media interact with your site. If you want to see the mobile and tablet segments, just click on the appropriate sections at the top of the dashboard.

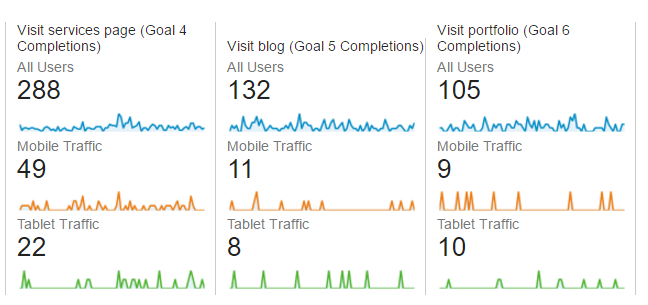
Looking at Conversions
If you’re involved in conversion optimization, then you will have goals (or e-commerce goals) set up in Google Analytics. You can look at these with the mobile filters applied too. In the example below, the site owner has three goal URLs set up and is able to see how many mobile and tablet users complete goals, relative to the overall number of goal completions.
You can also look at the reports to see funnel visualization (if you have set up your funnel), as well as goal flow. Further down, you can learn more about conversion paths for multi-channel funnels, giving you fine detail on how people are finding your site and converting.

If you want to get even more from Google Analytics, use secondary dimensions with your reports.
Get More Insight with Custom Google Analytics Dashboards
If you want to extract more information from Google Analytics, and make it easier to understand, then think about creating your own custom Google Analytics dashboard to give you a different view. Or, if you can’t be bothered, check out the dashboards created by top Analytics users. We’ve shared some of those in the past, but here are some new ones worth noting:
- Avinash Kaushik’s social media performance analysis (import it here)
- Buffer’s social media dashboard (add the mobile and tablet segment for additional analysis)
- This mobile conversions dashboard.
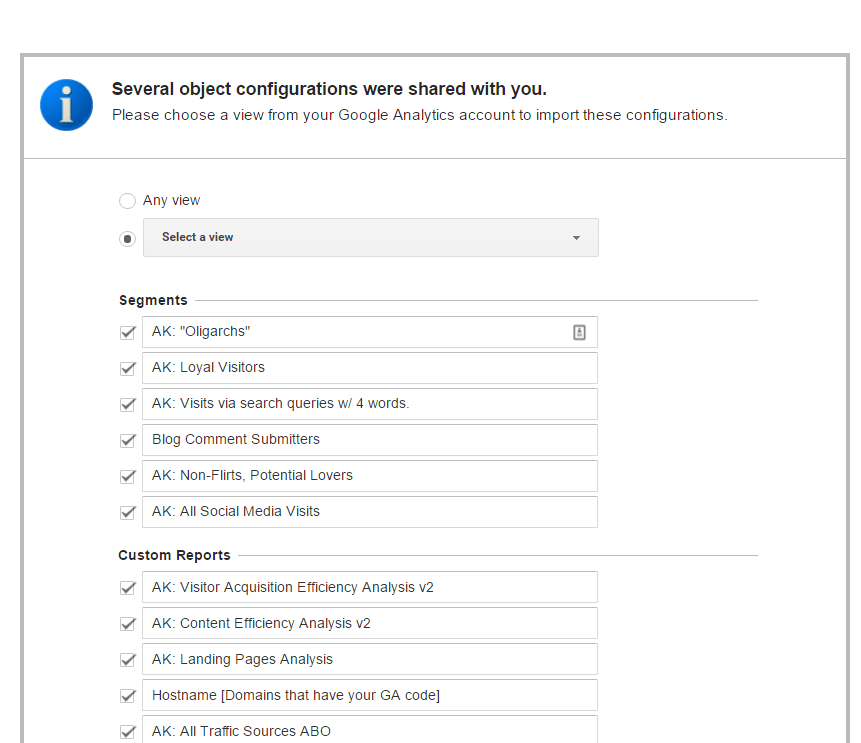
There are also tens of thousands of custom analytics dashboards in the Analytics Solutions Gallery, including some useful bundles by analytics experts. To use them in your own account, click on the name of the dashboard that interests you, then press the import button in the top left of the screen.

Choose the view or site you want to apply it to.
Visit your analytics page and check out the data-driven awesomeness!

If you import a bundle and there’s a report you don’t need (as happened to me), then follow these instructions to delete it.
Conclusion
Google Analytics provides an easy way to understand your social and mobile web traffic, and the addition of custom dashboards makes it an even richer tool. Try some of the tips in this article and see what you can learn to improve conversions from your customers.
Got a favorite Google Analytics dashboard of your own? I’m always on the lookout for new ones to try, so please share.
Read other Crazy Egg posts by Sharon Hurley Hall.