Both Amplitude and Google Analytics can help your team figure out exactly how people interact with your website and digital products.
But Amplitude focuses heavily on product analytics. Google Analytics—especially when accessed through Crazy Egg—is designed to help teams understand website traffic and visitor behavior.
We’ll explore how the two tools compare so you can choose the one that best supports your analytics needs.
Amplitude vs. Google Analytics on Crazy Egg: A Quick Snapshot
No time to read the whole piece right now? This quick overview gives you a starting point for comparing these two tools.
| Feature | Amplitude | Google Analytics via Crazy Egg |
|---|---|---|
| User Behavior Tracking | ✅ Event-based tracking for product-centered actions, like clicks on specific features and onboarding steps, plus action surrounding product upgrades | ✅ Tracks traffic, engagement, and visitor activity using GA4 data inside Crazy Egg’s easy-to-use dashboards |
| Data Structure & Management | ✅ Event taxonomy conveniently organizes events, properties, and user attributes across your product | ✅ Imports and organizes GA data into visually appealing dashboards with 1 year of historical data |
| Quantitative & Qualitative Insights | ⚠️ Strong quantitative analytics, along with targeted user surveys | ✅ Combines GA traffic analytics with complete quantitative and qualitative insights from heatmaps, recordings, funnels, surveys, and A/B testing |
| Segmentation & User Cohorts | ✅ Sophisticated behavioral cohorts based on event sequences and product usage patterns | ⚠️Simpler segmentation via traffic by source, campaign, device, location, and landing pages |
| AI-Assisted Analytics | ✅ Multiple different AI agents to analyze charts, funnels, and session replays | ✅ AI summaries explain traffic trends and suggest the next steps for ideal optimization |
Now it’s time to grab a cup of coffee, get your thinking cap on, and explore our detailed comparison of Amplitude and Google Analytics, as accessed via Crazy Egg.
Feature Breakdown: Amplitude vs. Google Analytics
1. User Behavior Tracking
Amplitude
Amplitude was built to help product teams understand how their users interact with digital products. While it does so on both apps and websites, it’s especially fine-tuned for use with a mobile app or SaaS tool.
Instead of focusing on pageviews, á la Google Analytics, Amplitude tracks individual user actions, or events.
Events can include:
- Creating a user account
- Clicking on a particular feature
- Completing onboarding for a new tool, feature, or update
- Upgrading from a free version to a paid plan
- Plus, just about anything you want to define as an event
Because each of these actions is recorded individually, your team can reconstruct entire journeys within your product.
This is why product managers and teams often depend on Amplitude or product-focused tools like it. They can use Amplitude to closely study who sticks around and who uses which features on an app or SaaS product.
That said, Amplitude works best when your team first clearly defines the events and properties you want to analyze. Because this configuration must be done before analysis can begin, it can be a drawback for teams that want to get up and running more quickly.
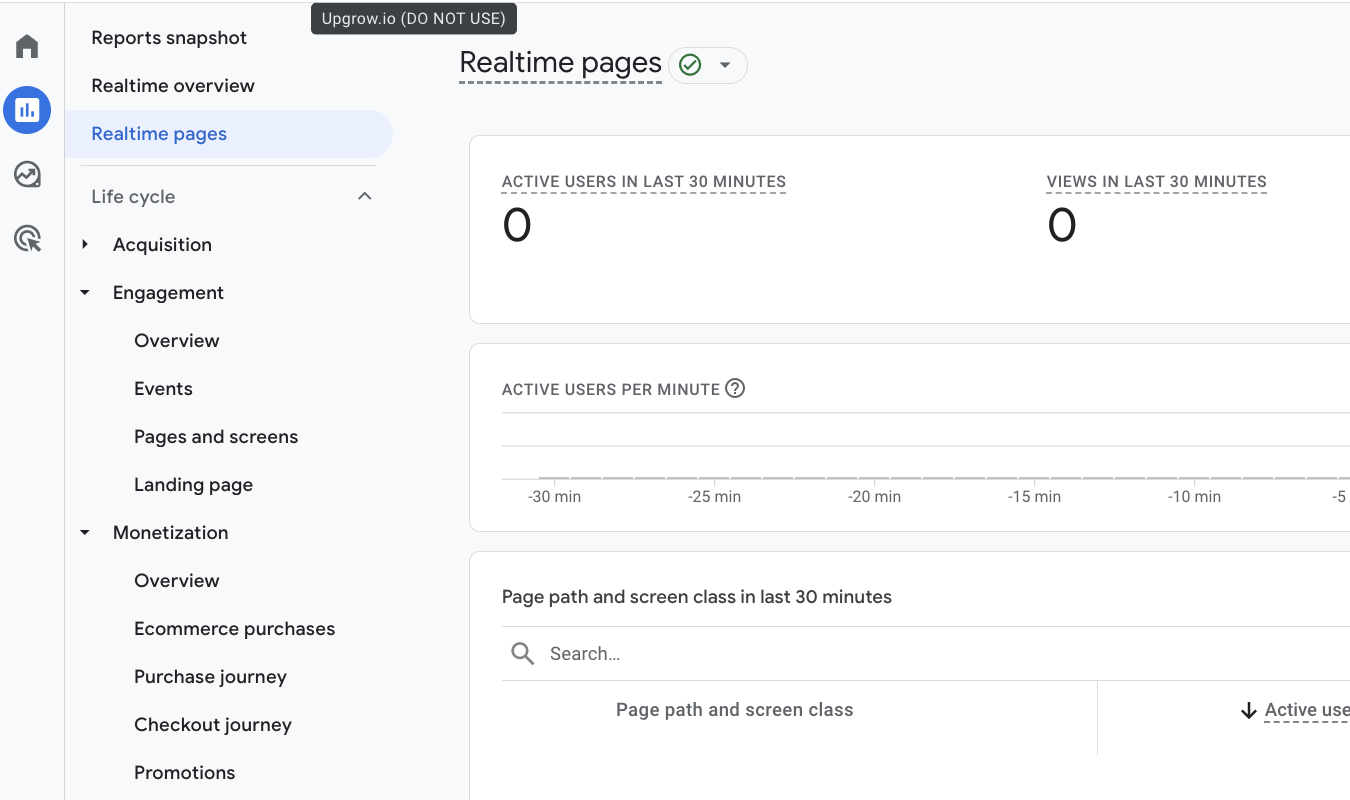
Google Analytics via Crazy Egg
When you connect Google Analytics 4 to Crazy Egg, your existing GA traffic data shows up within Crazy Egg’s Web Analytics dashboard. This makes the data much easier to interpret and explore, because Crazy Egg’s dashboards are more user-friendly than GA4’s.
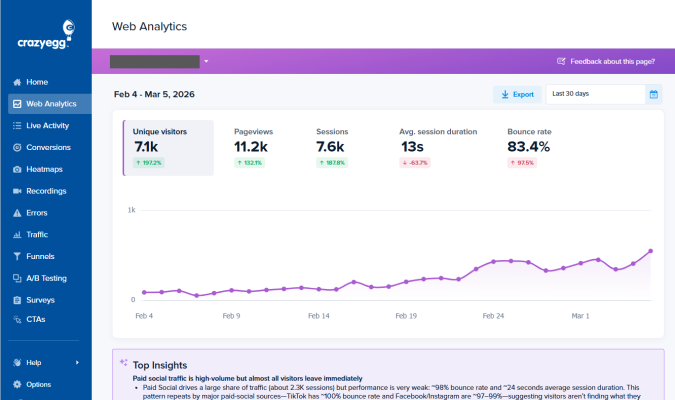
I mean, look at the difference between Google Analytics…
…and Crazy Egg.
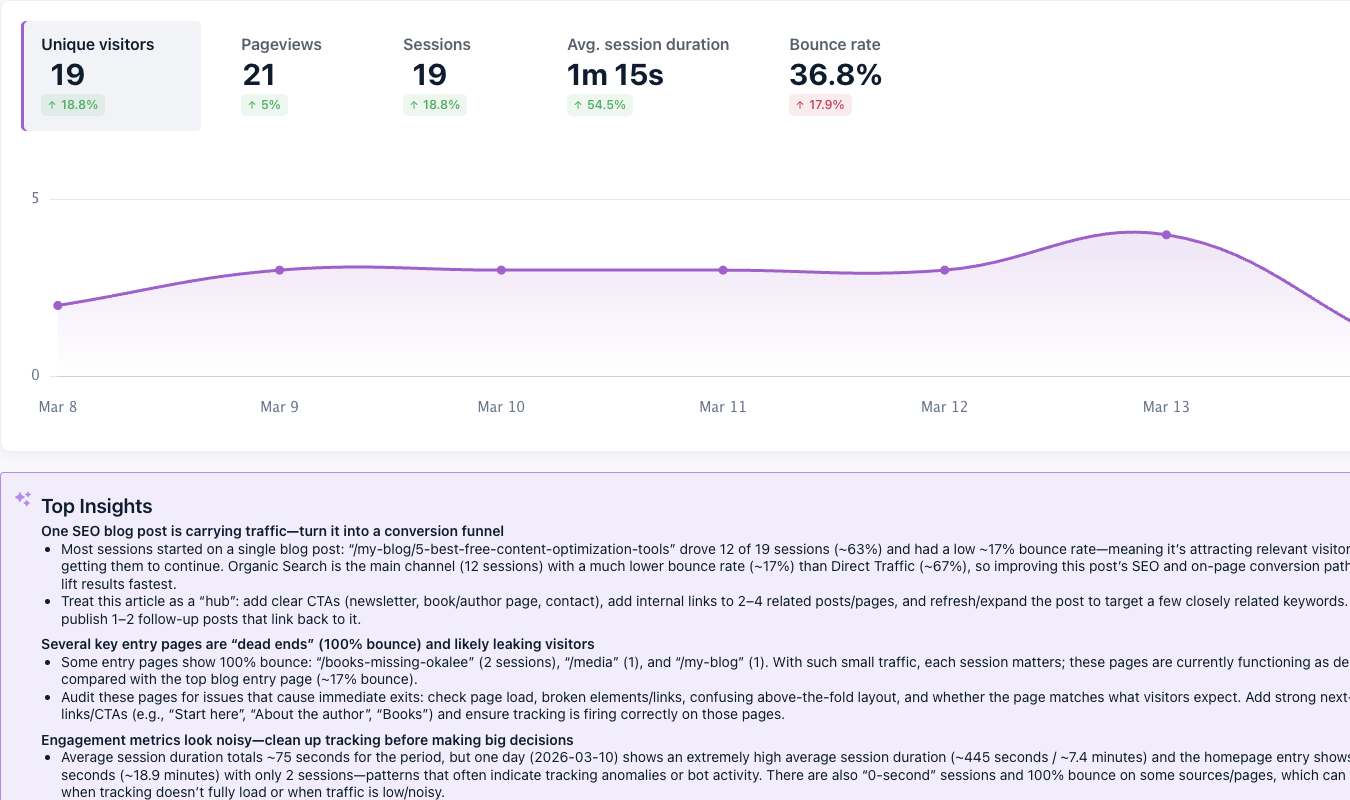
Which one would you rather depend on for quick and easy insights?
Instead of spending hours navigating the bland yet somehow complicated GA4 interface, your team can quickly interpret the data and put the insights to work.
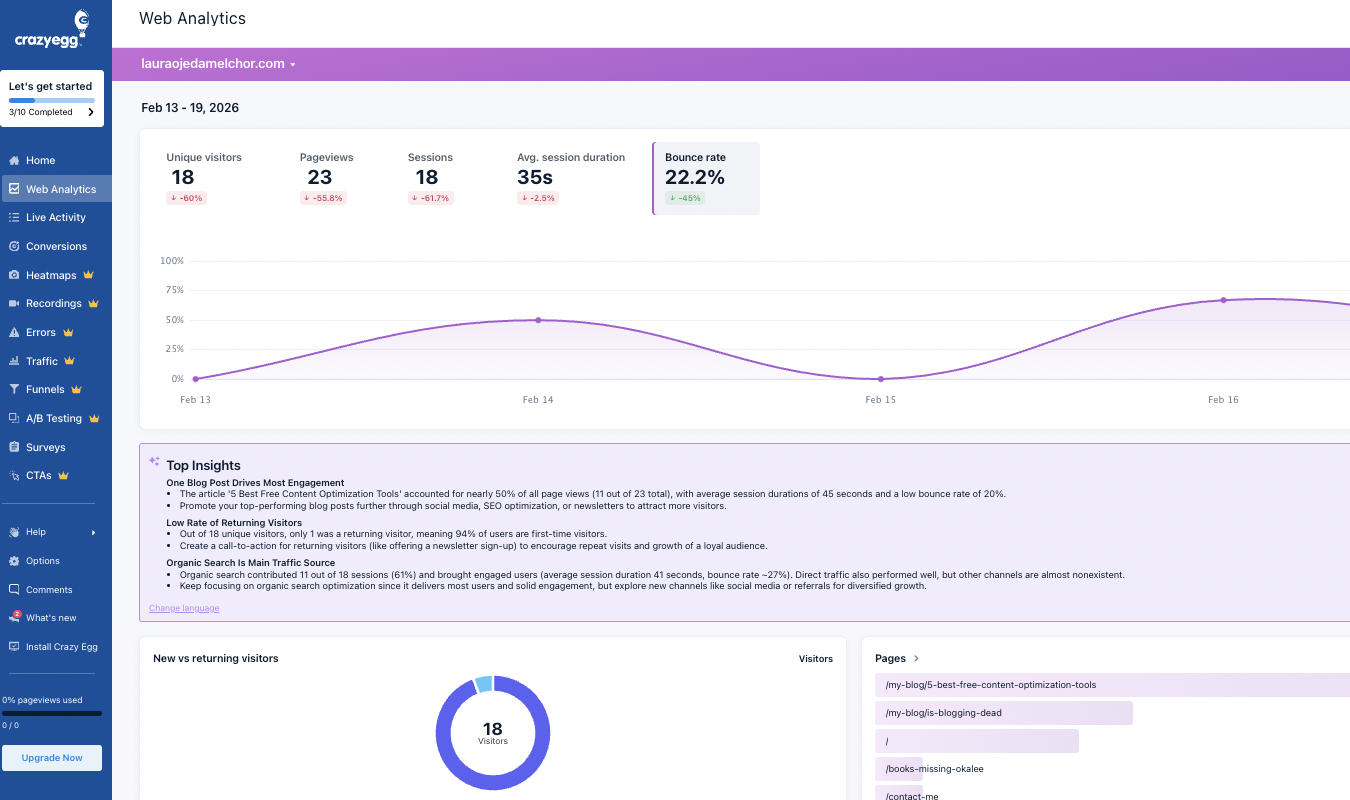
Once Crazy Egg is connected to Google Analytics 4, Crazy Egg automatically organizes the GA4 data into reports that are easy to read. You can monitor core website performance metrics like visitor activity, traffic trends, and engagement, all without needing to configure custom reports on Google Analytics.
Even better, you can play with that traffic data using Crazy Egg’s behavior tools, which include:
- Heatmaps
- Session recordings
- Conversion analytics and funnels
- A/B tests
- Surveys
- Errors tracking
This pairing between Google Analytics and Crazy Egg helps teams connect quantitative traffic data with actual user behavior. This makes it easier to understand not just how many visitors arrive, but what they actually do once they land on a page.
And, thanks to surveys and A/B tests, you also get to learn what they think about various features on your site.
But keep in mind that while Google Analytics technically can track both websites and apps, when used with Crazy Egg, it’s most powerful for use on websites.
Together, the two excel at analyzing traffic sources and page engagement more than detailed product usage, which is Amplitude’s strength.
2. Data Structure and Management
Amplitude
Amplitude includes a few key data governance and management tools designed to help your team keep your analytics data organized and reliable. One of my favorite Amplitude tools with this focus is its data taxonomy system.
Amplitude’s data taxonomy capability isn’t an explicit tool.
Instead, the taxonomy structure is baked into the Amplitude platform.
As I mentioned earlier, every user action is recorded and categorized as an event. Each event can then include event and user properties, which add context.
Together, these elements form that structured taxonomy that keeps analytics data organized and consistent across your product.
To help teams maintain the taxonomy over time, Amplitude also includes data governance tools, including:
- Tracking plans: A shared blueprint that defines which events and properties should be tracked. This helps teams standardize data collection and naming systems across an app or SaaS product.
- Schema validation: Automated checks that flag or block events that don’t match the expected structure—like properties that are missing, or data that’s not formatted the right way.
- Event management tools: Controls that let teams organize events, add descriptions, and hide outdated events so that you don’t accidentally use stale data in your reports.
Together, these tools work together to make keeping your data organized easy—well, as easy as data management can be, anyway.
Google Analytics via Crazy Egg
When you connect Google Analytics to Crazy Egg, your GA data gets pulled into Crazy Egg’s dashboards so you can analyze it there instead of using the (famously dense) GA interface.
This includes key traffic metrics and segmented reports, allowing teams to explore their Google Analytics data straight from within Crazy Egg’s much tidier dashboards rather than switching back and forth between platforms.
Once everything’s connected, here’s what you get, data management and governance-wise:
- Up to one year of historical Google Analytics data, imported automatically to Crazy Egg
- New analytics data is regularly synced so your reports stay up to date
- Data is displayed in dashboards that are visually simple but still rich in data
- Built-in segmentation tools that let you break down traffic data by dimensions like device type, traffic source, and campaign
- Segmented datasets you can export and download for deeper analysis on other tools
In short, the Crazy Egg integration allows teams to keep the Google Analytics data they already rely on while exploring it through an interface that’s (much) cleaner and easier to navigate.
3. Quantitative and Qualitative User Insights
Amplitude
Amplitude is best known for its quantitative product analytics, which track user behavior through events like clicks, feature usage, and onboarding actions.
But Amplitude also includes a capability for gathering qualitative feedback through its Guides and Surveys toolkit.
For example, you can use Amplitude Surveys to trigger a user-facing questionnaire when:
- A user completes an onboarding session
- Someone cancels a subscription
- A person abandons a workflow
If you’re lucky and the user answers the questionnaire, you can gather feedback on why they are or aren’t satisfied at that moment in their user journey. (Shorter and simpler surveys are the way to go if you want those responses, by the way!)
You can target these surveys to specific cohorts based on properties like behavioral trends, location, or device type.
The answers can give you insights into questions about why users stopped using a feature, what confused them during onboarding, or what improvements they’re hoping you’ll develop next.
Google Analytics via Crazy Egg
When you connect Google Analytics and Crazy Egg, you get the best of both worlds as it pertains to quantitative and qualitative data.
Google Analytics brings its strong quantitative traffic analytics, including metrics like:
- Traffic sources
- Page-level engagement
- Conversion performance
- Results from ad campaigns
Crazy Egg then adds excellent qualitative context via its behavior analysis tools, including:
- Five different heatmap types to show you where visitors click and scroll
- Session recordings that replay actual user visits, plus AI analysis so you don’t have to watch every single one
- Conversion funnels that highlight where visitors leave your site
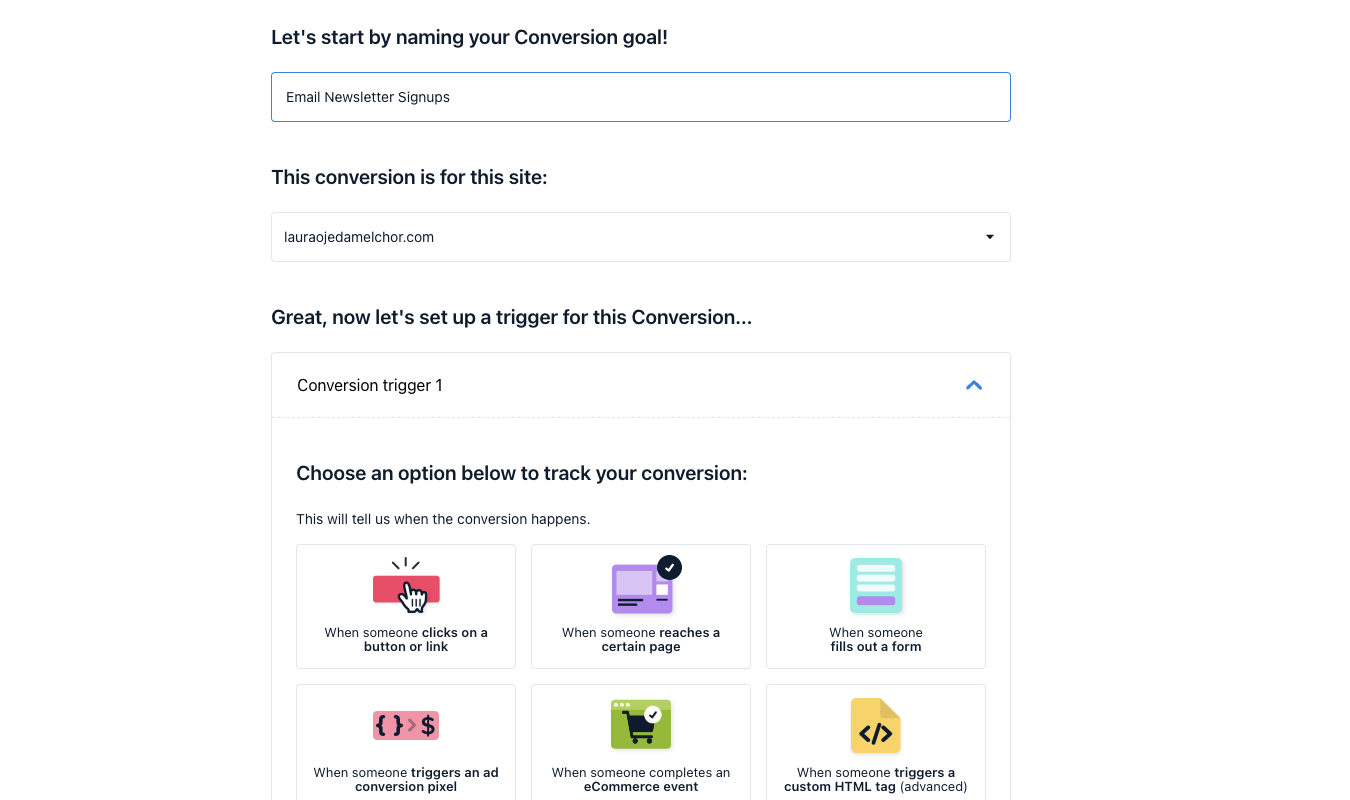
- On-site surveys that empower you to gather feedback from users as they browse your site or use your SaaS product
- A/B tests that allow you to iterate and test every update, from minor changes to copy and major overhauls
Link Crazy Egg’s qualitative tools with GA4’s quantitative data together in one platform, and your website will be unstoppable.
4. Segmentation and User Cohorts
Amplitude
Amplitude gives teams a deeply granular way to segment users for further study. This is because its cohorting features are built on top of Amplitude’s event-based data gathering model.
So yes, you can create cohorts based on user attributes and actions, as I’ve mentioned already. But more importantly, you can define these groups based on how users behave over time and in a specific sequence.
Here’s what I mean. In Amplitude, you can isolate users who:
- Use a specific feature within their first three sessions
- Reach one particular step in onboarding, but never advance to the next one
- Return to the product after a lapse due to trying a newly launched tool
- Trigger one event over and over, but don’t move on to a further action
- Complete a key workflow consistently on a mobile device but never (or rarely) on desktop
This level of specificity in grouping and tracking segments and matters a lot in our data-heavy world. Ten years ago, it was fine to just have broad groups of users to study. But as tech has become more sophisticated, so too has our need to keep up with that level of sophistication.
Amplitude also lets you use cohorts inside other reports you generate. Instead of creating a user segment and just letting it sit there to refer to later, you can immediately analyze how that group performs using funnels, retention charts, journey reports, and feature adoption reports.
Google Analytics
You can segment users using your Google Analytics data inside Crazy Egg, but the focus is a bit different. This honestly makes sense, seeing how Crazy Egg and GA4 excel at website behavior tracking more than mobile app analytics.
For Crazy Egg and GA4, segmentation is focused on helping teams understand which groups behave differently on your site, not on how users move through a highly specific product experience.
Once your GA4 data is pulled into Crazy Egg, you can break the performance down by the following dimensions:
- Traffic source
- Campaign
- Device category
- Geographic region
- Landing page
This helps you answer questions about which traffic sources actually bring visitors to your website and helps you decide whether your campaigns are driving visits to your best-performing pages.
And because this data is dynamically held within Crazy Egg, you can pair your segmented traffic views with CE’s visual behavior tools.
Instead of stopping at the insight that your paid social traffic bounces more than organic web traffic, for instance, you can dig into heatmaps, recordings, and funnels to get to the why.
5. AI-Assisted Analytics
Amplitude
Amplitude’s AI tools go far beyond summarizing a dashboard—although that’s important too, of course. But Amplitude offers that, and then some.
Its newer AI features are crafted to help teams ask questions in plain language, get an automatic analysis, and then investigate user behavior across the entire wealth of data gathered and stored with Amplitude.
One of these tools, Ask Amplitude, lets you create or edit charts using natural-language charts. You can also search for specific dashboards and just use Ask Amplitude as a vehicle for navigating the Amplitude interface.
This is hugely beneficial for teams that don’t have the time and expertise to analyze each data point manually.
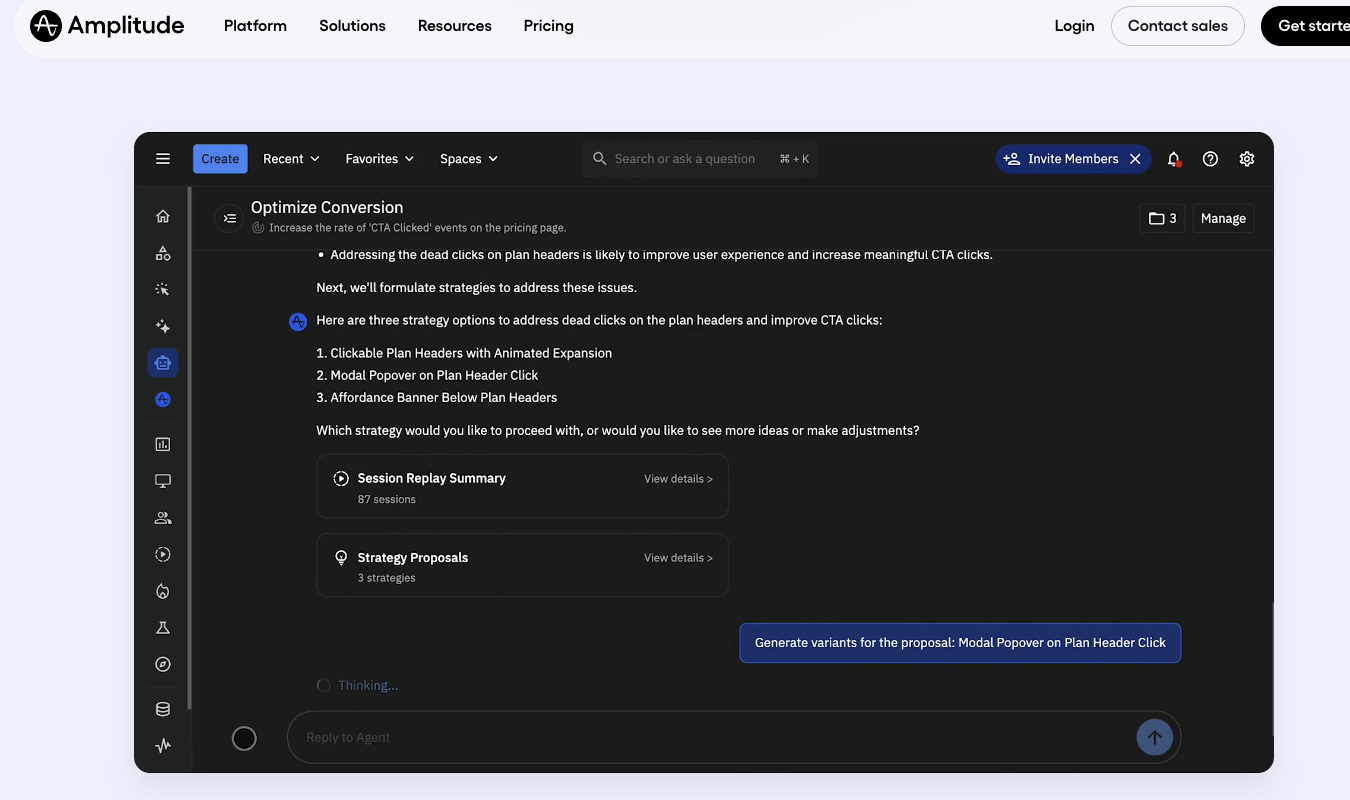
Amplitude’s newer Global Agent AI tool gives you more leverage. It offers page-level context to help you understand the chart or report you’re viewing.
From there, you can ask the Global Agent to generate quick summaries or deeper analysis rooted in that specific context. For example, say you’re looking at a funnel that shows where users drop off during the onboarding process.
You could ask Global Agent to summarize the biggest drop-off point and tell you which user segments are the most susceptible to it.
Amplitude also offers a Session Replay Agent tool. This agent can analyze session replays at scale, spot friction signals (like rage clicks, dead clicks, and form abandonments), and map the flow of user navigation.
These AI tools take a lot of the grunt work out of data analytics without sacrificing the quality of those insights. But they are a bit scattered. As I explored the Amplitude dashboard, I couldn’t help wondering why Amplitude couldn’t have one centralized AI tool that does All The Things.
This is what Crazy Egg offers.
Google Analytics via Crazy Egg
When you access Google Analytics through Crazy Egg, the platform’s AI analysis is a lot more focused than it is on Amplitude. Instead of offering several different tools for several different uses, Crazy Egg uses imported plain-language summaries of important traffic and engagement trends inside Web Analytics.
Once GA is connected to Crazy Egg, your team can view traffic and engagement metrics, explore visitors by device, location, and source, see top pages and referrers, and read AI-generated summaries that explain key trends.
So the AI value prop here is more practical and nuts-and-bolts than expansive.
Crazy Egg’s AI summaries feature can automatically scan traffic trends and explain exactly what’s happening on your site. In plain, non-techy, non-marketing-speaky language, no less.
Crazy Egg’s AI also gives you next steps to take based on your data, which is probably my favorite thing about its AI summaries. They’re not just summaries, they’re highly targeted, analytics-powered recommendations.
So, instead of spending hours analyzing dashboards and trying to squeeze insights out of the array of bar charts and line graphs—and instead of trying to figure out how to use multiple AI agents—you can get straight to the good stuff.
Pricing Breakdown: Which Offers the Better Value?
We’ll compare pricing between Amplitude, Google Analytics, and Crazy Egg to give you the best idea of what you’ll pay if you use Amplitude vs. GA4 and CE combined.
| Feature | Amplitude | Google Analytics | Crazy Egg |
|---|---|---|---|
| Free Plan Available | ✅ Starter plan available | ✅ GA4 is free | ✅ Freemium analytics tools available |
| Enterprise Tier | ✅ Enterprise plans available | ✅ Google Analytics 360 | ✅ Enterprise plans available |
| Transparent Pricing | ⚠️ Some tiers require contacting sales | ❌ Enterprise pricing not public | ✅ Clear pricing tiers |
| Scales With Usage | ✅ Scales with tracked users and events | ⚠️ Mostly free unless using GA360 | ✅ Scales with pageviews and usage |
| Behavior Analytics Tools | ⚠️ Limited session replay features | ❌ No built-in behavior tools | ✅ Heatmaps, recordings, funnels, surveys |
| Product Analytics Focus | ✅ Core strength | ❌ Not designed for product analytics | ⚠️ Focuses more on site behavior |
| Traffic Analytics | ⚠️ Limited marketing analytics | ✅ Core capability | ✅ Available via GA integration |
| Google Analytics Integration | ❌ No native GA integration | ✅ Native platform | ✅ Import GA4 data into Crazy Egg dashboards |
In short,Amplitude offers excellent value for mobile app-based product teams that need to analyze feature usage, onboarding flows, and retention. (Psst, need more Amplitude alternatives? We’ve got you covered.)
Google Analytics is a way for marketing teams to track traffic sources, campaigns, and engagement for free, and it’s much improved by integration with Crazy Egg. This integration allows teams to see what visitors actually do and think with tools like heatmaps, session recordings, funnels, and surveys.
Final Verdict: Is Amplitude or Google Analytics Right for You?
If your main goal is to understand how users interact with your mobile app, Amplitude is an excellent choice. Its event-based analytics are built to specifically analyze the things that concern apps, like how many people actually use a new feature or return to the product regularly.
If you’re more focused on website traffic and performance, Google Analytics is the better fit.
But since you can get GA4 through Crazy Egg, I firmly believe this is the winning combo. Especially since it’s completely free to get started using these two powerhouse tools together.
Sign up for Crazy Egg to explore our suite of free forever tools, including web analytics, instant heatmaps, conversion analytics, and surveys.