Search “online form statistics,” and you’ll get the same dozen numbers, copied from roundup to roundup: 81% of people abandon forms, multi-step forms convert 86% better, the average form converts at 1.7%. They go back to the 2010s, and some were never reliable to begin with.
This roundup doesn’t!
Every stat here is linked to its primary source, and only a handful are older than 2024.
It covers real conversion rates, which fields and design choices move completion, and which popular stats to retire for good. I also explain how to find where your form leaks.
Key Online Form Stats: Overview
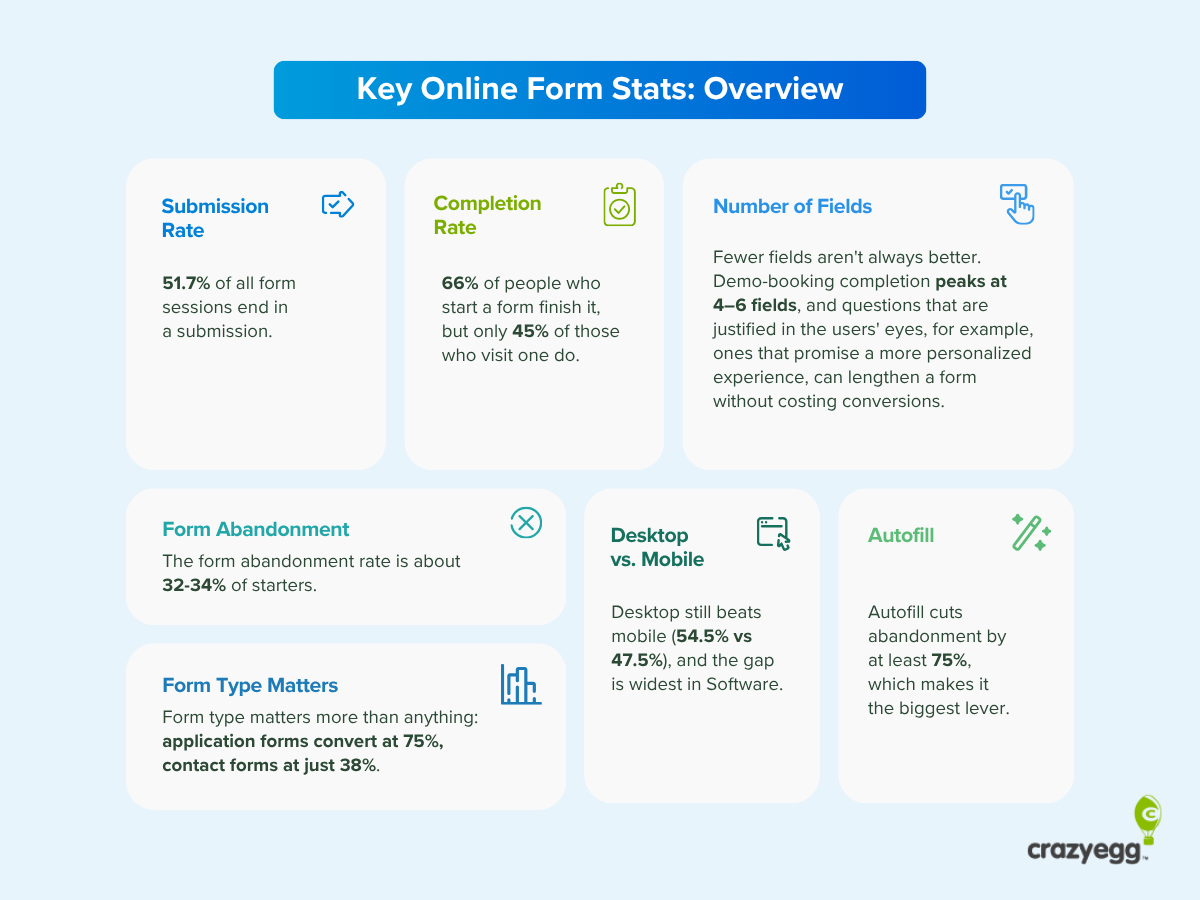
- 51.7% of all form sessions end in a submission.
- 66% of people who start a form finish it, but only 45% of those who visit one do.
- The form abandonment rate is about 32-34% of starters.
- Form type matters more than anything: application forms convert at 75%, contact forms at just 38%.
- Desktop still beats mobile (54.5% vs 47.5%), and the gap is widest in Software.
- Fewer fields aren’t always better. Demo-booking completion peaks at 4–6 fields, and questions that are justified in the users’ eyes, for example, ones that promise a more personalized experience, can lengthen a form without costing conversions.
- Autofill cuts abandonment by at least 75%, which makes it the biggest lever.
Form Completion and Abandonment Statistics
Your average form conversion rate depends on the denominator. If you count everyone who starts, about two-thirds finish. If you count everyone who visits, it’s closer to half.
Past that, completion rates swing by form type, industry, and device.
- The average form completion rate is 51.7%. 45% of people who visit a form and 66% of people who start an online form complete it (Zuko, 2025). The latter is consistent with FormAssembly’s 2025 data: the completion rate was 68% (based on 1.6 billion form interactions). Typeform puts its completion rates at 47.3%, so considerably lower, but the data comes from 2023.
- Zuko’s and FormAssembly’s completion rates cited above translate into 34% and 32% form abandonment rates, respectively.
- Travel forms complete at 60.51%, followed closely by financial services forms at 58.38% (Zuko, 2025).
- Property forms sit at the bottom at 34.55%, with media close by at 36.29% (Zuko, 2025).
- Application forms have the highest starter-to-completion rate of any form type at 75%, while contact forms had the lowest. Only 38% of people who interact with one end up submitting it (Zuko, 2025).
- Completion, when it happens, is quick: on average under 3.5 minutes. (FormAssembly, 2025).
- Checkout forms take the longest to complete: 3 minutes 21 seconds to complete on average, versus 1 minute 35 seconds for registration forms (Zuko, 2025).
- The average abandoned session ends after 1 minute 43 seconds. At 50 seconds on average, comparison forms get abandoned the fastest (Zuko, 2025).
- Desktop forms complete at 54.48% versus 47.53% on mobile (Zuko, 2026).
- Desktop out-converts mobile in every industry except gambling. The biggest gaps appear in Software (53.53% vs 38.61%, 14.9 pts), Property, Data services, and Education (9.8 pts, 9.7 pts, and 9.5 pts, respectively). In Media and Utilities, the difference was the smallest (1.6 pts and 1.8 pts), while mobile outperformed desktop in gambling by 0.15 pts (Zuko 2026).
Popup Form Statistics
Email-signup popups are their own category. They tend to have lower conversion rates than inline forms, and not only some of the same design principles apply. So, judge them on a separate scale, and be careful comparing sources: the published averages run from 2.1% to 4.8%.
- The average popup converted 4.82% of displays into email signups, up from 4.65% the year before (Wisepops 2025). Omnisend’s 2025 analysis of 1.24 billion popup displays put the average email-signup form popup at 2.1%, down from 2.3%,
- Popupsmart puts the average conversion rate at 3.49%, but the denominator is interactions rather than displays, so it isn’t directly comparable to the Wisepops or Omnisend figures (Popupsmart, 2025).
- Ecommerce popup forms convert best by industry at 6.88%, while B2B convert worst at 2.01% (Wisepops, 2025).
- Popups offering a discount converted at 7.45%, 62% better than popups without one (Wisepops, 2025).
- A display volume of popup forms increased by 54% from 2024 to 2025 (Omnisend 2025).
- Popup forms with one to three fields all convert at 2.1-2.2%, four fields drop to 1.5%, and five or more to 1.4% (Omnisend, 2025).
- Desktop-only popups converted at 1.4%, versus 2.2% for popups shown on mobile or on both devices (Omnisend, 2025).
Form Design and Field Statistics
Form length and field design are two of the biggest factors in whether users complete a form or drop off — but layout, field order, validation, and even wording move the needle, too.
Shorter forms don’t always have higher completion rates, though simpler ones usually do. And visitors are happy to complete longer forms when they see a good reason — or have no choice.
- Single-column layouts beat multi-column in 64% of 500 form A/B tests analyzed by Atticus Li (2026). The explanation is that vertical scanning creates a lower cognitive load.
- In multi-page forms, saving responses so they don’t get wiped when the user moves back to the previous step correlates with conversion improvements of up to 10% (Zuko, 2021). There is no conclusive or current evidence that multi-page forms perform better than single-page forms.
- Forms with images or video see 120.6% higher completion than forms without (Typeform, 2024)
- Attaching a lead magnet — a discount, gift card, or gated guide — lifted form completion by nearly 5% (Typeform, 2024)
- Wording that implied exclusivity (“be the first” and “members only”) lifts completion by 10.6% (Typeform, 2025). A previous Typeform study found the increase even greater at 25% (Typeform, 2024)
- Forms with highly positive sentiment got 17% more completions than highly negative ones (Typeform, 2025).
- Home page forms tend to get longer. In 2026, they averaged 6.9 form inputs, a 36% increase in three years. (WebAIM, 2026).
- Putting a question on the welcome screen correlates with a 5% lower form completion rate (Typeform, 2025).
- Forms that opened with easy fields (name, email) and saved the demanding ones for later got 18% higher completion than forms that front-loaded the hard questions (Atticus Li, 2026).
- Form submission success follows a bell curve: demo-booking forms with 1-3 fields succeeded 41% of the time, 4-6 fields peaked at 51%, and 7+ fields fell to 31% (Factors.ai, 2022).
- 10-question lead-capture forms average 28% lower completion than 3-question forms (Typeform, 2025).
- The average US checkout flow has 23.48 form elements, 14.88 of them form fields (Baymard, 2025).
- Usability testing shows an ideal checkout needs as few as 12-14 form elements, or 7-8 actual fields (Baymard, 2025)
- Adding one self-qualifying question with three to four clear options to a B2B lead form increases completion rates by 8-12% and improves lead quality (Atticus Li, 2026).
- Progressive profiling — asking for a little now and more on later visits — beats one long form in 78% of A/B tests (Atticus Li, 2026).
- Form length matters less than intent. Local government forms require 71 inputs and take about 8.5 minutes on average, but still have an 85% view-to-completion rate, because filers have no alternative (Zuko 2025).
- On account-creation forms, the password field has the highest abandonment rate (10.5%), which is more than double the address field’s 4.3% at the low end. Users spend 7.2s (close second after address) and require the most corrections at 0.65 field returns per session (Zuko, 2022).
- On B2B lead forms, the phone number does the most damage: requiring one drove 37% more drop-off across Atticus Li’s 500 A/B tests, the highest-friction field ahead of revenue and budget questions (Atticus Li, 2026).
- Address fields take the longest to complete at 7.4 seconds, while name fields are the quickest at 3.5 seconds (Zuko, 2022).
- Inline validation cuts both ways. Done well — flagging errors as the user types — it cut form errors by 22% and lifted completion by 9%. Done badly — firing errors before someone finishes typing — it raised abandonment by 14% (Atticus Li, 2026)
Autofill Form Statistics
Autofill is the best-documented completion lever there is, and close to a free win — it costs the user nothing. The catch: it only fires on properly labeled fields, and a third of forms still get the labeling wrong.
- Users who filled forms with autofill abandoned them at least 75% less often than users who typed everything, in Chrome’s study of address and credit card forms across millions of US page loads (Chrome, 2024).
- Zuko’s autofill analysis found 23% of users triggered autofill, and those users completed web forms at 71% versus 59% for non-users (Zuko, 2022).
- Autofill lowers the time spent filling forms by 35% (Chrome, 2024).
- Autofill only works on properly labeled fields, and 33.1% of form inputs weren’t properly labeled in the WebAIM Million 2026 analysis (WebAIM 2026).
- Recall, which is auto-filling a respondent’s earlier answers into later questions, lifts completion by 10% (Typeform, 2025).
Stats to Retire for Good
When researching the article, I came across a bunch of stats that get recycled a lot but bring no value. They’re outdated, built on a shaky methodology, or measure something other than what people think it does
“81% of people have abandoned a form.”
This is a lifetime-recall number, not a performance rate. The survey asked whether people had ever abandoned a form. It tells you nothing about form performance. And it’s from 2018!!! (The Manifest, 2018)
“Multi-step forms convert 86% higher”.
I traced this one back to two sources: 2015 data from form builder FormStack and a 2019 survey from HubSpot. So both are ancient, but that’s only a part of the issue.
Formstack attributed the discrepancy to multi-step forms being more user-friendly. But as Marketing Charts points out, they failed to recognize that multi-page forms tend to be high-intent types like contests, while single-page ones are low-intent forms.
As to the HubSpot data, it’s based on survey responses from 173 marketers, only 40% of whom use them. So the sample is small and the data self-reported, and I wouldn’t trust it. Especially as the same survey found conversion supposedly rising with every added field, which HubSpot’s own authors called “incredibly unlikely.”
“The average form conversion rate is 1.7%.”
Ruler Analytics defines “average form rate” as the share of all website visitors who fill out a form and become a qualified lead. It isn’t the share of people who started a form and finished it. Quoted next to form completion benchmarks like the 45–66% above, it’s an apples-to-oranges comparison.
“Only 3% of people prefer filling out forms on mobile” (versus 84% on desktop).
This is stated preference, not behavior — from the same 2018 Manifest survey. Mobile now carries a large share of form sessions and completes at 47.53%, only seven points behind desktop.
“Single-column forms are 15.4 seconds faster.”
The Speero study produced statistically significant results, but it was conducted in 2016, and on desktops only (and it doesn’t say anything about completion rates).
How To Find Where Your Form Is Leaking
The above stats tell you what completion rates to expect and how to optimize your forms. However, the exact fixes depend on your form design and the questions you ask.
How do you find what’s stopping users from completing the form?
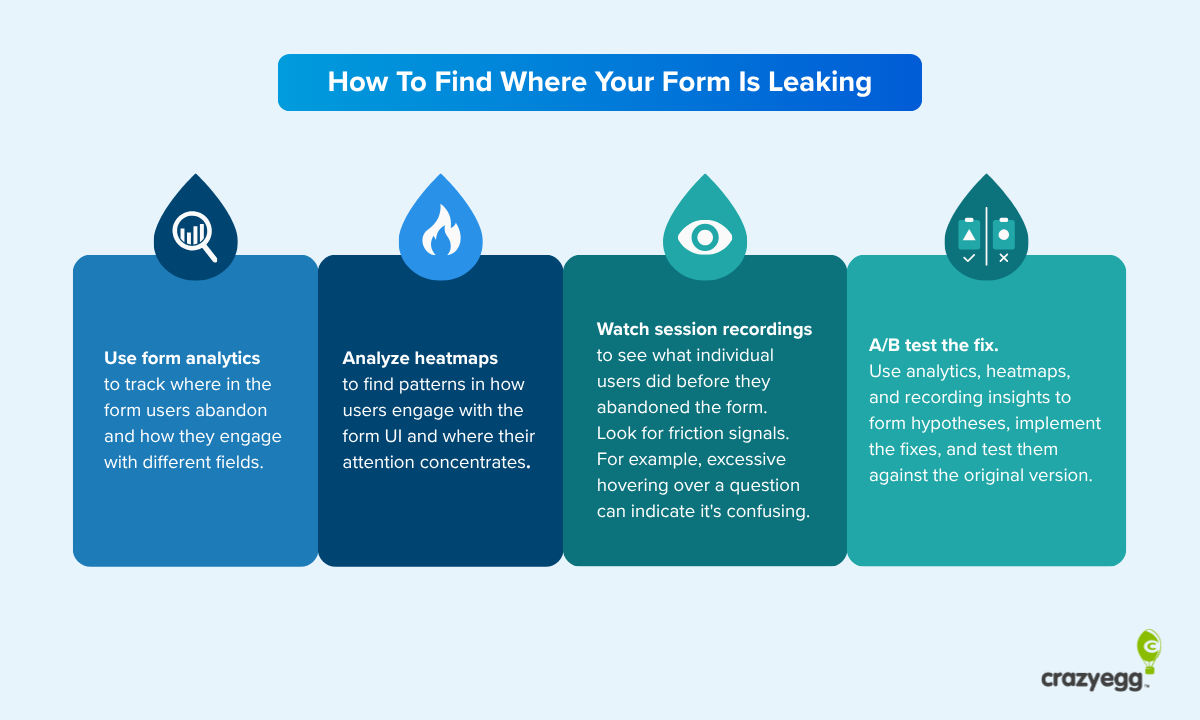
- Use form analytics to track where in the form users abandon and how they engage with different fields.
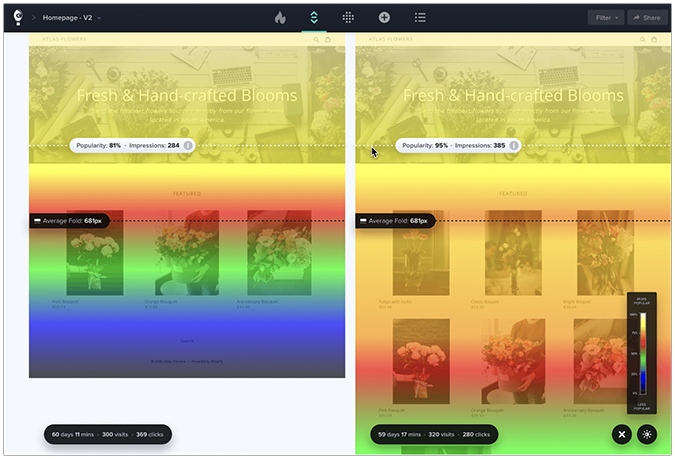
- Analyze heatmaps to find patterns in how users engage with the form UI and where their attention concentrates.
- Watch session recordings to see what individual users did before they abandoned the form. Look for friction signals. For example, excessive hovering over a question can indicate it’s confusing.
- A/B test the fix. Use analytics, heatmaps, and recording insights to form hypotheses, implement the fixes, and test them against the original version.
What These Numbers Tell You
If there’s one takeaway from this article is that usability and ease of use beat brevity.
Shortening forms does work — when you’re cutting irrelevant questions that users don’t see the point of. But if the question selection is justified, the biggest conversion gains come from autofill, a single clean column, and sensible inline validation.
The form conversion benchmarks give you a ballpark idea of where you’re standing, but they won’t help you close the gaps. To do so, you need your own data.
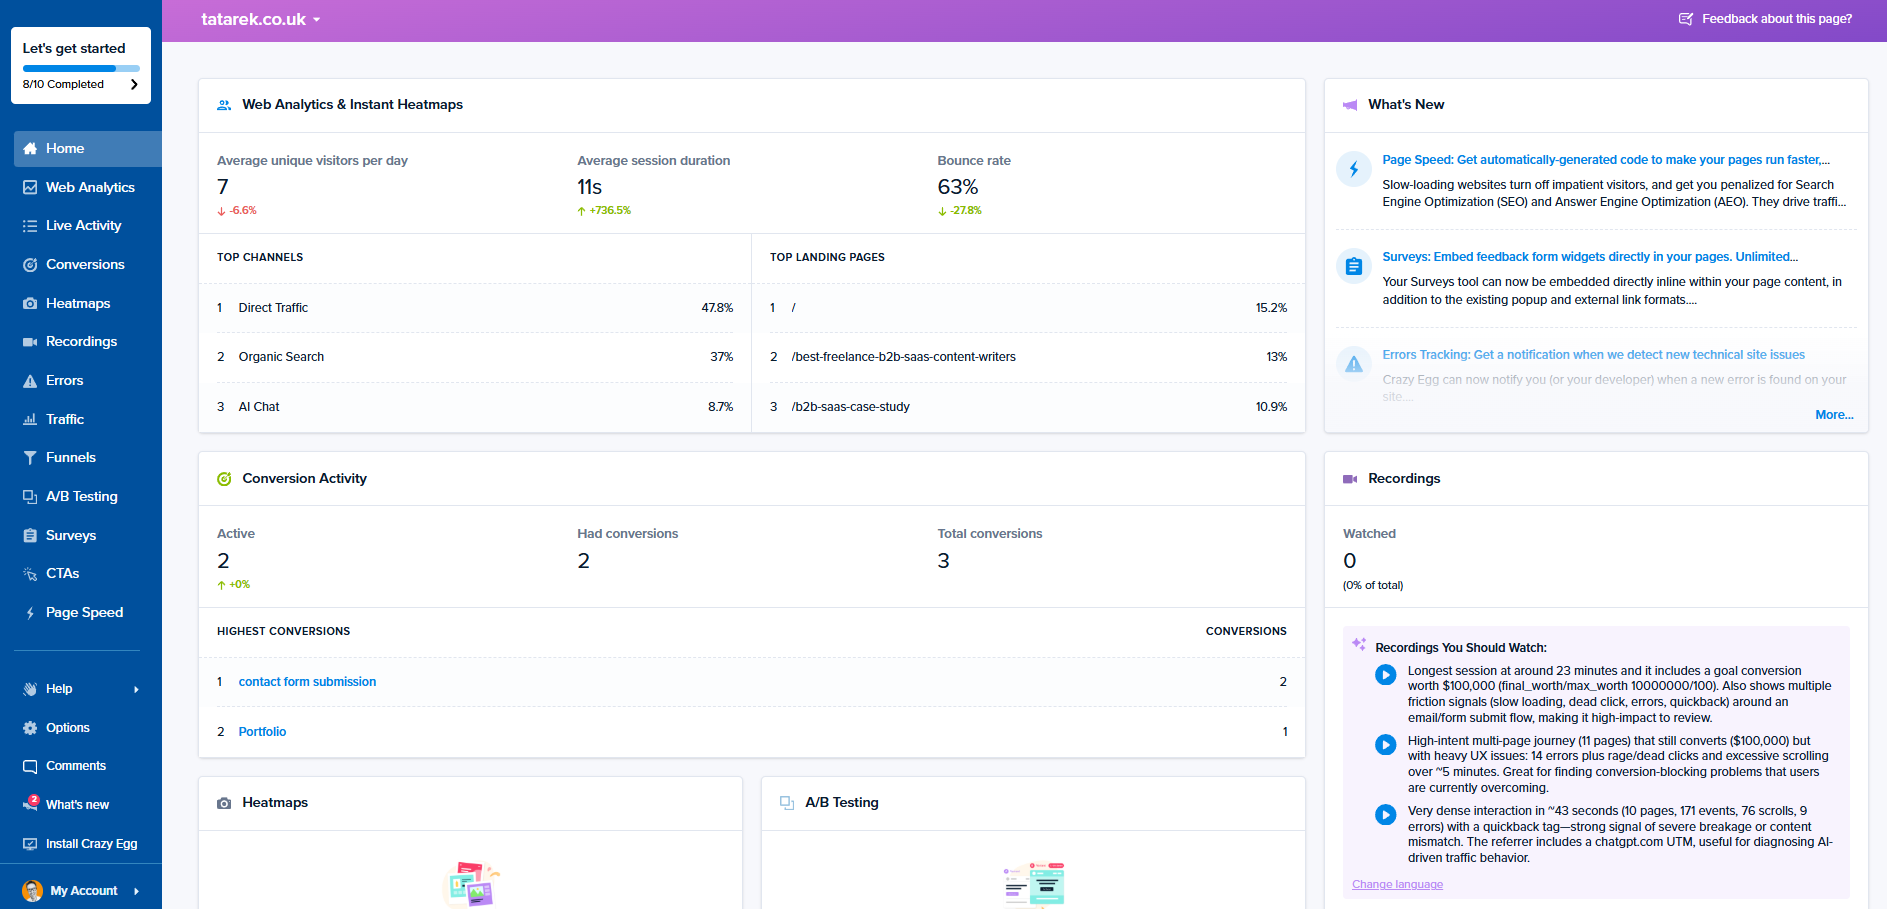
Crazy Egg’s heatmaps show how people engage with the form and where their attention concentrates, session recordings show exactly where individual users stall, and A/B testing confirms the fix worked. Start your free trial today!