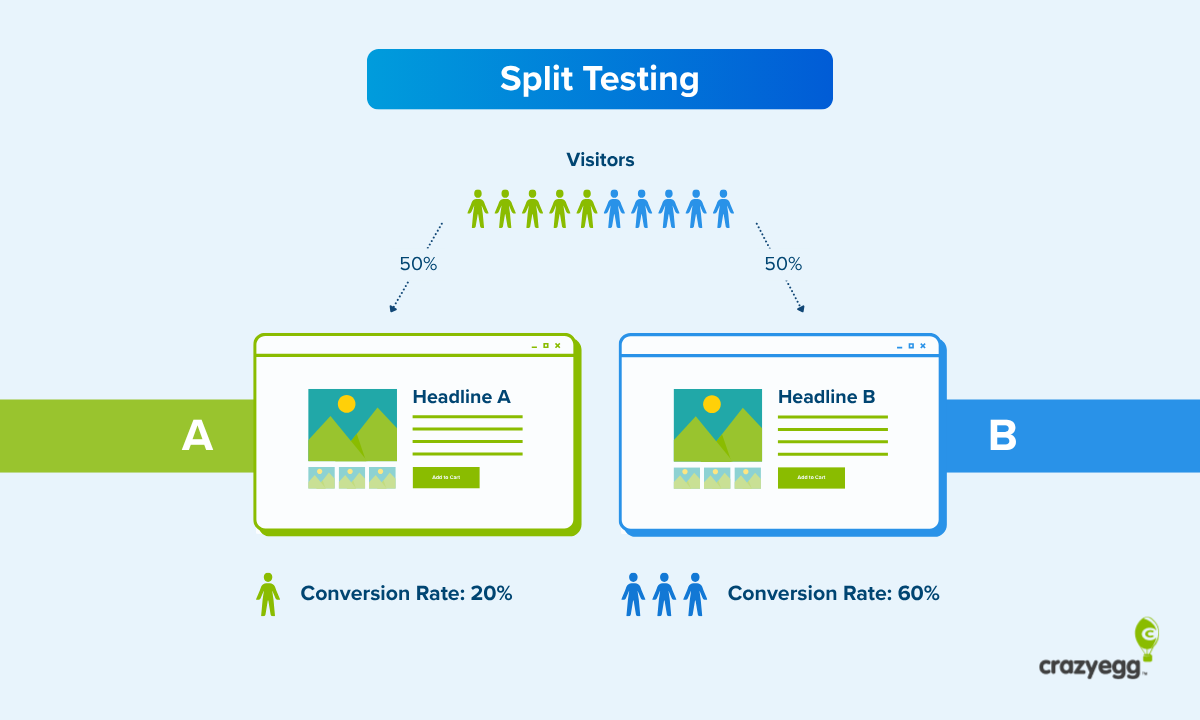
When you are ready to test big ideas on your website, split testing is ideal.
A/B testing is great for looking at individual page elements. Multivariate testing is perfect for refining a page that’s already on point.
With split testing, you can build out an entirely new page experience, share it with users, and let the data tell you which version is best.
What Is Split Testing?
Split testing is a controlled experiment on a single page of a website that allows brands to test the potential effect of major website changes with live traffic.
This could include new page designs, messaging strategies, navigation schemes, and other similar large-scale updates.
During the test, website traffic is split between the existing page (the control) and the new page (the variation), and the performance is compared based on a specific conversion goal.
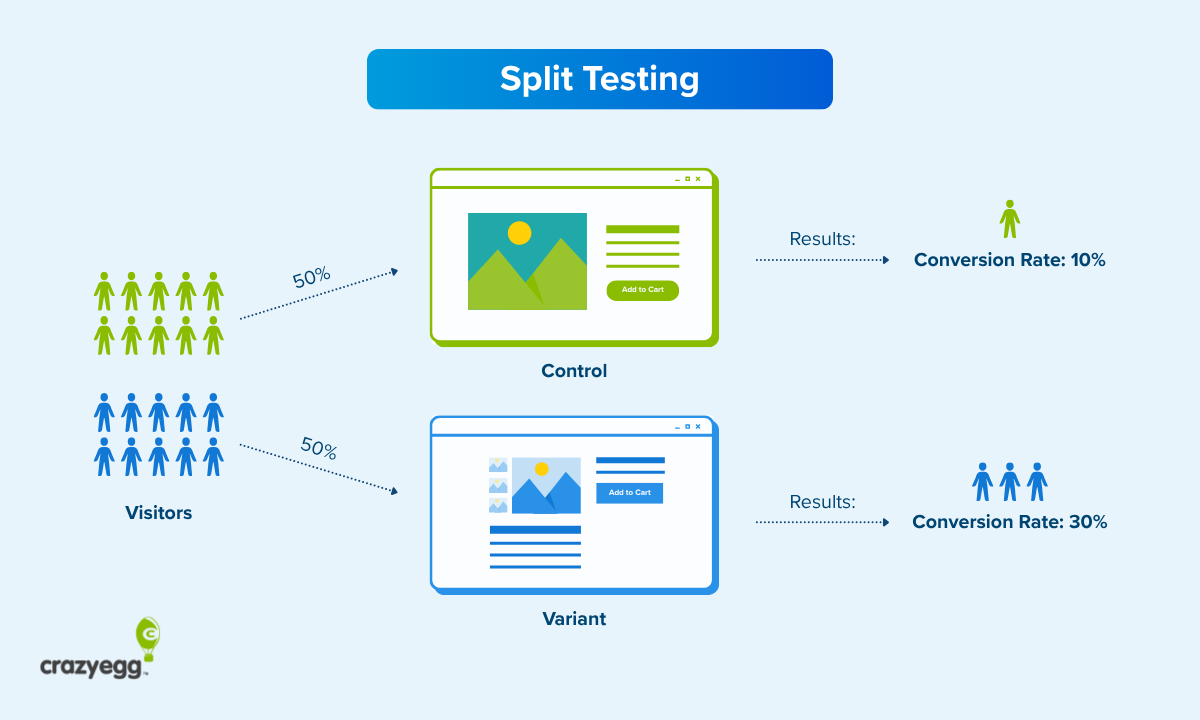
Once enough users have passed through the test, you will be able to see which version had the best conversion rate for your desired action. In other words, did the control or variation get a higher percentage of users to take the desired action?
Some examples of common split test scenarios might be:
- We think it’s time to overhaul our page design and try something new.
- We want to see if a light or dark theme performs better with users.
- We think that long-form content will perform better than short-form.
- We believe that simplifying our navigation menu will improve conversions.
Everyone has great ideas for what to do with your website. Split testing lets you see which ideas actually increase engagement and lift the conversion rate.
Create the new-look design, test it with your live website audience, and see if it really does perform better.
What can you change in a split test?
Anything you want. In terms of creating new page variations, the only factor that must remain constant is the conversion goal, which is the desired action you are trying to get people to take on the site.
This is usually measured by the number of clicks on the button to sign up, add to cart, buy now, take a demo, or another similar action.
All the text, images, and buttons could be completely different in the variation, but the underlying desired action must be the same.
Split Testing vs AB Testing
The major difference is that AB testing is always focused on making a single change to a single page element, whereas split testing allows you to make as many changes as you like.
With AB testing, you can drill down into the specific impact of individual page elements and get clear data on which variation of that element works best. You can also swap individual elements to see the relative impact on conversions.
Since you are only making one change, you can isolate its effect.
The types of insights you get from AB testing help you figure out questions like:
- Should we use a Key Takeaways section or not?
- Should the Key Takeaways be above or below the intro?
- Should we use bullets or emojis in the Key Takeaways?
An A/B test can definitively answer all of these questions, but it would take three discrete tests.
With split testing, you make more than one change, and are looking at the aggregate differences of all the changes you made between control and variation. There’s no definitive way to know which modified elements are driving conversions.
Why do people use A/B and split testing interchangeably?
Because a split test is a type of A/B test.
Regardless of how many variables you change on a page, you are only ever looking at two different page experiences: the existing page (A) and the test page (B). Even if you completely redesign the test page, it’s still a simple A/B test pitting control against variation.
I spent time making the distinction here because, in my opinion, these are two completely different testing methods with different purposes.
AB testing is for assessing individual elements and trying to figure out what matters. Split testing is better for assessing radically different page experiences.
Another reason that you will see people treat these terms synonymously is because many testing tools (especially those focused on email and social media) use the term split testing to describe AB testing.
Split Testing vs Multivariate Testing
The major difference is that multivariate testing (MVT) allows you to compare the performance of more than two page experiences. Whereas split testing allows you to change multiple page elements and assess the overall performance, MVT compares every possible page experience.
Let’s say we run a split test where we write a better headline, swap in a new hero image, and come up with a more unique call to action. That’s three variables, and the split test will tell the overall effect of those changes on the conversion rate for both page experiences:
- Headline A, Image A, call to action A
- Headline B, Image B, call to action B
If we used MVT to assess the same three variables, we would be able to see the impact on conversion rate for all eight possible page experiences:
- Headline A, Image A, call to action A
- Headline B, Image A, call to action A
- Headline A, Image B, call to action A
- Headline A, Image A, call to action B
- Headline B, Image B, call to action A
- Headline B, Image A, call to action B
- Headline A, Image B, call to action B
- Headline B, Image B, call to action B
Because MVT runs through all of these experiments, it’s possible to find the best combination of page elements. You can also start to see how different elements work together and which ones have the largest impact on conversion rates.
Split testing simply cannot give you those types of insights. It’s not looking at different combinations of page elements, so you can’t really drill down into how they interact.
The downside of MVT is that most websites don’t have enough traffic to use it.
Even in the simple example above, you would need to split traffic eight ways in order to test all possible page experiences. My back of the envelope math says that running this test would require a single page to have at least 32,000 visitors each month.
When you don’t have this kind of traffic, split testing is the best way to test changes to multiple variables on a page at the same time.
You won’t get the element-level visibility of MVT, but you can still get insight into whether or not the proposed changes are safe to make.
5 Great Reasons To Use Split Testing
1. Evaluate a new website concept
This is the most common reason that people use split testing. Brands want to change something big about the website, but they don’t want to jeopardize conversions.
It’s often used:
- Ahead of a new site launch
- To test radically different layouts or navigation
- Before expanding into a new market
- As part of re-branding efforts
If you are committing to a rebrand, you need to make more significant changes to your content than switching the button text. A/B testing is not built to run the types of experiments that help you find the optimal website navigation structure or layout.
Split testing helps you see the true impact of these changes, which is often less dramatic than people expect. I have seen brand new page layouts have close to zero effect on conversions.
The truth is, you have to take some risks with a new design in order to stand out from the crowd. You have to take pretty big swings in order to see a significant lift to conversions. Split testing can help you de-risk that process and learn a lot about your customers at the same time.
2. Migrate to simpler, lighter designs
Let’s say you have a page design that is one or more of the following:
- Annoying to update
- Expensive to maintain
- Slow loading
- Not meeting accessibility criteria
All of these are bad and they are only going to get worse if the page is left untended.
Split testing is a safe, methodical way to find a new page design that addresses these problems.
Are your resource-intensive page features (like videos and interactive elements) really pulling their weight? Is your long-form content engaging and useful enough to justify asking writers for 4,000+ words?
Split testing will tell you. Maybe you need 800 good words, not thousands. Maybe a simple image and headline converts better than the splash video. In both cases, you would speed up your website and the content workload.
It takes some effort, but usually a good website designer can help you figure out a cleaner, faster page design that looks as good or better as your existing page.
With these types of split tests, you don’t need to show a conversion lift to justify making the change. If you don’t hurt conversions, it makes sense to implement a design that’s cheaper, faster, more accessible, or less work to maintain.
3. Validate new messaging strategies
There are all sorts of reasons why brands want to try a new messaging strategy, and with split testing, they can get some hard data on what users think about it.
You can experiment with big changes, like a new value proposition, which likely requires all new text and images to support it. Other messaging experiments could focus on:
- Tone: friendly vs corporate
- Emphasis: social proof vs feature specs
- Audience: beginner vs insider
- Positioning: discount vs premium
- Narrative: problem solving vs aspirational
Compared to the existing page, are people clicking through more? Are they spending more time? Are they converting?
No matter how well they have identified their target audience, there are always assumptions baked into any marketing strategy. The bolder the vision, the bigger the risk.
With split testing, you can see if your new story resonates with buyers before rolling it out to the public. You may also find that particular segments respond better to the new messaging than others, which is very valuable information.
4. Enhance user experience
Another reason people use split testing is to improve the user experience (UX). In these types of tests, researchers are trying to:
- Discover which features frustrate, confuse, and slow down users
- Create new website elements and designs that remove those problems
Yes, the ultimate goal is to make it easier to buy, sign up, etc., and improve the conversion rate, but the types of tests you run will be different, and you will likely pay more attention to things like bounce rate, time on page, click patterns, and other UX metrics beyond conversions.
This kind of UX testing is very common for online stores, which want to compare different checkout flows, mobile menus, and layouts for product detail pages. Some ecommerce platforms have built-in split testing features and integrations with third-party testing tools.
5. Understand user preferences
What does your audience want? What do they prefer? What makes them engage more?
These are valuable questions to answer whether or not you are thinking about a novel website design or entering a new market.
For example, you could test two different page layouts with the same content: one minimalist with simple line art illustrations and lots of white space, the other a rich editorial page with high-resolution images.
Which do users respond better to? If the new variation fails hard, you can keep iterating and try another angle. Or, you could take it as a sign that it’s time to double down on your current strategy.
Pairing this kind of split testing with surveys and user interviews is an excellent way to make sure that your designers and writers are working with an accurate picture of what the audience wants.
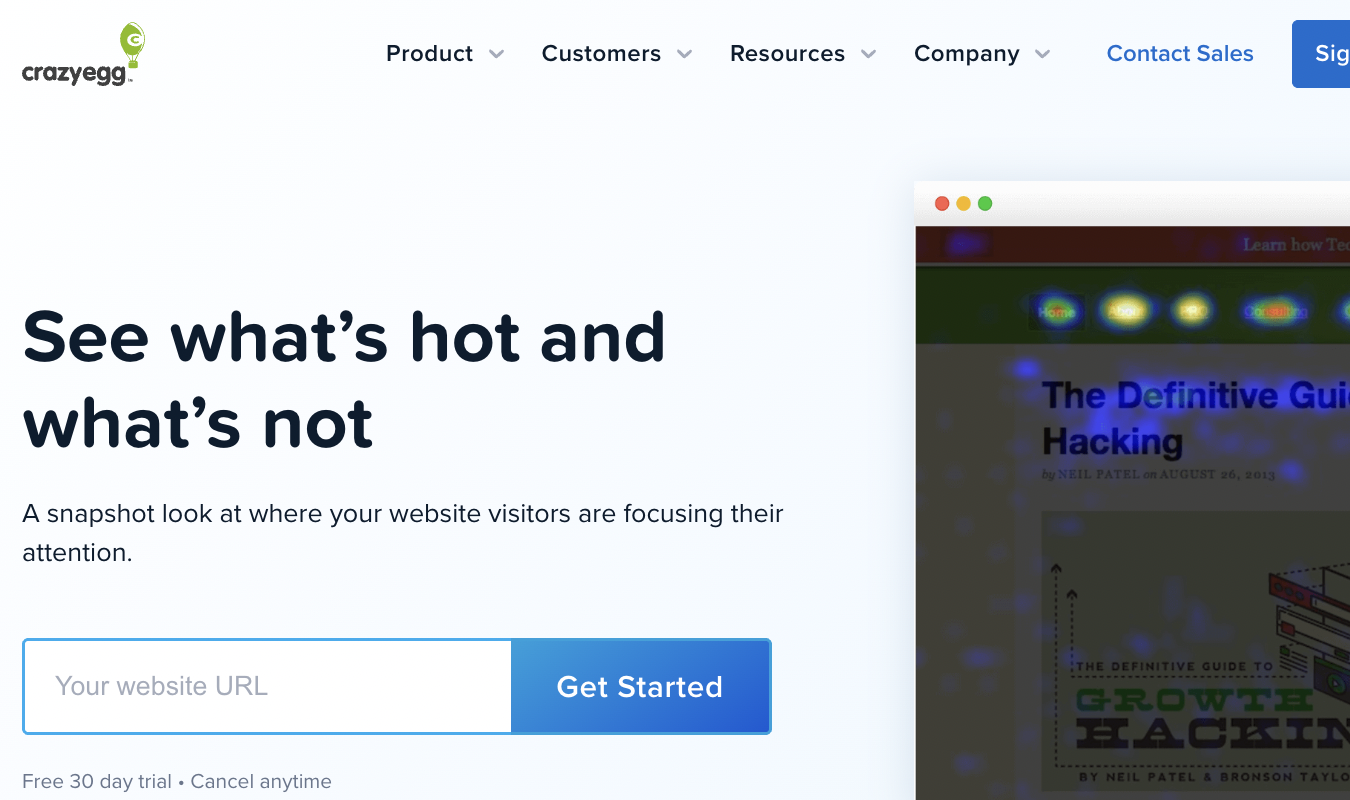
How Get Started with Split Testing Quickly
Many A/B testing tools give you the ability to split test web pages. I’d start there, because if you are running split tests, it’s almost certain that you are going to want to be able to A/B test eventually to refine your design and optimize every element.
I do not recommend trying to split traffic yourself and building tests on separate URLs. Any testing tool will handle all of that without disrupting the experience on your site or negatively impacting SEO.
Once you have a testing platform that you feel comfortable with, it’s time to start testing and improving pages.
1. Find a promising opportunity to test
Log into Google Analytics 4 (or whatever you use for web analytics) and find pages that have at least 8,000 sessions per month. This is your pool of pages that you can split test.
Every form of testing requires a large enough sample size to give researchers confidence that the results are true. Split testing websites is no different, and the rule of thumb is that you want to have at least 1,000 visitors go through the control and variation each week.
Without a critical mass of traffic, you won’t be able to run tests that reach statistical significance. In other words, you can’t be confident that the outcome you observed is not just random.
Once you have a list of potentially testable pages, the next step is deciding which page to work on first.
In GA4, look at the key customer engagement metrics, and see if anything sticks out.
For example, relatively low time on page or conversions suggests that people aren’t finding what they need. That could be a good opportunity.
Keep going until you have found a few pages that look promising.
Tip: Visit the live pages you are looking at in GA4. If you find something clearly wrong with the page, fix it, and come back to that page later. There is no sense in testing a page that can be improved today with common sense or basic conversion rate optimization tactics.
2. Collect baseline data
List all of the viable pages for split testing in a spreadsheet and record key metrics that tell you how the page is currently performing. This is the baseline you will seek to improve.
I would definitely include the average monthly traffic for each page and its current conversion rate. You will need both of these metrics in order to set up the split test later.
You might also want to include the primary traffic source (organic search, paid social, etc), the engagement rate, exit rate, or total revenue depending on the subject of your test.
Be sure to break out mobile and desktop traffic as separate percentages. It’s useful to know this when you are designing test experiences, as user behavior is very different depending on the device. It’s also helpful for interpreting results, especially when the traffic is heavily skewed toward one display size or another.
3. Create a hypothesis
At this point, you have a list of pages and where they stand today. The next step is coming up with a testable idea that you think will lift conversions.
This starts with a hypothesis, which is usually formatted something like:
We believe that [making change X] will [have effect Y].
Here are a few real-world split testing hypotheses:
- We believe that a new friendly site design will increase email newsletter signups compared to our current corporate design.
- We believe increasing the wordcount from 800 to 4,000 will increase the click through rate on our primary CTA.
To create your own hypothesis, find inspiration from your competitors, leading brands in other markets, and by digging into data you have on your existing customers. Read more about hypothesis testing and get tips for coming up with impactful experiment ideas.
Keep the resources you have in mind. It’s true that a new interactive feature would probably boost engagement, but it’s going to be more demanding to create that test.
4, Build the test experience
Every testing platform provides a point-and-click interface to help you create modified test pages. Log in, create a new test, and enter the URL of the page you want to test.
From there, you can start modifying the page and creating the test experience you defined in your hypothesis. In the example below shows someone making changes to a variant of an ecommerce product using Crazy Egg:
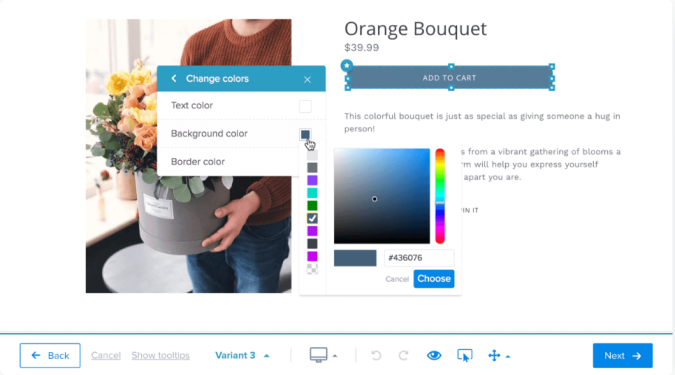
Along with building out the experience, you will also track conversions directly within the platform. This involves tagging and labelling specific elements within both the control and variation.
Double check all the links work. Preview the design to make sure it looks right on desktop and mobile.
5. Run the test
Once everyone is happy with the test experience, it’s time to run the test.
You will be prompted to enter some key inputs which help the test platform determine the required sample size and test duration.
These inputs include average monthly traffic and the existing conversion rate (which you should have already), as well as:
- Minimum detectable effect: The smallest change in the conversion rate that you care to detect. If you are not going to act on a 2% lift, for example, you’d set the threshold higher.
- Statistical power: This is the likelihood your test will detect a real difference when one actually exists. It’s usually set to 80%, which means there’s a 20% chance you’ll miss a true effect due to sample limitations.
- Significance level: This is how sure you want to be that your test results aren’t due to random chance. A 95% confidence level means you accept a 5% risk that the outcome is random.
Once you have plugged in your numbers, the platform will estimate a duration. As long as it fits within your timeframe, you are ready to go.
Run the test.
Most tests should run two weeks, potentially longer if you want a 99% confidence level, or you are trying to detect really slight changes in performance.
Do not stop the split test before it has reached statistical significance.
6. Analyze the results
The platform will let you know when you can stop the test based on the parameters you set.
Results are reported in a dashboard that shows how both versions performed overall and how they compare. There is also a confidence level that expresses how certain you should be that the changes you made are responsible for the differences in outcomes.
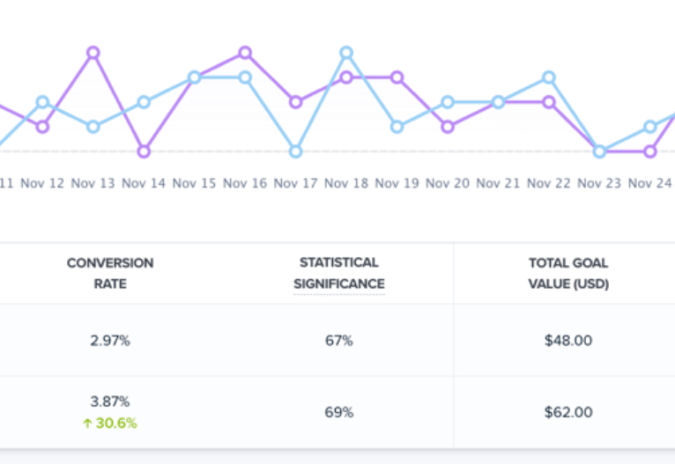
Here’s a screenshot of key results after running a split test in Crazy Egg. You can see the conversion rates, the relative improvement (in green), statistical significance, and total dollar value.
What you want to see is an improvement in performance by the variation with a high reported confidence level.
For example, the variation had a conversion rate that was 18.4% higher than the control at a 96% confidence level. That’s a winner in almost anyone’s book.
Sometimes the results are less impactful, and there’s very little difference in performance between the control and variation.
Or, as in the Crazy Egg screenshot above, you get a big win on the conversion rate (+30.6%) paired with a statistical significance of 69%, which is not reassuring. That means there’s a 31% chance that this big conversion rate boost is merely a random occurrence.
When you don’t see a conversion lift in the overall numbers, sometimes you can find a win by looking at the performance of the variation with particular segments. Most tools will let you dig into traffic by source, referrer, country, new vs. returning users, and more.