Wondering whether to use Mixpanel or Amplitude for product analytics? Mixpanel is best for B2B companies that track tons of events, while Amplitude is ideal for tracking individual active users.
Let’s dig into the reasons why.
Mixpanel vs. Amplitude: A Quick Snapshot
Need a visual to help you decide? We’ve got you covered.
| Feature | Mixpanel | Amplitude |
|---|---|---|
| Ideal for | B2C and B2B companies that want reports, funnels, and account-level analytics | B2C companies and product teams that want flexible charts and experiments |
| Starting price | Free plan (up to 20M monthly events); Growth plan free for startups up to 1M events/year | Free plan (basic analytics); Growth plan adds advanced features like heatmaps & 12-month replay retention |
| Product Analytics & Reporting | ✅ Report-based ✅ Strong for funnels and retention with real-time updates ⚠️ More structured but less flexible than Amplitude | ✅ Chart-based ✅ Flexible (with more upfront setup) ✅ Microscope tool gives deep detail on drop-offs |
| A/B Testing & Optimization | ⚠️ Basic A/B testing only on Enterprise plan ✅ Can set up custom control/variant groups ⚠️ Better used to analyze results from external A/B tools (e.g. AB Tasty) | ✅ Robust A/B/n testing built-in with Experiment ✅ Smart Traffic (AI) on Optimize+ routes users to best version ✅ Context-rich testing (problem statement, hypothesis, metrics) |
| User vs. Account-Level Analytics | ✅ Group Analytics Add-on ✅ Company Profiles show KPIs, engagement, and retention per account ⚠️ Requires coding for advanced setup | ✅ Group Behavior Analysis ✅ Strong for user-level and cohort analysis ❌ No built-in company-level profiles |
| Heatmaps & Session Replay | ✅ Heatmaps (currently click maps only) + Session Replay ✅ 10K–20K free replays/month depending on plan ✅ Cohort/event filtering for focused analysis ⚠️ Only 30-day retention unless you buy paid replay add-on (up to 360 days) ✅ Works on iOS, Android, and web | ✅ Heatmaps: Click, Scroll, Selector maps ✅ Session Replay tied to heatmaps for context ✅ Integrates with A/B testing and cohort tools ⚠️ Replay retention: 1 month on free; 12 months on Growth/Enterprise ⚠️ Heatmaps only on Growth+ plans ⚠️ Works on web/mobile web only (not apps) |
| Integrations | ✅ Data warehouse connectors (Redshift, Snowflake, etc.) ✅ Supports AB Tasty + other A/B testing tools | ✅ Integrates with feature management and experimentation tools |
| Support | ✅ Docs and community on free plan ✅ Better support for Growth and Enterprise tiers | ✅ Email/chat support on paid plans ✅ Enterprise adds dedicated support |
Feature Breakdown: Mixpanel vs. Amplitude
The best way to see how two tools compare is to study how the core features stack up against each other.
Let’s get started.
1. Product Analytics and Reporting
Mixpanel
Mixpanel offers robust analytics for digital products, websites, and apps. It allows you to see clear funnels—aka, get a birdseye view of whether users convert or drop off at various points.
You can organize users by different segments to get a better idea of why they behave the way they do.
For example, let’s say you run a restaurant review aggregator website. You decide to gate the reviews by asking for an email address to receive occasional marketing materials.
Users can see the first two reviews for any restaurant, along with the overall rating out of 5, but that’s all.
They must offer up their email address to see the full snapshot.
Using Mixpanel, you learn that 75% of users in their 20s and 30s stop interacting once they’re asked to share their email. Over 80% of users in their 40s and 50s, on the other hand, seem fine with handing the information over.
This is the beauty of Mixpanel’s funnels: you can follow users from the moment they arrive to the moment they convert (or drop off), and then use that information to make smarter product and marketing decisions.
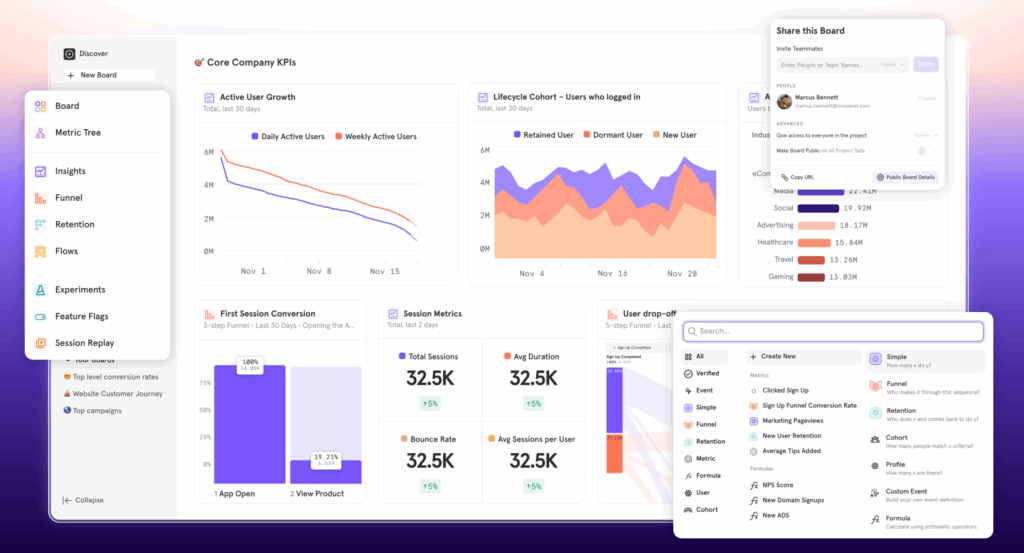
It’s easy to visualize user flows—the individual steps in a funnel—with Mixpanel, too. Everything gets delivered in a tidy report, including:
- Insights reports for tracking trends and breakdowns
- Funnel reports for visualizing drop-offs and conversions
- Flows reports for seeing how users interact with individual steps in the user journey
- Retention reports to measure how frequently users return
- Custom metrics and behavior reports to analyze whatever actions you want
You get the idea. Just about any way you want to see and slice the data, Mixpanel can do it.
Amplitude
Unlike Mixpanel, Amplitude’s reporting and analytics tools are template-based. To look at a specific piece of your data, you have to pick the right chart type.
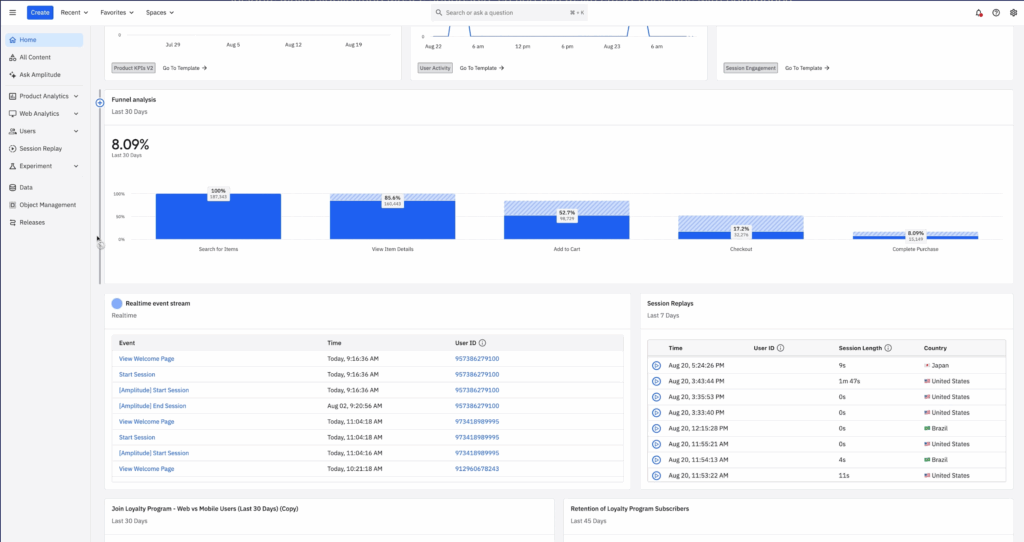
For example, if you want to get an overview of a specific funnel, you must build a chart that tracks the events in that funnel.
This isn’t a bad thing, as you’ve got plenty of flexibility for what you do and don’t want to track. But it does mean you need to be familiar with:
- Identifying funnel events. Decide which user actions should make up your funnel. For a simple checkout funnel, you might include: View item, Add to Cart, Checkout, and Purchase Confirmation.
- Designing funnels. Know how to use conversion logic and event ordering, and set up conversion windows—Amplitude allows windows from 1 second up to 90 days.
- Discovering/knowing which paths to track. Amplitude does make this easy with features like Pathfinder, which helps you see the most common event paths, and Compass, which identifies the events that have the most impact on user retention.
- Analyzing sequences. Check what your users do right before or right after a certain action by building flows that start or end with that event.
- Interpret results. Analyze the chart and understand where users drop off, how long they take to convert, and which segments perform better.
It’s not rocket science to set up charts, but it does take a bit of upfront learning.
The good thing is that Amplitude makes it easy to closely inspect data points across all your charts with its Microscope feature.
In other words, you can hover over a common drop-off point in a funnel, and you’ll get detailed information about the users who aren’t converting.
2. A/B Testing and Optimization
Mixpanel
Mixpanel does support basic A/B testing—especially for mobile app features. But this isn’t a strong focus.
More often than not, Mixpanel is used to analyze the results of split tests conducted through dedicated experimentation platforms.
Importantly, A/B testing is only available on Mixpanel’s (probably expensive) enterprise plan.
Here’s what you can do with Mixpanel:
- Create a custom experiment and define the control and variant groups by specific filters
- Define a custom audience to represent both the control and variant groups
- Select a range of time for the test to run
- Run the test and use Mixpanel’s reporting dashboard to analyze the results
Again, you can only use these A/B testing features with Mixpanel’s enterprise pricing tier. That said, Mixpanel does integrate with AB Tasty and other dedicated testing tools.
Amplitude
Unlike Mixpanel, Amplitude does offer robust A/B/n testing—with a holistic angle that I appreciate. Before you start an experiment, Amplitude gives you the opportunity to define the context for the test.
You can include a:
- Problem statement. What’s the problem you’re trying to solve with this test? E.g., How can we prevent younger users (20-35) from dropping off after we request email addresses to unlock restaurant reviews?
- Data. Do you have any supporting insights from Amplitude Analytics? If so, you can pull them into the context section of a test. Say you have a funnel chart that shows 75% of users aged 20-35 abandon the process at the email gate, compared to only 20% drop-off in users over 40. This would be the place to include it.
- Hypothesis. How do you believe you’ll solve the problem posed in the problem statement? You could say, by loosening the content gate for users between 20 and 35 years old.
- Success metric. This is where you create the metric you’ll track for a test—like Increase email submission rate among 20–35-year-old users or Decrease overall funnel drop-off at the email required step.
- Additional metrics. What secondary things could you monitor? Maybe retention rates for users who bypass the gate. Or the impact of the changes on your older user groups. Or the quality of the emails you collect—for example, are they real, active emails, or throwaway addresses?
You’ll then choose a control and variant version of the element you want to test, along with which segment you want to test it with. Amplitude does all the coding so you don’t have to.
I really appreciate this thorough, well-rounded approach to A/B testing. If you want even more ways to test, you can use Amplitude’s AB Tasty or Optimizely integrations.
3. User vs. Account-Level Analytics
Mixpanel
Mixpanel shines in both user-level and company/agency-level analytics. In other words, it’s ideal for both B2C and B2B brands that want to test their digital products.
With the Group Analytics add-on, you can organize data by groups—like company accounts. If your client base is primarily other companies, this is a big plus.
Plus, you can see all the key metrics for a specific group with the Company Profiles feature, which includes:
- KPIs on usage
- User engagement level (activity and life cycle per user)
- Retention (how often they log back on/come back to the product)
You can also break down account activity by the number of users (members) a company has. If Company A, B, and C all have 20+ users, they can be assessed in one segment. Companies D, E, and F—each with 2-5 users—could all go in another segment.
One downside is that you’ll need some coding knowledge to set up B2B and account-level dashboards the way you want them.
While this allows for more customization, it does make Mixpanel a bit less user-friendly than it could be. For someone with dyscalculia (me!), the group analytics instructional docs are nightmarish to read.
But the math-minded among us probably won’t have any issues.
I should also note that the group analytics features are only available as an add-on to the Enterprise or Growth plans.
The Growth plan is free for up to 1M monthly events—and free for startups for an entire year—so if you’re a B2B startup, Mixpanel’s an excellent choice for account-level analytics.
Amplitude
Like Mixpanel, Amplitude offers an account-level analysis add-on to help B2B companies analyze the relationship between their users (other companies) and their products.
But it’s referred to as “group behavior analysis” rather than account-level analytics. A group could be anything—not just a company.
This fits in with Amplitude’s trend of emphasizing groups that share characteristics over individual company accounts.
And unlike Mixpanel, Amplitude lacks a feature where you can store information and analytics for each company for easy tracking and testing.
It’s better for tracking individual users and cohorts (groups that share common characteristics or experiences within a specific time).
And with its more user-friendly interface (minimal coding required!), Amplitude is really more geared to B2C companies with fewer resources at hand.
4. Heatmaps and Session Replay
Mixpanel
Mixpanel offers meaty session replay and heatmap tools for iOS and Android apps, websites, and digital products.
Depending on which plan you choose, you get between 10K and 20K free replays a month. Heatmaps appear to be included in all plans, but keep in mind that heatmaps—and session replays—are relatively new tools in the Mixpanel suite.
These tools are an effortless part of Mixpanel’s analytics platform, and you can switch in between reports, heatmaps, and replays with ease.
Mixpanel lets you filter heatmaps and replays by events, cohorts, and custom properties so you don’t have to comb through millions of replays for the data you want.
From a UX standpoint, I like that when you hover over a specific area of a heatmap, you can see a full breakdown of data, including the events, users, and replays tied to those clicks.
I also appreciate that Mixpanel’s heatmaps and replays aren’t so much two separate features as they are complementary tools. They inform each other, contributing seamlessly to the insights you need to gain when it comes to your users.
I do wish Mixpanel had more types of heatmaps, though. It’s limited to click maps—for now.
Mixpanel assures user privacy by automatically masking all text, inputs, and images. Replays store for 30 days by default and are completely deleted once they expire.
If you want to keep them around for longer, you’ll have to pay for an enterprise plan with an additional, paid session replay add-on.
With this add-on, you can retain replays for anywhere between 7 and 360 days.
Amplitude
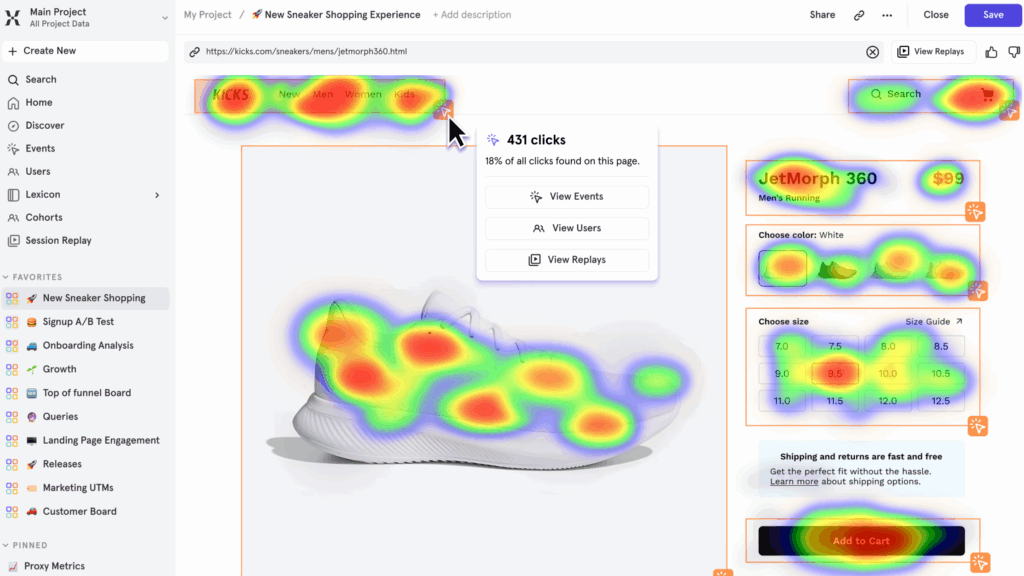
Amplitude’s heatmaps and replay tools offer just about the same thing as Mixpanel’s do—and just a little bit more.
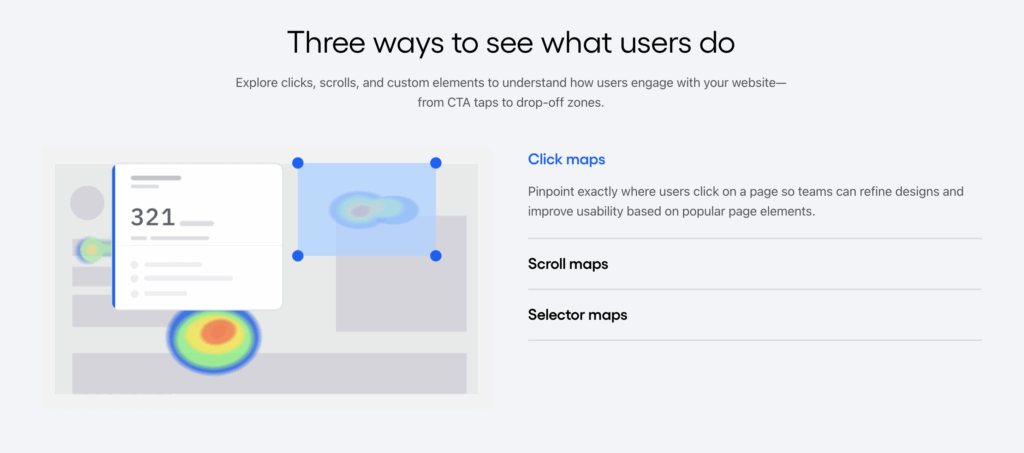
You get three types of heatmaps with Amplitude:
- Click maps—aka the classic heatmap that shows where users click on a page.
- Scroll maps—see how far your users scroll down on a page to pinpoint both engagement and drop-off points and adjust your content placement accordingly.
- Selector maps—select specific CTAs or buttons and visualize the taps, clicks, and interactions they’ve received.
This is more variety than you get with Mixpanel.
Plus, as with Mixpanel, Amplitude prioritizes combining heatmaps with session replays. This means you can quickly identify trends and patterns with the heatmaps tool and then open specific session replays tied to those trends. This gives you deep clarity into how or why someone does something.
Say a heatmap shows a ton of rage clicks on a Download PDF CTA button. You open a few session replays. In every single one, the PDF button fails to do…anything.
You quickly fix the button so it actually does what it’s supposed to, and voila! Future heatmaps and replays show no more rage clicks on that button.
Heatmaps also integrate seamlessly with Amplitude’s A/B testing, analytics, and audience mapping. You can build an audience segment straight from a heatmap to quickly run an experiment or send out a survey to see why users are frustrated.
Unfortunately, though, Amplitude’s heatmaps are only available on web and mobile web products—not on apps.
And while session replays are available on all four Amplitude plans, heatmaps aren’t available unless you buy a Growth or Enterprise plan.
Like Mixpanel, Amplitude automatically masks everything for utmost privacy.
Retention is limited to 1 month unless you pay for a Growth or Enterprise plan—in that case, you get up to 12 months.
5. Support
Mixpanel
With a free plan, you get access to Mixpanel’s Slack community and support docs, along with standard email-only support.
Growth plans get 24/5 support via email with a guaranteed response time between 24 and 48 hours, depending on urgency. Enterprise customers get 24/7 email support, plus a dedicated onboarding manager and account manager.
You can pay even more to get faster responses to your emails—the fastest is a 1-hour turnaround time. No live chat or phone support appears to be available, though, which is a big downside for a tool that’s fairly complex.
Amplitude
The free Starter plan offers only community (Slack and forum-based) and docs support. In other words, you’re on your own as far as the company is concerned. To be fair, though, the Starter plan is free forever.
The Plus plan gets you online support, and the Growth plan buys you online support with a 2-business-day turnaround time.
With Enterprise, you get a dedicated customer success team and account manager to help you with every need, plus an email turnaround time of one business day.
Pricing Breakdown: Which Has the Best Value?
Here’s how the pricing breaks down for Mixpanel’s plans vs. Amplitude’s plans.
| Plan | Mixpanel | Amplitude |
|---|---|---|
| Free | Up to 1M monthly events 5 saved reports 10K session replays | Free core analytics Limits on monthly tracked users (MTUs) & retention |
| Mid-Tier | Usage-based Unlimited reports 20K session replays | $49/mo Scales by MTUs Adds cohorts & custom events |
| Enterprise | Custom pricing Large event volumes Advanced features & support | Custom pricing Advanced features, permissions, multi-product |
| Best Fit | ✅ Best if you track lots of events (pricing by event volume) | ✅ Best if you care about active users (pricing by MTUs) |
Both Mixpanel and Amplitude offer similar value—they both have free plans with fairly generous limits, affordable mid-tier plans, and presumably expensive enterprise plans.
It really boils down to two things:
- Which tool has the best features for your business
- Whether you want to base your pricing on event volume or monthly tracked users
Otherwise, they’re fairly similar in value.
Final Verdict: Is Mixpanel or Amplitude Right for You?
Mixpanel is best if you want detailed funnels, retention reports, and account-level analytics, especially if you track lots of events and care the most about B2B use cases.
Amplitude is best if you want powerful A/B/n testing and engagement insights, particularly if you care about active users (over accounts or events) and want flexible, chart-based analysis.
Need more choices? Check out our top Amplitude alternatives for inspo. Psst…Crazy Egg is one of them!