The sheer amount of data associated with an ecommerce store can be highly intimidating, but its collection and analysis are also vital for any ecommerce business owner to stay profitable, growth-oriented, and competitive in the long run.
Still, knowing exactly what data to collect, when to collect it, and how to interpret it is just the start of making ecommerce analytics more digestible. Over time, the more comfortable you are with different types of ecommerce data, the more proficient you’ll be at making analytics-based decisions that can drive your business forward.
The Best Data to Collect For Ecommerce Analytics
Data analytics is the systematic process of extracting, processing, and analyzing a given set of metrics and statistics. For ecommerce stores, it’s one of the most important tools for understanding and reacting to online customer behavior, and it can be the difference between sinking or swimming in their respective markets.
For instance, a well-founded data analysis can help your business identify key bottlenecks in your daily operations. If you find these early enough, you can tweak your strategies in order to face any upcoming turbulent market forces head-on.
In ecommerce analytics, the best data to collect is the one that answers the following questions:
- Who are my customers and what do they do on my site?
- Am I making money?
- Is my marketing working?
1. Who are my customers and what do they do on my site?
If you aren’t sure why you need to collect data on your current visitors and future customers, consider your organization’s overarching goals.
Are you looking to increase your customer base within a certain demographic? Are you looking to improve conversion rates on your main landing pages? All of the above?
In short, you need to know who your customers are and how they behave on your site so that you can optimize your marketing pitches, sales strategies, and conversion funnels. This optimization will make the journey from signing up to purchasing a product straightforward and easy to interpret—both for the customer and for your analysis.
While customer data starts with demographics, it involves a lot more than just numbers in a spreadsheet. Here’s a rundown of the most important customer data to collect.
Customer segments
Customer segmentation refers to the specific groups in your existing customer base, typically divided by a common feature or trait. The goal of segmentation is to develop more effective marketing approaches for each particular group.
In B2B segmentation, you should consider grouping your clients by categories like industry, previous product purchases, location, and the number of employees.
In B2C segmentation, pay special attention to customer details such as age, gender, marital status, living location, income level, and life stage.
Some data may be relatively easy to obtain, but other information may require additional steps. That said, you may want to follow the ecommerce best practices by incorporating data-gathering techniques like online surveys, phone interviews, focus groups, online analytics, in-person interviews, sign-up forms, and customer reviews.
Customer actions
The first place you’ll want to look for patterns in your demographic data is in the activities that users do once they land on your site. For example, you can learn a lot about a given customer segment by checking the pages they visit the most, and, consequently, the pages they visit the least.
Similarly, if a great deal of your customers are leaving your site after visiting one and only one page, then you can measure the bounce rate of your store.
Other actions to track include how many pages users view per visit, how much time they spend on your site, what their scrolling behavior is like, and which elements on a page they tend to click on the most.
Some of the most reliable ways to track customer actions include Google Analytics 4 (GA4), Google Search Console (GSC), scroll tracking, and click tracking.
Customer spending
Customer spend, consumer spending, or personal consumption expenditure is a complex analysis model that examines the spending patterns of customers in a particular market segment. When applied to online retail, this model shows which customers spend the most money, their average order value, and what items they buy when browsing your online store.
Understanding this behavior is important for predicting how a particular customer group might allocate their monthly budgets irrespective of their total income. For example, two families with similar incomes may have different priorities when it comes to their spending choices. One family might prioritize spending money on gym memberships, protein shakes, and healthy snacks, while another may spend its disposable income on concert tickets, traveling, and souvenirs.
Either way, understanding your customers’ buying preferences can help you develop more effective strategies and better optimize your marketing campaigns.
Repeat vs one-time customers
Repeat customer rate is the percentage of customers who make two or more purchases from the same business over any given period of time. In ecommerce, repeat customers are typically more valuable than one-time customers because they tend to make more expensive purchases and they may even sign up for premium-tier services.
To calculate your repeat customer rate, take the number of customers who’ve made a second purchase and divide that number by the total number of customers. For example, if you had a total of 100 customers in the past month, and 30 of them made a second (or third) purchase, your repeat customer rate would be 30%.
If necessary, you can calculate your repeat customer rate over shorter periods of time (such as a week or a 15-day period) as well as longer periods of time (such as a quarter, a year, or even several years) for a more comprehensive data analysis.
Customer acquisition
Depending on your starting point, customer acquisition refers to two main things: how people are finding your site and how well you’re turning them into customers.
This process can be facilitated via several different channels. In general, you need to consider how well your inbound and email marketing campaigns are doing, how good your brand’s reputation is, how your customer base finds organic growth, and how well your team is able to guide its new users through your sales funnel. If you have a customer relationship management (CRM) platform, this can help you track and nurture any new users that come in.
Customer satisfaction
The easiest way to measure customer satisfaction is by employing a standardized customer satisfaction scoring system (CSAT). CSAT can be obtained by posing a single, straightforward survey question to your customers after they make a purchase: “How happy were you with your product/service?”
Based on their answers, you can separate them into three groups: detractors, or those who voted 0-5 and aren’t happy with your product or service, passives, or those two who voted 6-8 and feel neutral or mildly positive about your product or service, and promoters, or the customers who voted 9-10 and are more than happy to recommend your product or service to their friends and families.
To calculate your average CSAT score, you need to divide the number of positive responses by the total number of customer responses and then multiply the result by 100. For instance, if you’re working with 100 responses, out of which 70 were positive, then your average CSAT score would be 70%.
Sales order pipeline
When the customer decides to buy something, they add it to their shopping cart. This marks the start of the sales order pipeline, which consists of three main phases:
- Shopping
- Checkout
- Order fulfillment
The shopping phase starts when a visitor adds an item to their cart. Typically, around 10% of all site visitors will create a cart and add one or more items to it. Keep in mind that anonymous visitors aren’t considered leads because you don’t have their contact information yet.
In the checkout phase, visitors enter their billing and delivery information, create an account (if necessary), and place their orders. At this point, the funds to make the purchase are reserved but not immediately transferred to your business account. The average conversion rate for ecommerce stores varies between 2-3%, meaning that up to 80% of visitors who add something to their shopping carts end up abandoning them.
If all purchased items are available, you can finish processing the customer’s payment and enter the fulfillment phase of the sales order pipeline. When the customer’s payment finally lands in your account, you can pack and ship the order to the customer’s delivery address. The average fulfillment rate ranges from 80-90%, meaning that up to 20% of orders have payments that don’t get approved for whatever reason.
2. Am I making money?
This type of data is pretty self-explanatory, but a growing number of online stores don’t pay as much attention to it as they should. Simply put, you want to know if your ecommerce store is making enough money to grow your business over the long haul.
The most important financial data to collect in this regard includes the following:
Total sales
Total sales is a key performance indicator (KPI) for almost all businesses because it helps determine the total revenue from units sold in a specific time period. You can calculate total sales in a day, a week, a month, or a full year. It’s also sometimes referred to as total revenue, and it’s good for approximating the viability of your ecommerce store.
To calculate your total sales, simply multiply the number of units sold by their sales price. For obvious reasons, total sales is one of the easiest KPIs to collect, but it’s also one of the toughest to improve. Factors like the cost of goods and services, inflation, discounts, asset depreciation, and refunds can all affect your top and bottom line.
The safest and most straightforward way to improve your total sales is to raise customer satisfaction and create a loyal group of repeat customers. A satisfied client will be more likely to recommend your business in the future, thereby increasing your chances of landing new customers.
Sales channels
Sales channels are the routes and locations (both online and off) that ecommerce stores use to reach their target audience and sell their products. They are like the veins and arteries of an online store, enabling your business to expand its presence beyond its initial reach and target different audiences through multichannel sales.
These include:
- Direct-to-consumer (DTC) locations, like a branded ecommerce website
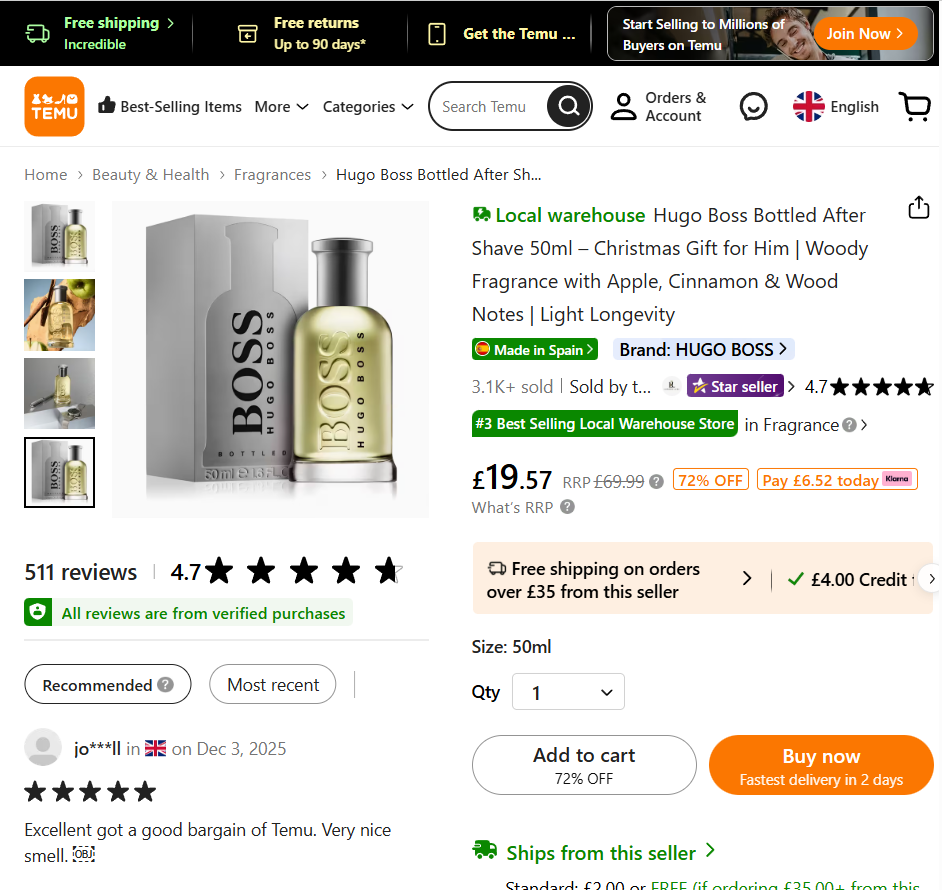
- Online marketplaces like Amazon, eBay, and Etsy
- Social media like TikTok, Pinterest, and Instagram
- Dropshipping channels like Wayfair, Oberlo, and Modalyst
- Product and price comparison sites like Shopzilla, ShopMania, and Become
Keep in mind that you don’t have to build a presence in all of these places to be successful. In fact, the most important question you need to ask is: Which channels are driving the most sales? Once you identify these sales channels, double down on them and cut the channels that aren’t contributing as much to your total revenue.
Return on investment (ROI)
In ecommerce, return on investment (ROI) is a key metric that indicates the health and profitability of your business. Specifically, it shows the amount of profit you have achieved as a direct result of your promotional efforts and other marketing activities.
Before calculating ROI, you need to specify the online channels you want to include in your report. These can include social media, email marketing, content marketing, paid ads, and organic traffic. Then, subtract your investment from the total income over a given time period and divide the result by the same investment you used before. Finally, multiply the result by 100 to get the final percentage.
If the ROI percentage is low, it means that your investment exceeded your profits. If the ROI is high, it indicates that you’re acquiring new leads at a relatively low cost. In other words, a high ROI means that your business is healthy and thriving, while a lower ROI suggests that your marketing activities aren’t working well enough to turn a profit.
Most and least popular products
Picking the right products to sell is crucial in growing and maintaining a sustainable online venture, but it’s not easy. As such, collecting this data often requires serious time and dedication to identify and test the type of products that your audience is willing to purchase without second-guessing.
You can start by identifying a novel, unsaturated niche using tools like Google Trends, Exploding Topics, or Answer the Public. These can give you a rough estimate of where the industry is heading and how to capitalize on current and upcoming trends.

For example, if you want to start catering to audiences interested in frugal or sustainable living, consider listing home improvement items made from eco-friendly materials such as reclaimed wood, recycled plastic, and organic cotton in your online shop. By focusing on selling innovative products made in a sustainable way, you increase the chances of organically attracting new customers. For obvious reasons, avoid listing products that aren’t selling well, as they might be of low quality, materials, or build.
3. Is my marketing working?
Although there’s probably a strong correlation between how much money your ecommerce store is making and the effectiveness of your marketing campaigns, that doesn’t mean there is causation.
For example, some factors like seasonality, word-of-mouth marketing, and even the occasional stroke of luck, may fall outside of your control. That’s why you need to measure the exact effectiveness of your marketing strategies that are aimed at getting people to visit your site and purchase your products.
Marketing channels
Typically, the most impactful marketing channels include digital ads, email marketing, influencer marketing, search engine optimization (SEO), social media marketing, traditional media marketing (like newspaper and TV ads), and inbound content marketing.
In some cases, the channels that bring you the most sales can be different from the channels that are bringing in the most customers to your site. For this reason, it’s advisable to keep separate accounts of the sales and marketing channels and treat them as two independent data points.
Web traffic sources
The two basic sources of website traffic are paid and organic.
Paid traffic occurs when visitors end up on your site after you’ve invested in a marketing campaign—including paid social media ads, pay-per-click (PPC) campaigns, banner ads, affiliate marketing, and native website advertising. Organic traffic occurs when visitors flow to your site on their own without being influenced by things like paid marketing campaigns and social media posts.
You can extract the bulk of this data from your preferred advertising platform in combination with Google Analytics 4, Google Search Console, and, in some cases, the analytics dashboard provided by your website’s host.

Conversion rates
Another important metric to consider is the conversion rate of your marketing campaigns, which measures the percentage of visitors who end up purchasing a product or taking a different action on your site. If your conversion rate is going up, it means that your marketing campaigns are working well. If you notice the same trend but in the opposite direction, then it’s time to tweak your campaigns or start new ones from scratch.
As a rule of thumb, an acceptable conversion rate is anywhere north of 5%, while anything below 2% should be considered an unsuccessful marketing campaign. These numbers may vary depending on your specific industry or business type.
Most and least popular content
Content performance analysis sheds light on the content your visitors are consuming the most and least, ultimately providing you with important guidance on how to proceed with new stuff moving forward. Creating an effective content strategy often takes a lot of time and effort, so you want to be positive that what you’re publishing is worthwhile—both for you and for your target audience.
Under the wider umbrella of content performance, the most impactful metrics to measure include page views, number of users, views per user, average engagement time, new users, and dwell time. You can measure these metrics via platforms like GA4, SEMRush, and Ahrefs.

Social media engagement rate and sentiment analysis
In social media marketing, engagement rates are determined by taking the total number of interactions a post receives, dividing it by the total number of followers, and multiplying the result by 100. This metric represents the average number of hits your social media content gets per single follower.
Additionally, you may also want to perform a social media sentiment analysis, which refers to the process of collecting people’s opinions and analyzing their emotions about how they interact with your brand on social media. The sentiment can be negative, neutral, or positive—but you can make use of it either way.
Returning visitors
When a new visitor lands on your site, they’re assigned a unique ID number in the GA4 dashboard. Thereafter, each time this visitor makes a subsequent visit, the hit counter for that ID increases by one. This allows you to sort visitors by a variety of data points such as new or returning visitors, the number of sessions, and session durations.
One caveat worth mentioning here is that an ID number is associated with each user device, so if the same person uses more than one device to interact with your site, it’ll show up as two different visitors in Google Analytics 4.
In any case, the importance of returning visitors can’t be overstated. They are crucial in growing your brand and improving your conversion rates. Plus, the browsing habits of returning visitors can tell you a lot about which pages are performing well and which ones need additional work.
Cost-per-click (CPC) for ads
Cost-per-click (CPC) is a type of advertising model that charges by the number of clicks, as opposed to cost-per-mille, which usually charges by the number of ad impressions regardless of user activity. In most cases, the terms cost-per-click (CPC) and pay-per-click (PPC) are interchangeable.
The ability to track CPC is usually housed in your advertising provider’s analytics dashboard. This tends to be different depending on the platform, your advertising plan, and your site. The most popular platform that offers CPC advertising is Google AdSense.
Recap
Although there’s a lot to cover, ecommerce analytics can be broken down into three overarching topics: customer-related data, financial data, and marketing-related data.
Each of these topics can be drawn out and investigated even further, giving you a more detailed look into the behavior of your customers, the financial performance of your ecommerce store, and the overall effectiveness of your marketing campaigns.
When you combine all three, you can identify what’s working and what needs to change in order to stay profitable, optimize sales, and facilitate long-term growth.