Need an analytics tool for your website or app? Amplitude is best for web-based and ecommerce teams, but PostHog is ideal for app developers and product engineers.
Let’s explore the pros and cons of both of these behavior analytics tools.
Amplitude vs. PostHog: A Quick Snapshot
TL;DR? Here are the highs and lows of both tools in a nutshell.
| Feature | Amplitude | PostHog |
|---|---|---|
| Product Analytics | ✅ Strong behavioral analysis ⚠️ Insight-focused rather than app-building focus | ✅ Analytics tied to shipping new features and products ⚠️ More technical than Amplitude |
| Funnels | ✅ Clear, visual funnels ⚠️ Analysis-first | ✅ Flexible funnel logic ⚠️ Less polished UI |
| User Journeys / Paths | ✅ Journeys for real user paths ✅ Visually pleasing charts/dashboards | ✅ User paths inform iteration ⚠️ Less visual/easy to digest |
| Retention | ✅ Long-term engagement focus | ✅ Post-release impact focus |
| Cohorts | ✅ Segmentation & analysis | ✅ Reused across flags & tests |
| Feature Flags | ⚠️ Via Experiments only | ✅ Core dev workflow |
| A/B Testing | ✅ Structured experiments | ✅ Flag-based, high control |
| Best For | Marketing & growth teams | Product & dev teams |
| Pricing | MTU-based, predictable | Usage-based, flexible |
Feature Breakdown: Amplitude vs. PostHog
1. Product Analytics
Amplitude
Amplitude’s product analysis features focus on helping teams gain a deep understanding of user behavior. Amplitude tracks exact user behaviors, like signing up for a newsletter or using a feature. It measures how often these events happen and in what order the users perform these key actions.
Instead of presenting these in a dense table packed with numbers, Amplitude showcases the insights visually in formats like funnels, graphs, and charts, color-coding and all.
Here’s a quick summary of what product analytics metrics Amplitude tracks:
- Events: user actions like clicks, views, and feature use
- Active users: daily, weekly, and monthly active users
- Conversion rates: percentage of users who move from one step to the next in a funnel
- Drop-off rates: where users abandon specific customer flows
- Retention: how often users come back over time
- Engagement frequency: how often key actions are taken
- Stickiness: how regularly users are active
These metrics help brands understand what users are doing on their website and app—and help them pinpoint problem areas that need work.
Unlike PostHog with its product-dev heavy focus, Amplitude primarily uses the metrics above for insight and analysis. There’s less of a focus on iterating a software product and more of a focus on understanding user behavior and trying to optimize a website for that behavior.
PostHog
PostHog’s product analytics features are focused on helping teams—especially teams made up of engineers, specifically—track and decode user behavior. It brings user data, product-improving tools, and analysis together in one place.
Teams don’t have to leave the platform in order to roll out changes because they can analyze behavior and ship updates from one place: PostHog.
Like Amplitude, PostHog measures events, active users, conversion rates, drop-off rates, retention, feature usage, and stickiness. But PostHog focuses on tying these metrics to experimentation, feature flags, and fast iteration—all of which are crucial when you’re building and maintaining a SaaS product.
2. Funnels and User Journey Mapping
Amplitude
Amplitude’s funnel analysis tool helps you see how users move through a series of steps, which you must pre-define.
This could be the process of landing on your site for the first time, clicking a CTA, and signing up for a free trial. Or it could be visiting a product page, adding an item to the cart, and checking out.
All you have to do is define the sequence of events that you want to measure and tell Amplitude what order the steps should be completed in to count as a conversion. Amplitude will then count all the users who move through the funnel in the right order.
Or, you can track any steps they take toward conversion.
Either way, you’ll be able to see how many users complete each step and where folks drop off. And if people aren’t following your ideal funnel sequence, you might have some tweaking to do on your site.
With Funnels on Amplitude, you can gain a deeper understanding of whether your ideal flows are actually working. If they aren’t, you’ll know—and you can fix them.
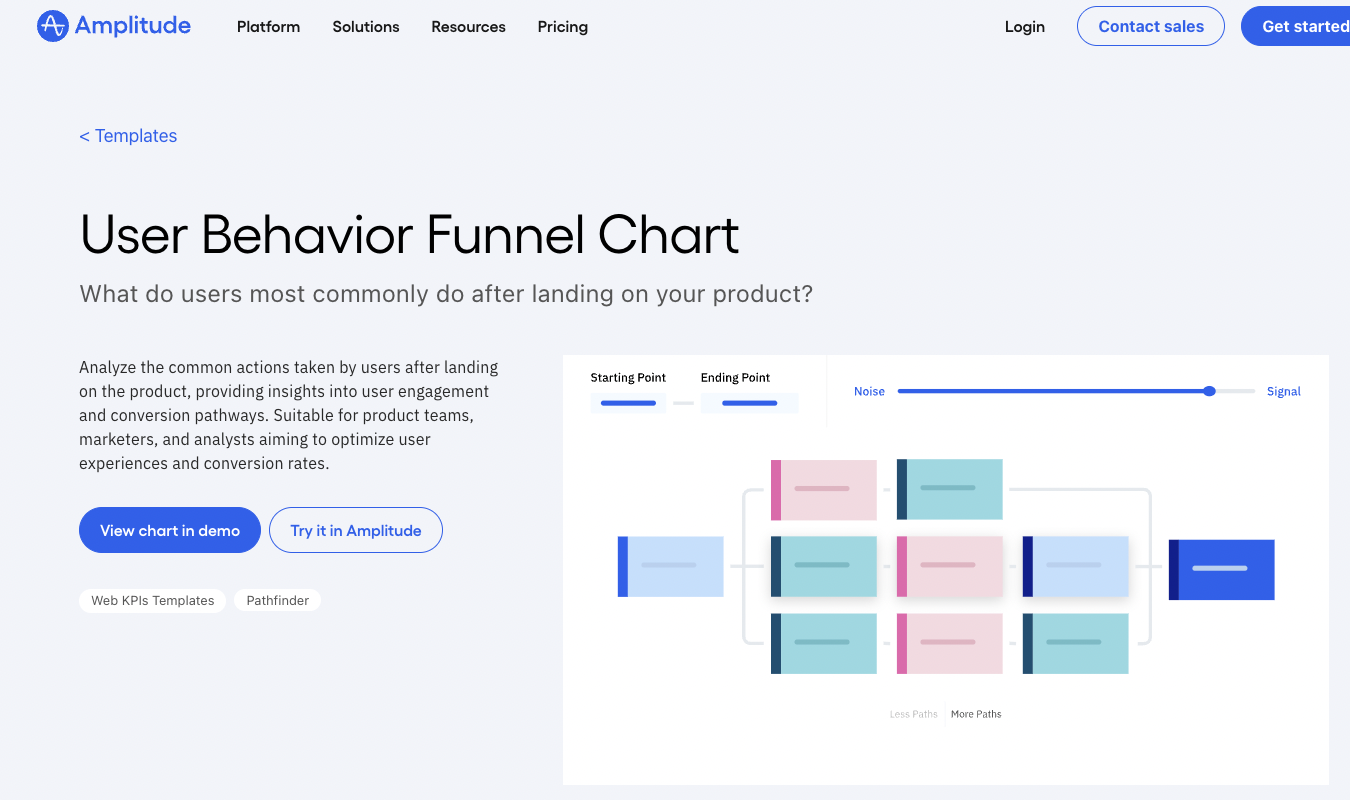
Plus, Amplitude offers a tool called Journeys, which lets you see the actual path users take on the customer journey—not just the predefined one you laid out for a Funnels chart. This can help you adjust your conversion funnels to reflect reality.
PostHog
PostHog’s Funnels feature measures how your users move through a sequence of events—much like Amplitude’s does. You can set PostHog to track funnels in a strict, sequential, or random step order.
You’ll also get the following:
- Analysis of how long users take to convert
- Summary of the user actions and attributes most closely tied to conversion and drop-off
- Breakdown of results according to user or event characteristics.
This information is crucial when you’re trying to problem-solve your app and make continuous improvements.
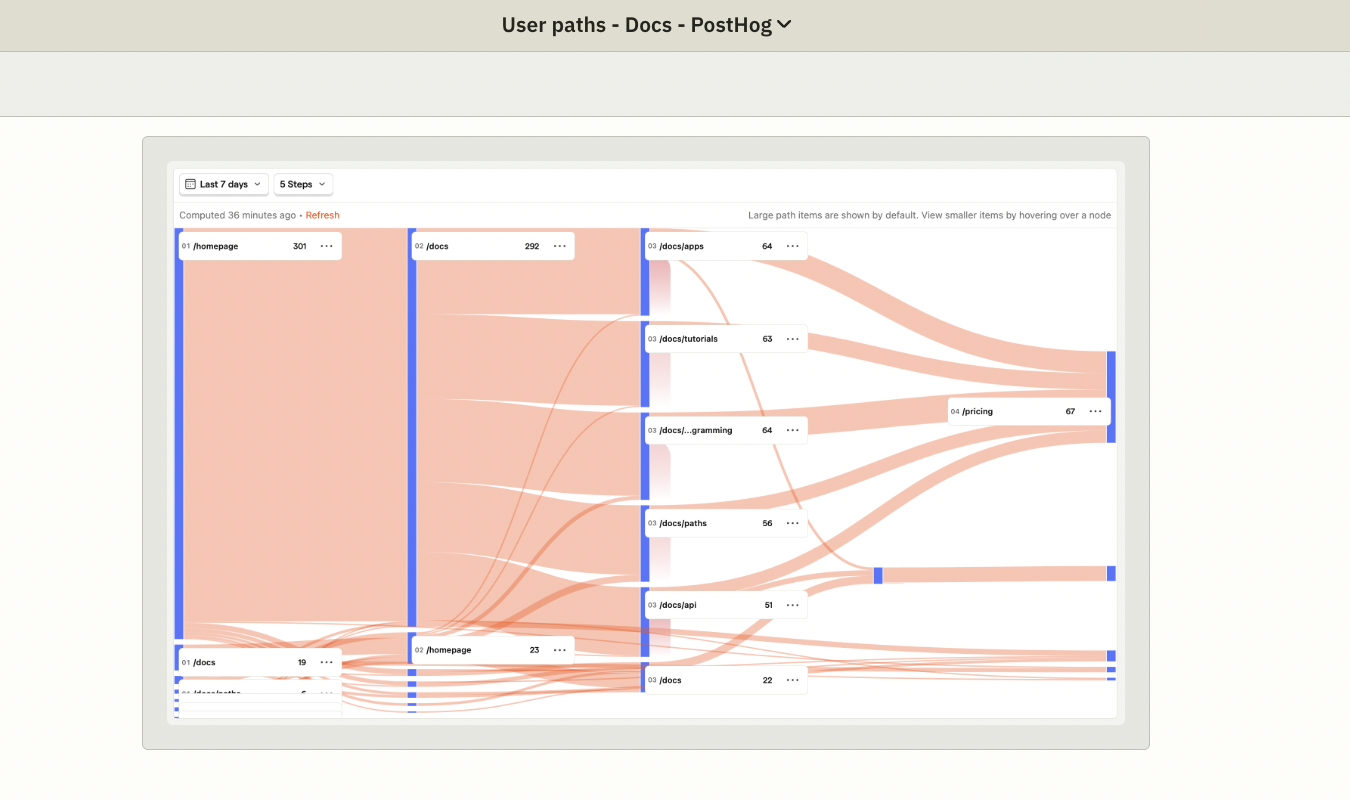
PostHog also offers a separate User Paths tool that shows you the different journeys users take on your product. Unlike in the Funnels feature, you’re not tracking progress toward a conversion with User Paths.
You’re just studying the different sequences users take—which can then inform your funnels. The charts PostHog generates are fine, but they aren’t quite as visually appealing and accessible to non-engineering brains as they could be.
PostHog’s funnels are closely tied to its feature flag and experimentation tools, which makes it ideal for continuously updating, testing, and improving a product.
3. Retention and Cohort Analysis
Amplitude
Amplitude’s retention analysis helps teams understand how often users come back after performing a specific action.
You can define a starting event—like signing up for a free trial or using a feature for the first time—and then define a return event, like using another feature or progressing from a free trial to a paid plan.
Amplitude will show you how many users come back over time—daily, weekly, and monthly. There’s some flexibility here, too.
Cohort analysis builds on retention analysis by grouping users who share common characteristics or behaviors.
So if you have a group of people that comes back and uses your features regularly after that first use, you can organize them into a cohort. If you have a group that drops off after the free trial, you can organize them into a cohort and strategize ways to win them back.
Together, these Amplitude tools help you analyze engagement, segment users in ways that are helpful for your product dev and marketing efforts, and strengthen long-term customer acquisition and retention.
PostHog
In PostHog, you can group users by specific actions or characteristics that they share. What’s neat about PostHog is that you can use and reuse them across all of PostHog’s features, including things like feature flags and A/B tests.
This is less central in Amplitude, where cohorts and retention are geared more toward helping you improve long-term engagement patterns. PostHog’s focus is heavily bent toward helping your team carry out tightly controlled experiments and feature roll-outs.
In other words, PostHog’s retention and cohorts tools are made to help teams see how their changes affect actual usage right after release. That way, you can see if Update 4.9.2.0, or what have you, is positively or negatively affecting user behavior.
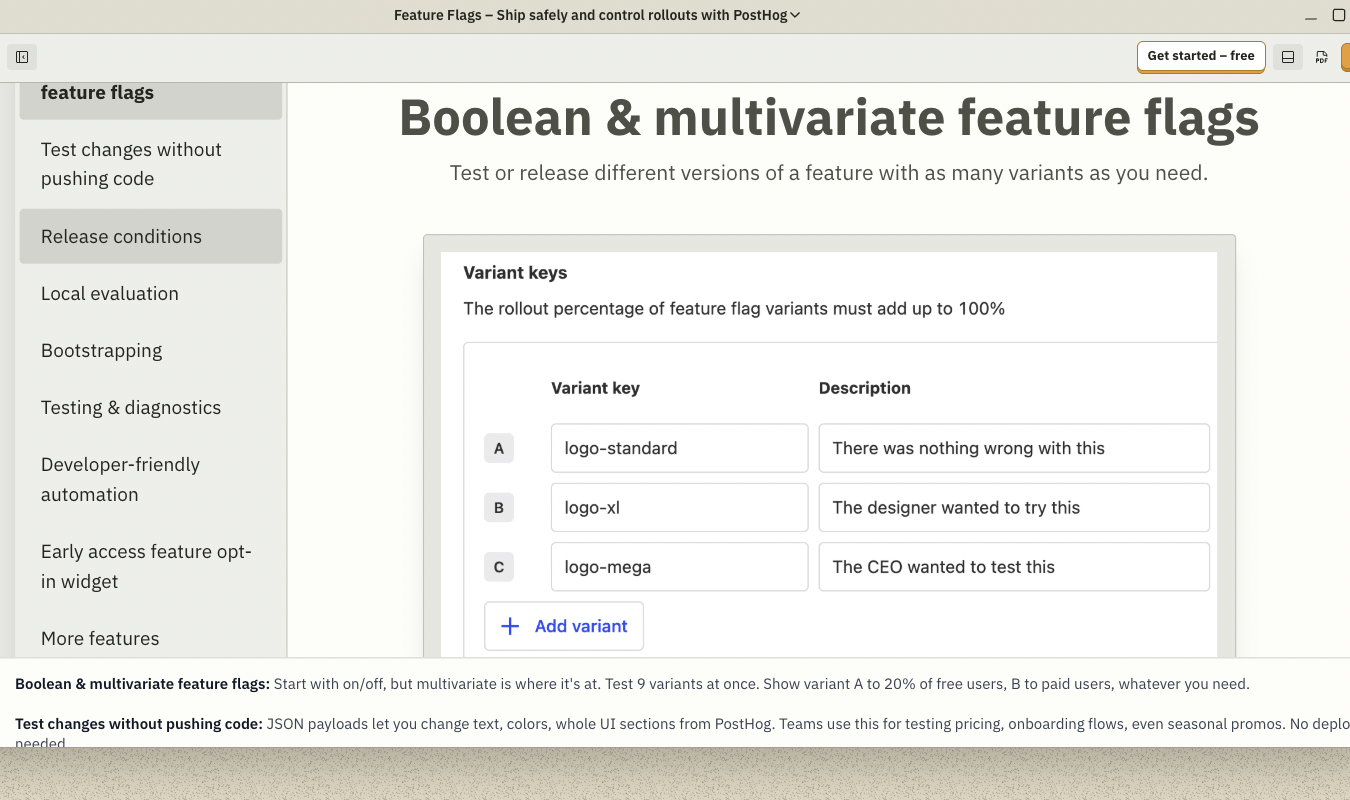
4. Feature Flags
Amplitude
Amplitude does support feature flags and controlled product and web rollouts through its Experiment tool. Feature flags are tools that control who gets access to new functions in your app or website so you can test and iterate before putting it out to everyone.
Your team can focus on specific flags and experiments and study how these changes affect the behavior of different user groups (segments).
In short, Amplitude’s feature flags are ideal for measuring conversion, drop-off rates, and long-term user engagement. I’d use Amplitude if I were a marketer at an ecommerce brand working to improve my company’s pricing strategy, checkout flows, onboarding, and messaging.
PostHog, on the other hand, is usually a better fit for app development teams. Instead of only offering feature flags through another tool, which is what Amplitude does, they’re offered as a core feature.
PostHog
If you’re in a field where the app is the product, instead of a vehicle to drive users to the product, PostHog is probably a better fit. It just has an overall more developer and engineer-focused interface.
Feature flags are a core feature that’s also baked into the product development workflow on PostHog. Because they work in tight connection to PostHog’s other analytics features, including cohorts and experiments, they’re easier to use frequently as part of your team’s everyday development.
And most product development teams use feature flags all the time.
Want to update your internal app’s messaging functionality? Test changes with a feature flag.
Want to add a new tool to your SaaS product? Beta test it with a feature flag.
Want to see if a change actually improves usage? Roll it out with a cohort of users and measure how well it works with a feature flag and A/B test.
Feature flags also make it easy to roll a change back quickly if everyone hates it or if it doesn’t work the way you expected.
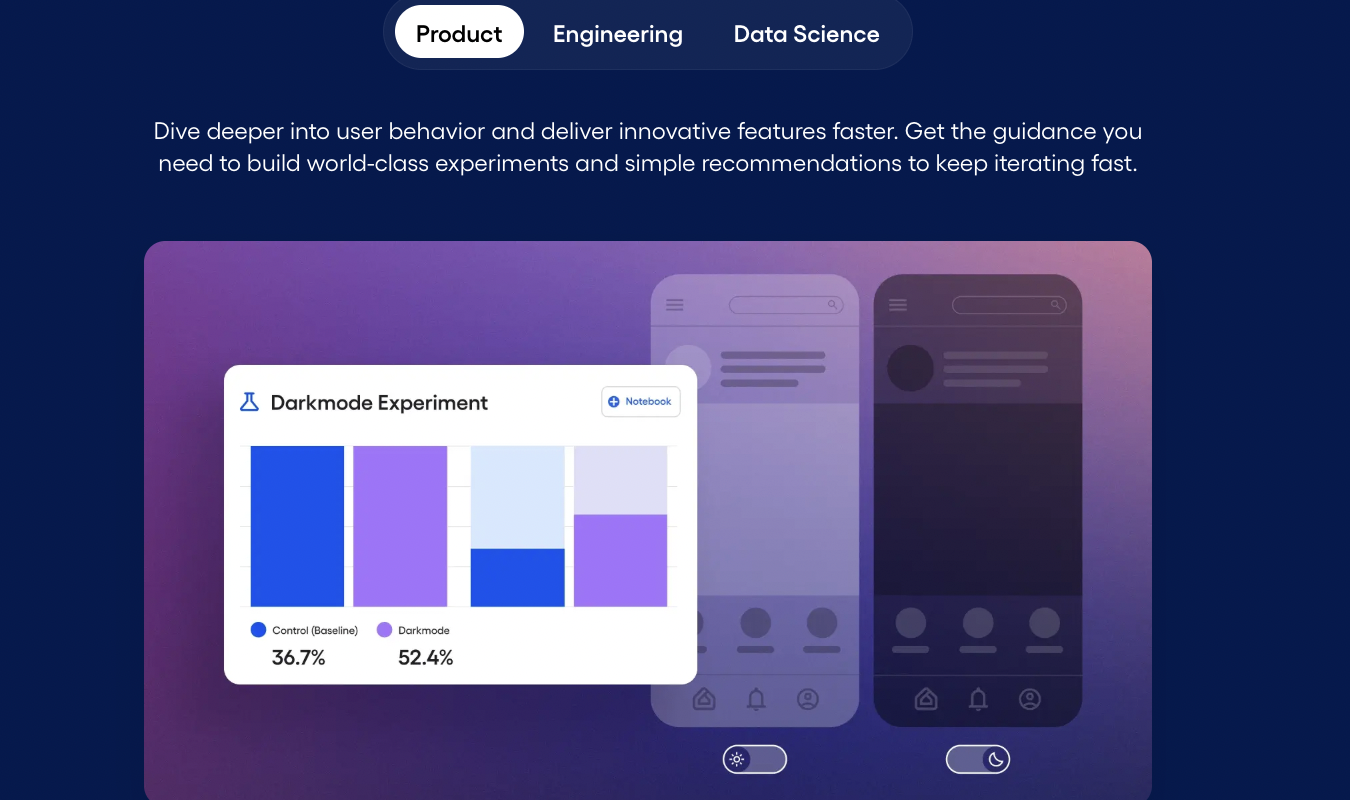
5. A/B Testing and Experimentation
Amplitude
You can run A/B tests and other split tests using Amplitude’s Experiment tool. I like that you can create experiments in two main ways:
- Feature Experiments. Use Amplitude’s feature flags tool to show users different variants of a product experience on your app or web-based software.
- Web Experiments. Use Amplitude’s visual web editor to create variations of your website content without changing the code to see which changes perform better.
In both cases, the idea is to help you test whether the changes you make actually improve onboarding, conversion, and engagement among users. I appreciate that even though Amplitude is not as engineering-focused as PostHog, the brand is clearly working to stay competitive with offerings that target both websites and apps.
PostHog
PostHog’s experimentation tools let teams run A/B tests and other experiments to measure how changes impact user behavior.
The basic workflow goes like this:
- You create an experiment and give it a name and a feature flag key. The flag is used to assign the app users to different variants—usually a control and one or more test variants.
- Each experiment is backed by a feature flag. PostHog automatically splits participants across different variants, unless you define custom conditions to override this.
- After creating an experiment, you can add logic to serve users different experiences based on the assigned variant.
- PostHog captures events (actions) from users in each variant so it can calculate the results and help teams compare the outcomes—aka, how the variants affected conversion and engagement.
PostHog also supports multivariate testing by letting you add more than one variant to a feature flag.
As you can probably tell just from the rundown of how A/B testing works on PostHog, it takes more upfront work than Amplitude’s experimentation features do. But this also means teams get more control in how their experiments run—especially when it comes to testing complicated or foundational changes.
Pricing Breakdown: Which Has the Best Value?
Ready to see how Amplitude and PostHog compare as far as pricing goes?
Here’s a table with the key details.
| Amplitude | PostHog |
|---|---|
| Free plan with core product analytics, event tracking, and some (limited) experimentation features. | Free plan with generous event limits, analytics, feature flags, and experiments included. |
| Paid plans scale by monthly tracked users (MTUs). Costs grow as user counts do. | Paid plans scale by usage (events, replays, flags). You pay for what you use. |
| Pricing is predictable if your user growth is steady. Enterprise plans are custom-priced. | Pricing is flexible but can fluctuate with your traffic and feature usage. |
| Best value for structured analytics and experimentation, especially for e-commerce brands. | Best for hands-on product development, frequent releases, and constant/fast iteration. |
Amplitude’s pricing is a little more predictable, and if you want a tool that’s easier to use for marketing teams, rather than product dev teams, it’s a good deal.
PostHog is better if you’re building and shipping a product all the time and want analytics, feature flags, and experiments that recognize and make room for your team’s engineering prowess.
Final Verdict: Is Amplitude or PostHog Right for You?
If you’re a marketing, growth, or product team that wants a structured, predictable platform that’s easy to use without heavy engineering involvement, Amplitude is probably a better fit.
For product dev or engineering teams that need to build and ship software all the time, PostHog is the ideal choice.
Looking for other options? You might also want to explore tools that focus more heavily on session replay, web analytics, and surveying, like Crazy Egg. See how Crazy Egg stacks up to other PostHog alternatives or Amplitude alternatives.