Most website popup statistics roundups copy the same handful of numbers from each other, and few check whether those numbers still say what they originally said or whether the source actually exists.
This one does things differently: every stat here is traced back to its primary source and scrutinized for what it actually measures, so you don’t end up comparing apples to oranges.
The article covers conversion benchmarks by industry, trigger, timing, and design. It also explains what actually counts as a good rate, whether popups pay off once you look past the opt-in, and how to optimize your own.
Key Popup Stats: Overview
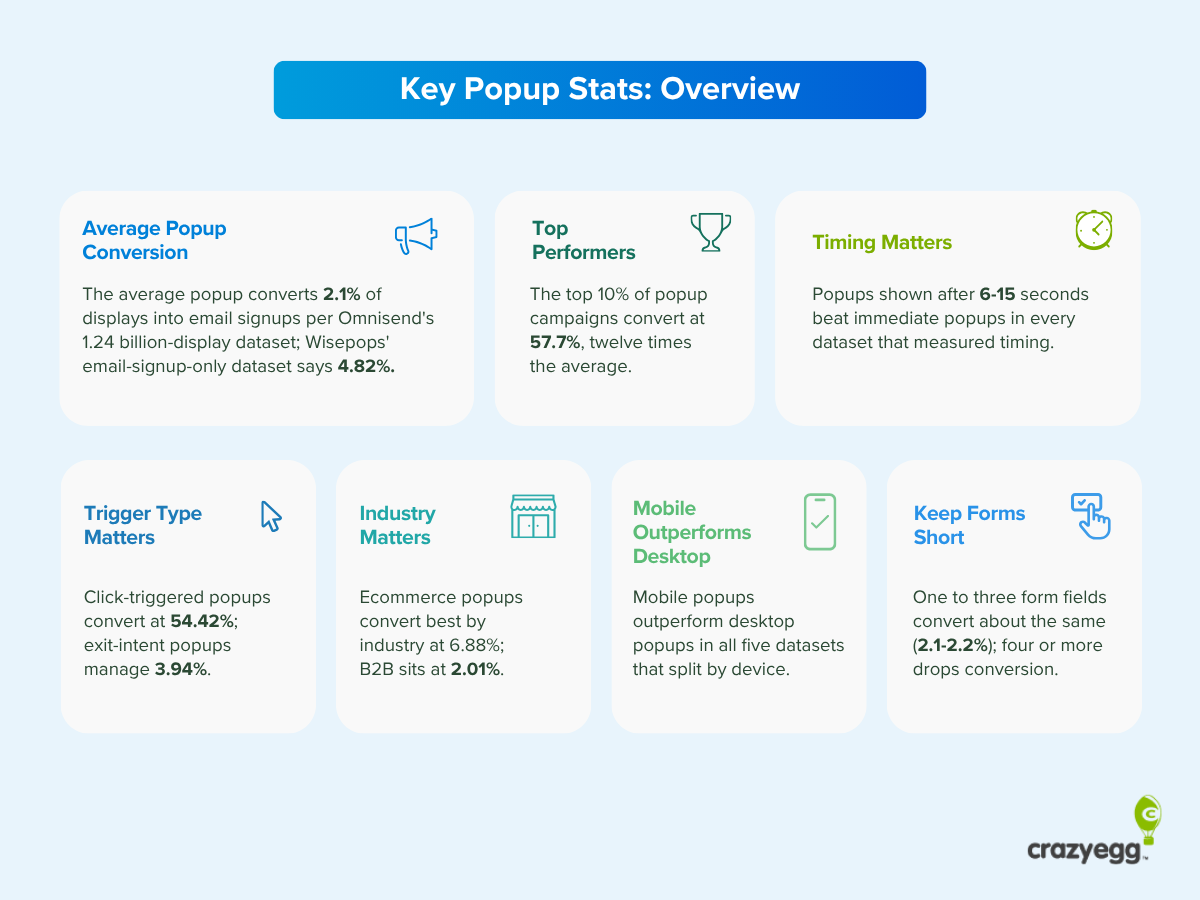
- The average popup converts 2.1% of displays into email signups per Omnisend’s 1.24 billion-display dataset; Wisepops’ email-signup-only dataset says 4.82%.
- The top 10% of popup campaigns convert at 57.7%, twelve times the average.
- Ecommerce popups convert best by industry at 6.88%; B2B sits at 2.01%.
- Click-triggered popups convert at 54.42%; exit-intent popups manage 3.94%.
- Popups shown after 6-15 seconds beat immediate popups in every dataset that measured timing.
- Mobile popups outperform desktop popups in all five datasets that split by device.
- One to three form fields convert about the same (2.1-2.2%); four or more drops conversion.
Average Email Popup Conversion Rate Statistics
The average email popup conversion rate is 0.25%-5%. This depends on the denominator and what counts as a conversion. If you count every display, you get low single digits. If you count only visitors who engaged with the popup, the number triples.
- Omnisend popups converted 2.1% of displays in 2025 (down from 2.3% in 2024) (Omnisend, 2026). Wisepops puts the average at 4.82% (up from 4.65% the year before (Wisepops, 2025). Both cover only email-signup popups and use displays as a denominator.
- In 2025, Popupsmart reported a 3.49% conversion rate, but its denominator was interactions. (Popupsmart, 2025).
- Popupsmart’s more recent analysis (May 2026) of 18,648 campaigns revealed a 0.52% per-display conversion rate, but this included other conversion goals, not just emails collected (Popupsmart community, 2026).
- Sleeknote’s analysis of 26,270 popup campaigns gave an average conversion rate of 4.13%. The figure blends all campaign conversion goals (email capture, free-trial starts, quiz completions) (Sleeknote, 2025).
- Claspo’s e-commerce data shows popups convert at 4.87% (Claspo, 2026).
- OptiMonk’s statistics page claims the highest average at 11.09%, but the page figure includes higher-converting formats and types, like cart abandonment popups. Email capture popups converted at a 5.10%-7.65% rate, depending on the lead magnet offered (OptiMonk, 2025).
- Klaviyo’s in-app benchmarks put the median popup and flyout submit rate at 2.3%, which is in line with the other figures. The data comes from its help-center documentation and doesn’t disclose the sample (Klaviyo).
What Counts as a Good Popup Conversion Rate
A good popup conversion rate falls in the 1.5-5% range. Top-performing campaigns sit far outside that scale, so consider them as an indication of what’s possible rather than benchmarks.
- According to Omnisend’s performance scale, the per-display popup conversion rate below 1.5% is underperforming, 1.5-3% is average, 3-5% is good, and 5%+ is excellent (Omnisend, 2026).
- The top 10% of Wisepops campaigns averaged a 57.7% conversion rate against the 4.82% overall average (Wisepops, 2025).
- OptiMonk reports its top 10% at 42.35%, with the same caveat as its average: it includes all kinds of website popups, not just email popups (OptiMonk, 2025).
- Top 10% of travel-industry promo popups reach 25.67%, against a 9.35% industry average (Claspo, 2026)
Popup Conversion Benchmarks by Industry and Type
E-commerce popups convert at more than 3x the rate of B2B, and cart abandonment popups outperform other types. Gamified popups convert 2-10x better than standard ones.
- E-commerce popups convert at 6.88%, media at 3.70%, education at 2.40%, and B2B at 2.01% (Wisepops, 2025).
- Cart abandonment popups lead OptiMonk’s table of high-converting popups at 17.12%, with conversational popups at 15.2%, feedback popups at 12.62%, and seasonal popups at 11.88% (OptiMonk, 2025).
- In Wisepop’s Shopify study, cart abandonment popups converted at a much lower rate of 4.27% across all campaigns, and 79% of recovered cart-popup orders came from mobile visitors (Wisepops, 2026).
- OptiMonk’s lucky wheels claim 13.23%, Sleeknote’s spin-to-win campaigns hit 8.67% against 3.70% for popups without spin-to-win (Sleeknote, 2025), and Omnisend’s Wheel of Fortune popups converted 3.5% against a 2.0% baseline (Omnisend, 2026).
- Popupsmart’s lottery-ball popups reached 7.40% on a small 54-campaign sample — small enough that Popupsmart itself flags survivorship bias in the number (Popupsmart community, 2026).
- According to Claspo’s own platform data, gamified signup forms convert at 9.18% against a 3.53% all-form average, roughly 2.6x (Claspo, 2026).
Popup Timing and Trigger Statistics
Popups delayed 6-10 seconds beat popups that fire immediately. Click-triggered popups convert more than 13x better than exit-intent popups.
- Popups delayed 6-10 seconds converted at 2.4%, the best bucket in Omnisend’s sample. Immediate popups (0-1 seconds) managed 1.9%, and everything past 30 seconds fell to 1.8-1.9% (Omnisend, 2026).
- Wisepops’ curve peaks slightly later: 6.45% at 11-15 seconds, against 4.16% for immediate popups, with a sharp drop past 16 seconds (Wisepops, 2026).
- Sleeknote’s own testing found timer-led triggers converting at 4.42%, beating scroll-based triggers at 2.64% — a 67% gap — with 6 seconds as the optimal delay (Sleeknote, 2025).
- Getsitecontrol’s own test data found immediate popups (under 2 seconds) converting at 4.01%, popups delayed 2-5 seconds dropping to 3.46%, and popups delayed past 5 seconds jumping to 5.26% (Getsitecontrol, 2024)
- Peer-reviewed eye-tracking showed popups delayed 20 seconds got significantly more fixation count and fixation length than popups shown immediately — and were rated less intrusive with a more positive advertising attitude (Hsieh et al., Behaviour & Information Technology, 2021).
- Click-triggered popups, where the visitor asks to see the offer, convert at 54.42%. AI-triggered popups reach 15.98%, hover triggers 13.05%, and scroll triggers 5.37% (Wisepops, 2025).
- A separate Wisepops study of Shopify cart-abandonment popups found AI-powered triggers converting at 6.88%, nearly 3x exit-intent’s 2.12% (Wisepops, 2026).
- Pageview-count popup triggers reached a 2.3% conversion rate (Omnisend, 2026), and Wisepops found popups delayed by two pageviews hit 9.84% (Wisepops, 2025).
- Exit-intent popups sit near the bottom: at 3.94% in Wisepops data (Wisepops, 2025) and 1.8% in Omnisend’s (Omnisend, 2026).
Popup Design Statistics: Fields, Images, Timers, and Discounts
Design levers — images and countdown timers especially — are where the datasets disagree the most. Multi-step popups consistently convert best.
- Fullscreen popups convert highest at 3.41%, ahead of modals at 2.95%, sidebars at 2.61%, sticky bars at 2.3%, and slide-ins at 2.17% (Getsitecontrol, 2024).
- Claspo’s data shows regular popups convert at 4.87%, floating boxes at 4.78%, built-in forms at 4.37%, and floating bars at 2.12% (Claspo, 2026).
- Popups with 1, 2, or 3 form fields all converted at 2.1-2.2% in Omnisend’s data. Increasing the number of input fields to four dropped the conversion rate to 1.5%, five or more to 1.4% (Omnisend, 2026).
- Wisepops reports 3-field forms convert at 7.86% and 2-field ones at 3.14%. (Wisepops, 2025)
- Adding a second “opt-out” button next to the main CTA lifted conversion 14.34%, from 7.04% to 8.05% (Getsitecontrol, 2024).
- Sleeknote found popups with images converting 4.05% against 0.66% without, a 513% gap (Sleeknote, 2025), while Wisepops reports a 43% advantage (5.71% vs 3.98%) (Wisepops, 2025).
- In the two biggest datasets, OptiMonk (2025) and Omnisend (2026), the differences were much smaller: 11.09% with images vs 11.08% without, and 2.2% with vs 2.1% without, respectively.
- OptiMonk reports popups with a countdown timer convert at 14.41% vs 9.86% without (OptiMonk 2025). Omnisend found the opposite: countdown popups converted at 1.9% against 2.1% without (Omnisend, 2026).
- Popup offers with a discount converted at 2.4% vs. 1.7% without, a 41% relative lift (Omnisend, 2026).
- Email popups with a lead magnet convert at 7.73% on mobile and 4.7% on desktop, against 3.83% and 1.84% without one (Getsitecontrol, 2024).
- Multi-step popups convert at 2.3% versus 2.0% for single-step, according to Omnisend (2026), and at 5.17% versus 4.62%, according to Wisepops (2025).
- Adding a mandatory consent checkbox cut Getsitecontrol’s email signup rate by 25.82% — a compliance cost, not a design choice (Getsitecontrol, 2024).
- Wisepops (2025) reports A/B-tested popups lifting click-through rates up to 26%, from 4.64% to 5.86% CTR. Omnisend’s dataset (2026) shows tested popups converting slightly lower than untested ones, 2.0% vs 2.1%.
Mobile Popup Statistics
Mobile popups outperform desktop ones in every dataset that splits by device.
- Wisepops: mobile users converted at 4.98%, while desktop users at 3.67%, so a 36% gap (Wisepops, 2025).
- Sleeknote: mobile devices 5.60% vs desktop 2.86%, though Sleeknote itself notes it targets different conversion goals by device (email signups on mobile, free-trial starts on desktop) (Sleeknote, 2025).
- OptiMonk: mobile 11.07% vs desktop 9.69% (OptiMonk, 2025).
- Getsitecontrol: a 10% click-through rate on mobile vs 7.09% on desktop (Getsitecontrol, 2024).
- Omnisend: desktop-only popups converted 1.4%, while popups shown on mobile or on both devices converted 2.2% (Omnisend, 2026).
Note: Google warns that intrusive interstitial page elements that “obstruct users’ view of the content” can hurt search performance (Google Search Central, updated 2025). So if you use popups on mobile, go for engagement-triggered popups or sticky bars rather than full-screen popups on page load.
Are popups still effective?
Conversion rates say popups are an effective lead gen and email marketing tool, but the business impact depends on your traffic volume, incentives you offer, and how they affect the user experience.
Datasets in this article put popup conversion within 2-5% average, with top performers reaching into the double digits. But the average conversion rate only measures the opt-in, not the outcome.
As a lead generation tool, a popup’s real return depends on what those email subscribers are worth downstream. At Wisepops’ 4.82% average and Klaviyo’s 0.16% placed-order rate for one-off campaigns, you need roughly 12,970 popup views to produce one sale. To produce one engaged reader for your newsletter, you need 1,230 views (at the same 4.82% popup conversion rate and Klaviyo’s 1.69% campaign click rate).
So whether the popups make a difference depends on your traffic volume.
Of course, some popups, like cart recovery ones, have higher conversion rates and they’re closer to money. Wisepops’ 2026 Shopify cart-popup study puts the median recovered order value at $98. That’s a lot, but the study says nothing about the incentive (read: discounts) needed to get them there, and we don’t know how many buyers would have returned anyway.
Finally, consider the impact on user experience.
Nielsen Norman Group (2021) found that stacked, competing popups leave users frustrated to the point that “every popup experience will degrade their opinion of your brand,” and Baymard Institute’s usability testing (2020) of 80 major ecommerce sites found users reflexively closing newsletter popups without reading them, some calling them outright “spam”.
The studies are 5+ years old, but I can’t imagine visitor attitude towards popups has changed for the better since then.
How To Optimize Your Popups For Higher Conversion Rates
Optimizing a popup’s conversion rate follows a three-step loop: measure, diagnose, test.
Step 1. Measure your baseline conversion rate
In your popup analytics, track the conversion rate (submissions ÷ displays), segmented by trigger, page, and device. As the above data shows, the conversion rates for segments vary dramatically.
Step 2. Analyze heatmaps and session recordings of the popup
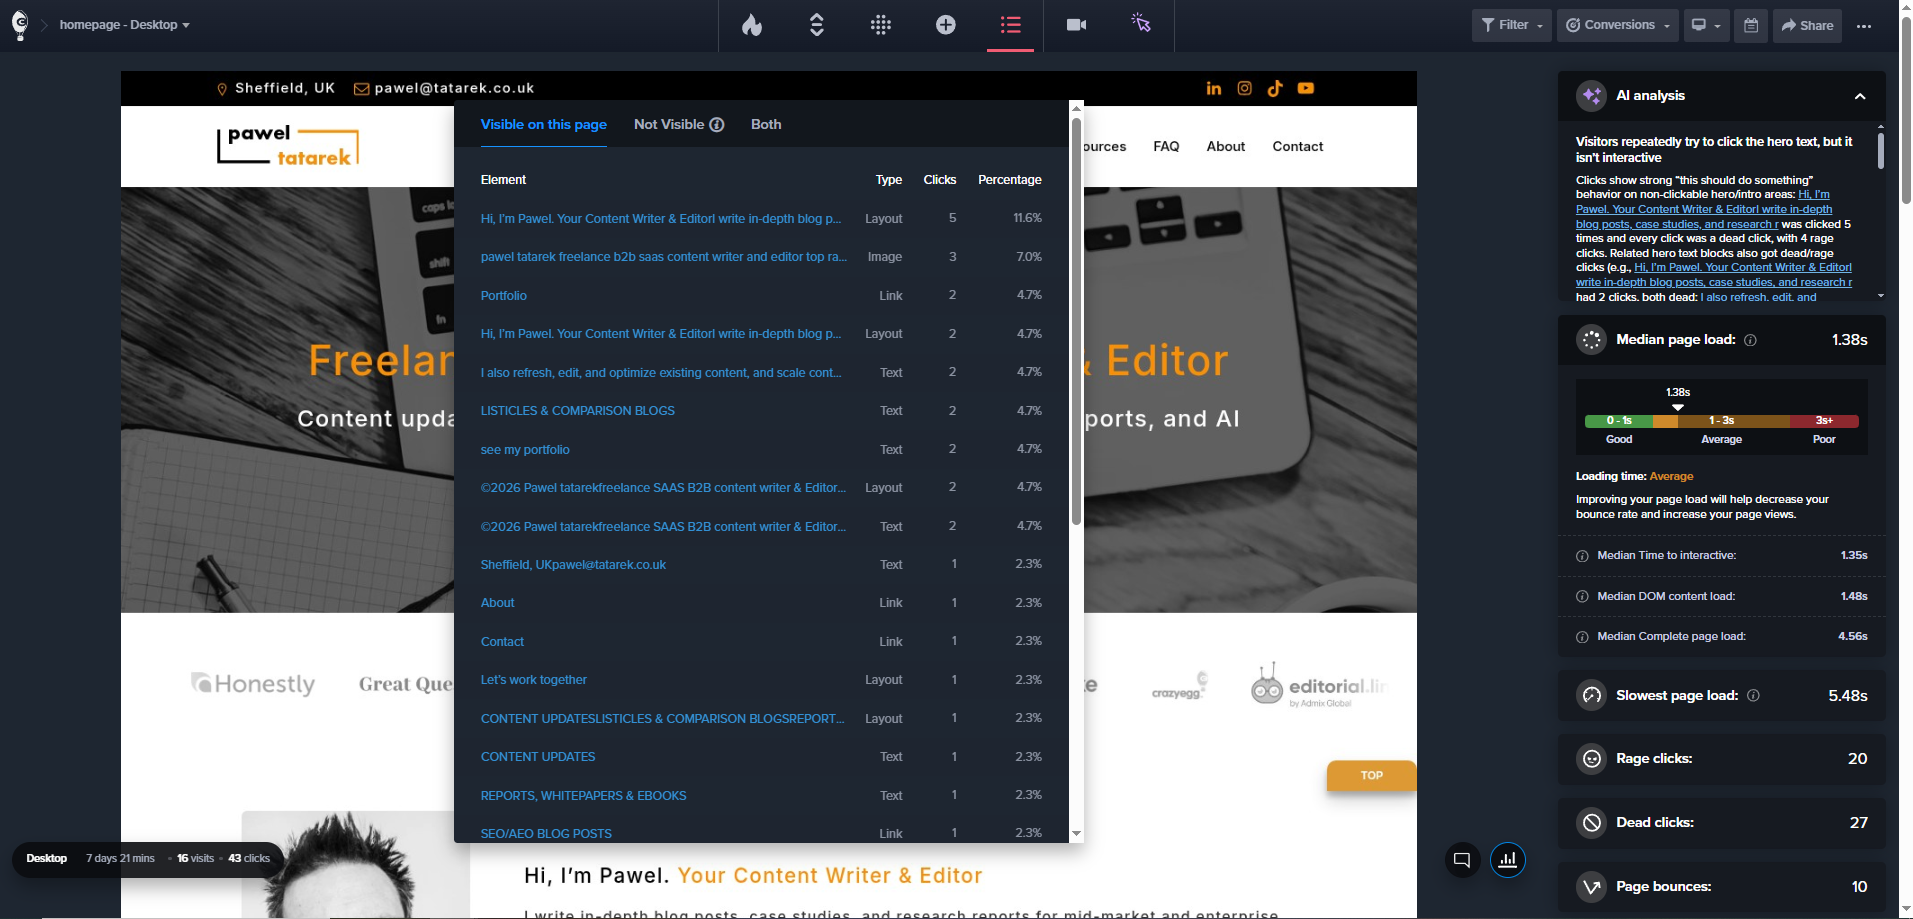
When you watch recordings and study heatmaps, focus on where people click and where the cursor hovers. Pay attention to frustration signals, like rage clicks around the close X button, and friction points, like dead clicks on unclickable elements.
Use what you see to build specific hypotheses. For example, if they dismiss it straightaway, the timing may be wrong. If they pay attention but don’t act, the message or incentive may not be appealing enough.
Step 3. A/B test one hypothesis at a time
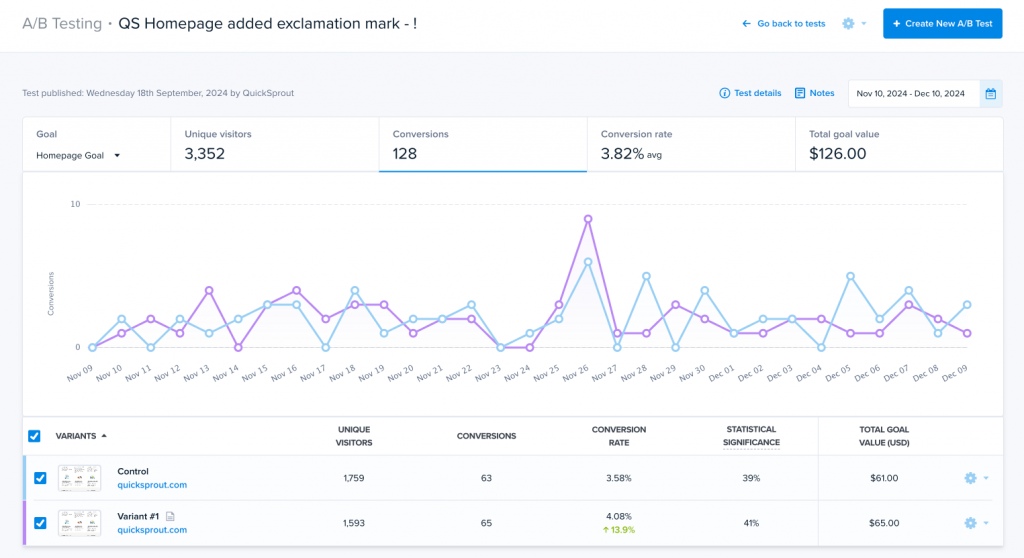
Create multiple popup variants based on your hypotheses and run them side by side to see which performs better. Unless your tool supports multivariate testing, test one variable at a time.
Popups usually get a smaller slice of traffic than a full-page test would. Only visitors who trigger the exit-intent or scroll threshold ever see it, so plan for a longer run to reach significance.
What These Numbers Tell You
Popups work — every dataset in this roundup shows real conversion. But the number that matters is what happens after the signup, not the signup itself.
To design a popup that actually converts:
- Trigger it on click or engagement, not a timer alone — click-triggered popups convert far above any passive trigger, including exit-intent.
- Delay it 6-15 seconds instead of firing the moment the page loads.
- Design mobile-first, but skip the full-screen takeover — an engagement-triggered popup or sticky bar captures the mobile advantage without Google’s interstitial penalty.
- Use a multi-step flow — the one design lever every dataset here agrees on.
- Keep fields to three or fewer, and treat images, countdown timers, and other decoration as things to test on your own site, not copy from someone else’s benchmark.
With Crazy Crazy, you can create popups without coding, fully customize their design and triggers, and target specific audience segments — without writing a line of code — and optimize their performance with analytics, heatmaps, session recordings, and A/B testing.
Book a personalized demo to see how Crazy Egg can help your brand optimize popup performance!
FAQs
What is a popup, and what’s it for?
A popup is an overlay that appears on top of a page’s normal content — a modal window, a slide-in, a full-screen takeover, or a sticky bar — usually asking the visitor to do something specific: sign up for an email list, claim a discount, finish an abandoned purchase, or respond to an offer.
The purpose is almost always conversion: capturing an email address, recovering a sale, or prompting one action before or during the visit.
Does an email popup increase bounce rate?
There’s no rigorous study directly measuring popup-caused bounce rate. However, it is possible under certain circumstances.
Independent UX research found users reflexively close and resent badly-timed popups, and data shows that immediate, page-load popups perform the worst. Low conversions don’t mean high bounce rates, but if a popup were to cause a bounce, this would be the exact kind of popup.
So to reduce the risk, delay the popup, or trigger it on engagement or exit-intent.