Imagine this: As the Chief Marketing Officer of your company, you are tasked to report on the annual marketing results by your CEO – and you have to be quick, direct, and efficient in communicating the whole to every stakeholder sitting at the meeting.
How do you do it?
This might not be a situation you’re too unfamiliar with.
There might not be stakeholders, you might not be a CMO – but you often find yourself in a position where you need to convey effectively the story behind your online marketing data.
And we know that online marketing data is not a piece of cake: aggregated in every kind of database, third-party app, CRM, Excel spreadsheet — you name it.
Considering that you have everything you need in terms of data collection, consolidation and management, the need arises to make sense of it all.
This is where data visualization steps in.
Hop on our innovative data visualization train and take a ride through the many different opportunities dataviz provides you with.
1. Why Data Visualization Is Important To Convey Your Message With Marketing Data
These days, we’re inundated with information. Everyone’s suffering from data overload, and many people feel like they’re drowning in information.
Compared to what people in the 1980s had to deal with, we receive 5 times more information – the equivalent of 174 newspapers per day.
It’s interesting how an intangible thing like “information” can have such a concrete and powerful impact on people.
Some neuroscientists explain that it’s because our brains were designed to cope with the amount of information we were receiving thousands of years ago in a world that was slower.
However, technology and innovation have developed too quickly for our brains to adapt.
The results are brain fatigue in the middle of the day and a general overwhelmed feeling.
When we take a closer look at our brain – the very one organ in charge of dealing with all that information – we see that it has a highly visual nature.
Indeed, 90% of the information transferred is visual. Likewise, studies show that people remember 80% of what they see and do, but only 30% what they read. Visuals are processed 60,000 times faster than text.
All of this has a simple, natural explanation: The eyes are like little cameras acting as a physical extension of our brain.
That same brain has half of its capacities dedicated to the visual function, directly or indirectly.
It turns out that we are designed in a way that makes dataviz a great strategy for marketers in general!

Marketing dashboards give you the capacity to understand and leverage the value of your data, which is an extraordinary asset!
As a marketer, you are manipulating thousands of data points every day. Opting for a visualization instead of a plain “reading” is more likely to have a stronger impact.
It’s also obviously easier to spot trends and patterns with a visual chart than with a spreadsheet.
They facilitate the recognition of relationships between various variables and let you see what would otherwise remain unearthed.
Finally, more of our brain is activated when we listen to stories. Providing a narrative when presenting your data will engage your audience all the more.
And this is how we bring data storytelling along data visualization – but for the moment, let’s focus on the visualization part and develop it.
Telling the story behind data relies on strong foundations – the data itself. It is important to understand and clean your data and to understand what you are trying to take away from it.
Let’s delve a little deeper into the mechanisms behind data visualization and the steps to prepare and produce a perfect, effective, and actionable dataviz.
2. How To Build A Data Visualization That Focuses On The Needs Of Your Audience
Knowing Your Audience
First and foremost, you need to define your audience: who are you creating your data visualization for? What kind of people or professionals are they, what do they do and what are they looking for?
Do not be exhaustive here: outline in detail who you will present it to and their goals.
The questions that your CEO asks and what she or he needs to know is drastically different to what your teams need to know, which is different to what a stakeholder wants to know.
Each and every member of your audience is looking to gain profit for himself or herself.
It’s important to put their goals first in order to meet their expectations, gain trust, and more practically, determine the line of your story.
Once you have answered these questions about your audience and spent some time in their shoes, think about the information they will need to meet their expectations.
Answering Their Needs
As a start, you need to select the right data.
Let’s say your audience is composed of investors or the CFOs of your company allocating budgets every year.
They will need to see metrics that will tell them if they invested in the right product, or if they allocate the right budget and that it generated profit. These metrics could be:
- Number of customers originated by marketing: it gives everyone an idea of how much of the customer base is driven by the marketing department. It’s important to underline this fact as marketing is not only limited to brand awareness, but also drive prospects to the sales department.
- Funnel conversion rate: it helps in understanding how effective your efforts in quality leads generation are and move them to the end of the funnel.
- Return on marketing investment: of course, the very one metric they want to see is how much profit is generated with each dollar spent.
Now, if your audience is composed of your team members who are focused on SEO activities, you want to display advanced Google Analytics dashboards or social media metrics.
It’s indeed crucial for them to see how their efforts are converting, and how they are performing. These metrics could be:
- Traffic Sources: Traffic is one of the most important measures of your website’s success. Understanding where your visitors are coming from and how is key to see if your focus your efforts on the right channel (organic, referral, paid, social, or direct).
- Page tracking: You want to show how your visitors are behaving on your pages. How long they stay before leaving (session duration), how many pages they see before leaving (average pages per session), or how high your bounce rate becomes. This helps you to identify the best converting landing pages for your different marketing campaigns.
Finally, if your audience is the top management of your company, you will not deep dive into details and specific metrics like the previous ones.
Providing a big picture of the performance and the strategy is recommended. Metrics displayed could be:
- Marketing spend evolution for different channels over the year, quarter or month, and how much revenue they have generated.
- Total marketing profit, and more specifically the profit per acquisition.
All these are simple examples and a non-exhaustive list of what you can use to answer the needs of your audience, depending on who they are.
Selecting the Right Data Visualization
We are getting to the purpose of that article. Now that the right metrics for the right audience are selected, you need to find a way to visualize them efficiently.
And this is where the problem often lies.
Keep in mind that different views answer different questions, and different charts tell different stories: you should choose them with care!
Let’s go through some examples to illustrate that:
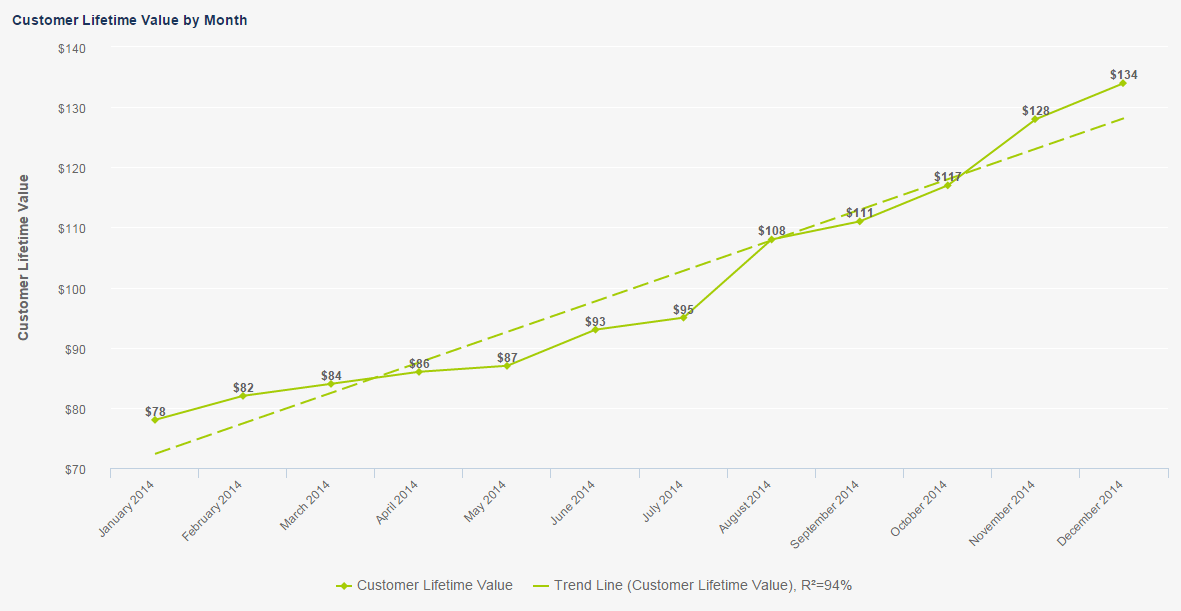
The line chart: shows an evolution, a trend, an acceleration, or the volatility of a variable. The line chart can be “turned” into an area chart if you decided to fill with color the area underneath the line.
These area charts can also be “stacked,” like stacked bar charts, which portray a part-to-whole relationship.
Tip: avoid piling up too many lines. That decreases comprehension. Likewise, stacking up or coloring areas that overlap each other will bring more confusion to the chart.

The bar chart: can be horizontal, vertical, or stacked. Like the line, it can show an evolution, but it’s more useful when you need to compare variables and rank them.
Tip: if you want to show an evolution, use a vertical (column) chart, as time is expressed from left to right. Horizontal will not work. Stacked charts are good to express a part-to-whole relationship.

The pie chart: the very infamous pie chart, used and abused over time. It became such a cliché that an app was even developed to generate memes of it.
But the pie chart can be pretty effective. For instance, to give a rough impression of a metric where the exact figure is not the most important, but the idea of the proportion is what matters.
For visualization, pie charts are actually pretty efficient as they give a direct view of a part-to-whole relationship. This is why many instruments have circular dials (clocks, speedometers, etc.).
Tip: do not use for precise comparison with many variables. If there is 1% difference between two variables, a pie chart won’t display it well. Likewise, too many variables on the pie make it less effective.

The gauge chart: also known as “speedometers,” they are easy to digest. However, they can be used to display only one value in a quantitative context – no comparison to another variable is possible unless you make two individual gauge charts.
Tip: only use it to display one data point. Cannot be used to express a trend, an evolution, or comparison.

The spider chart: also known as “radars,” spider charts are comparative charts. When you have multivariate data with over three distinct quantitative variables, it is a good way to easily display it.
In other words, you want to evaluate two or more things that have three or more characteristics.
Tip: not possible to use it to express time, a trend, or an evolution.

The map: maps are good to display geographical data. It’s important to bring added value in a readable way.
Tip: stuffing the map with red dots will not bring anything other than confusion. Be careful with the way you display your data on it.

The scatter plots: this chart is very useful when you look for a correlation using a very large dataset. These charts are used to show how much one variable is affected by another – the relationship between these two variables is called the correlation.
Tip: it’s a useful graph when you want to show data where each instance has at least two metrics. Adding a trend line can also help.
3. Bring Your Dataviz Together To Create A Powerful And Convincing Dashboard
You have now picked the right data visualization that answers the right questions for your audience. You cannot stop after such a good work, and should now bring all your charts together to create the overview telling your data story: a beautiful dashboard.
However, as with any story, there are some tips and tricks and best practices to follow to make it the most attractive and understandable possible.
Since there’s no need to reinvent the wheel every day, here are some guidelines you can follow to help you out when building your dashboard.
Dashboard Design Best Practices
Less is more
We have come a long way since 19th-century poet Robert Browning first stated that ‘less is more’ – however, this is an advice that we still like to follow.
The notion that clarity and simplicity lead to good design hasn’t been as strong and anchored in our western societies as it is today. The minimalist movement and design style indeed takes over everything, from tech products to clothes.
[tweet_box design=”default”]It’s not just a lifestyle trend, and when it comes to data, simplicity is the best practice to follow.[/tweet_box]
But it will not be difficult to implement since you have already chosen only relevant metrics for your audience!
An example of data visualization overload is the chart released by Calculated Risk, which illustrated the percent of job losses relative to peak employment.
Not only do the axes have unusual measures (usually time is displayed on the x-axis, while here the years are the variables on the graph and the quantity of months is on the x-axis), but it’s impossible to track the lines individually, let alone compare them to each other:

No data clutter
In a similar vein, designing your data visualization to avoid clutter will greatly improve it.
To optimize the impact of your data on your audience, you can organize it in a way that appeals to their cognition.
The Gestalt School of Psychology wrote a great guide that identifies the forms and characteristics of clutter, with specific rules of the organization of perceptual scene – in other words, the order creation in the context of visual stimulation.
The principle of proximity, for instance, dictates that human have a tendency to group elements together based on their location (their “proximity”).
Perception can be manipulated with well placed, grouped data.
Another principle is the similarity: circles go with circles and squares with squares. Humans naturally group comparable elements together.
If you have several green rectangular on your visualization, your audience expects them to be grouped together.
Data visualization is also impacted by subconscious desire to achieve visual order. The information consumption of your audience (in western societies) will start from the upper left corner down in an “F” pattern.
So, diagonal elements are not really welcome on a dashboard.
Here’s an example of a chart with non-intuitive data arrangement, which makes it difficult for the reader to connect visuals with values – and the 3D, even if it “looks cool,” overlaps other data items:

Provide context
Always provide a broader context for data. Anyone in the room can then clearly articulate its background and where you want to head it to.
If your data was gathered online through Google Analytics and that you focused on one specific channel, or segment, at a certain time period, it is important to mention it.
Likewise, if your marketing data was collected offline through street-survey or cold-calling, it’s worth mentioning it since the results will be interpreted in a different light.
Another crucial point when you present your insights is the jargon.
When reporting to investors, they might not be familiar with what a GA cohort analysis refers to, or what is behind the channel-names of user acquisition.
Make sure you have a jargon-free dashboard to onboard everyone, and do not to overuse technical words. Adaptability is key!
Don’t forget about the color theory
One thing that marketers should be even more aware than any other professional, is the color theory.
There are a lot of comprehensives guides out there that will help you with which color works best for what, and which emotions they trigger or work on.
A common mistake is to use highly-saturated colors too often.
Anything intense draws attention, but if your whole dashboard is filled with intense colors the effect is too overwhelming for the reader: they don’t know what to read first and what is more important.
Using the same colors for the same items of your dashboard makes it consistent and reduces the reader’s mental effort of comprehension.
Never go for random colors with your items, especially when you display them together in a group (as we have seen earlier in this article, to avoid data clutter).
You can also use graduation of a color to display intensity – it is particularly relevant if you use a map chart, showing the concentration of a variable in different regions. In other words, dark red shows “a lot of X” and light-red expresses “a little of X.”
Here’s an example of a poor use of colors, with a gradient of blue in the background that does not add anything but chaos to the visualization, clashing with the bright yellow and red that are too intense – and that gives it a general feeling of a “cheap” dataviz!

Make it personal
Directly linked to the previous best practice on colors, is the customization of your dashboard.
[tweet_box design=”default”]To make data visualizations more personal to your audience, you can take over the corporate branding of your clients, their color theme, and the logo.[/tweet_box]
This will add a tailor-made touch that will engage your audience even more.
Have fun and be creative
Last but not least, the authenticity.
Giving a genuine feeling to your dashboard that will echo your audience is easy when you let yourself be a bit creative – we’re not telling you to forget all what we just said, but you can pick what makes sense to you and let go some creativity and fun in your presentation.
Illustrations of Marketing Dashboard Best Practices
Now that we have gone through all the steps to realize an outstanding marketing dashboard for your specific audience, let’s illustrate it with real, professional dashboards following these best practices!
You can easily connect your different data sources and work on them to create such visualizations with an online dashboard tool.

Let’s start with a dashboard that can precisely answer the initial situation you were immersed in the introduction of that article.
Your CEO asks you, Chief Marketing Officer, to report on the marketing activities efficiently so that every stakeholder around the table has a clear picture of what is happening.
Using such dashboard will perfectly address their requirements, as it provides an overview of the most important marketing KPIs you track.
It gives the overview they need, and valuable material to make strategic decisions: the total revenue generated, the total spend and its evolution over the year, the profit the company made thanks to marketing and the return on investment.
The content is relevant and actionable, so let’s have a look at the general style: the color theory is respected, as they are harmonized and stay in the same gradient of blue – no clash making it difficult for the eye to read.
The metrics are arranged in an efficient and organized way, with each color gathering metrics for each category: revenue generation, costs, and profit.
No data clutter, clear distribution leading from one matter to the next, and ending with the final, important bottom-line: ROI.
Marketing Performance Dashboard

This dashboard presents the perfect report on all your marketing performance data related to different paid campaigns at a glance.
This is ideal to report to the PPC Manager asking for insights on the various initiative you have undertaken and how well you did for each.
How much you spent on each compared to the budget, and how much each performed compared to one another. That will help in planning and executing goals better, but also in budgeting for future marketing efforts.
Concerning the outlook, once again we see that the global layout is simple, clear and efficient.
The campaigns’ data in the center of the dashboard is contextualized with the left column, providing an overview of various metrics that are then compared for each campaign – and each of them has a specific color.

Last but not least, this dashboard is more detail-oriented with specific data related to website traffic. It is not directed to investors or outside stakeholders for instance.
Such a dashboard needs a lot of data to make sense, but it remains clear and understandable, avoiding the data overload trap.
This is a marketing dashboard that will allow you to keep an eye on all major web analytics with ease, from the most basic information (like the number of visitors over time) to more elaborate metrics (where they are coming from, and how they convert).
The snapshot on the top gives an ideal overview of the KPIs that are further detailed underneath.
The layout is coherent, the colors harmonized, and visuals are used to easily catch what the metrics are saying: a clock to illustrate the visits’ time duration, a flag for the goal conversion rate, a human icon for the number of visits, etc.
The use of visual is, as we explained in the first part of that article, essential for a rapid and easy comprehension.
Conclusion
Hopefully, you now know more about the different steps to take to create outstanding data visualizations.
From audience definition and targeting, to picking the right metrics and the right charts, you should now understand better how to create professional data visualizations that will convey the right information behind your marketing data.
Next time you are asked to report on your activities, you will have everything in hands to make the best impression on your audience!
About the Author: Mona is a passionate writer about data analytics and innovative business reporting techniques. She is working as Content Manager for datapine, in the bustling startup landscape of Berlin, Germany. Try datapine’s smart dashboarding solution for free with this 14-day trial.