If you’ve ever wondered what visitors actually do on your website (not just what pages they visit, but where they click, how far they scroll, and what they ignore), Crazy Egg tracking gives you that visibility.
Unlike traditional analytics tools, Crazy Egg delivers visual insights through heatmaps, scrollmaps, and session recordings.
In this post, we’ll break down how Crazy Egg tracking works, what features matter most, and how marketers, designers, and conversion specialists use it to make smarter decisions that drive results.
What is Crazy Egg?
Crazy Egg is a visual analytics and user behavior tracking tool that helps you understand how visitors interact with your website.
Unlike traditional analytics platforms that show numbers and graphs, Crazy Egg offers visual snapshots, like heatmaps and session recordings. Here’s an example of a heatmap showing where people click, scroll, or get stuck.
It’s designed for marketers, UX designers, and conversion optimizers who want actionable insights without needing a technical background. With a lightweight setup and no-code testing options, Crazy Egg makes it easy to identify what’s working, what’s not, and where to focus your optimization efforts.
Visual Behavior Tracking Tools
Crazy Egg’s core strength lies in its visual tracking tools, which turn user interactions into easy-to-understand reports. These tools help you quickly identify which parts of your page attract attention and which parts go unnoticed.
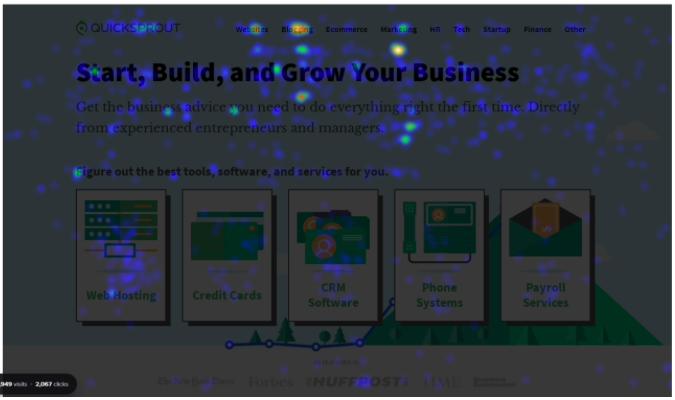
Use heatmaps for tracking all click activity
Heatmaps reveal where users are clicking the most on your site. Bright areas signal high engagement, while cooler areas show what’s being ignored.
For example in this heatmap, the buttons and links in the menu are the “hottest” colors and get the most clicks on the page.
This type of tracking in Crazy Egg helps you optimize calls to action, menus, and key page elements based on real behavior, not assumptions.
Use scrollmaps for tracking how far people scroll
Scrollmaps show how far down the page visitors typically scroll. The brighter the colour, the more people scroll there. For example, the yellow section in this image is where most visitors scroll to on the webpage:
If your key calls to action aren’t being clicked as much as you expected, it could be that they’re buried too low on the page. A scrollmap will show you the ideal position to move them to instead.
You can also diagnose when pages are too long, especially on mobile. If you have a long, dark section at the end of your page, it means hardly any visitors make it that far down:
This is a helpful report for figuring out where to put your sign-up buttons, forms, and other important calls-to-action and trimming long pages with unnecessary content.
Use confetti reports for segmenting individual clicks
Confetti reports visualize every individual click on your page, color-coded by traffic source, device, browser, and more.
It’s perfect for uncovering how different audience segments interact with the same content, helping you tailor pages for specific audiences.
For example, you can track audiences based on any of these metrics (and more):
You can also track custom metrics by setting up a campaign based on UTM parameters to see how people were driven to your website from different campaigns behave.
Use overlay maps for tracking clicks per element
Overlay reports break down clicks by element, such as buttons, links, or images. They allow you to see which parts of your site are being used most and look like this:
It’s a straightforward way to audit content and navigation performance at the element level. For instance, the overlay report will assign each clickable element on your website a “+” marker. Then you can see what percentage of visitors click each element.
You can also segment your visitors by data like:
- Referrer
- New vs returning status
- Time of day
- And more
Although you get a lot of information from the visual heatmaps and confetti maps about where visitors click, it can help you to see an exact percentage breakdown of how many visitors click each button or call to action you care about. That’s what overlay reports excel at instead.
Tracking Your Session Recordings
Crazy Egg’s session recordings let you watch real visitors navigate your site. You’ll be able to see mouse movements, clicks, scrolls, and all.
These video playbacks show exactly how users interact with your content in real time, uncovering moments of confusion, hesitation, or frustration that heatmaps alone might miss. Here’s a short snippet of what it might look like:
Recordings are especially useful for spotting:
- Broken user flows or frustrating form experiences
- Rage clicks (where users click repeatedly out of frustration)
- Drop-off points in signup or checkout processes
Instead of guessing why users leave or fail to convert, session recordings give you firsthand evidence so you can fix issues fast and improve the user journey with confidence.
Track A/B Testing Results
Crazy Egg includes a simple, built-in A/B testing tool that makes it easy to test changes to your pages without relying on developers or complicated software.
You can quickly set up experiments to compare different headlines, images, button placements, or content blocks and see which version performs better.
For example, Crazy Egg will automatically track the variants you create against each other and provide conversion and ROI insights so you can see which design works best.
The interface is designed for non-technical users, so you can launch and monitor tests in just a few clicks.
Once a winner is clear, Crazy Egg helps you roll out the higher-performing version confidently.
Whether you’re optimizing landing pages, improving conversions, or refining design elements, A/B testing with Crazy Egg helps you back your decisions with real data, not hunches.
Tracking Different Audiences With Segmentation Filters
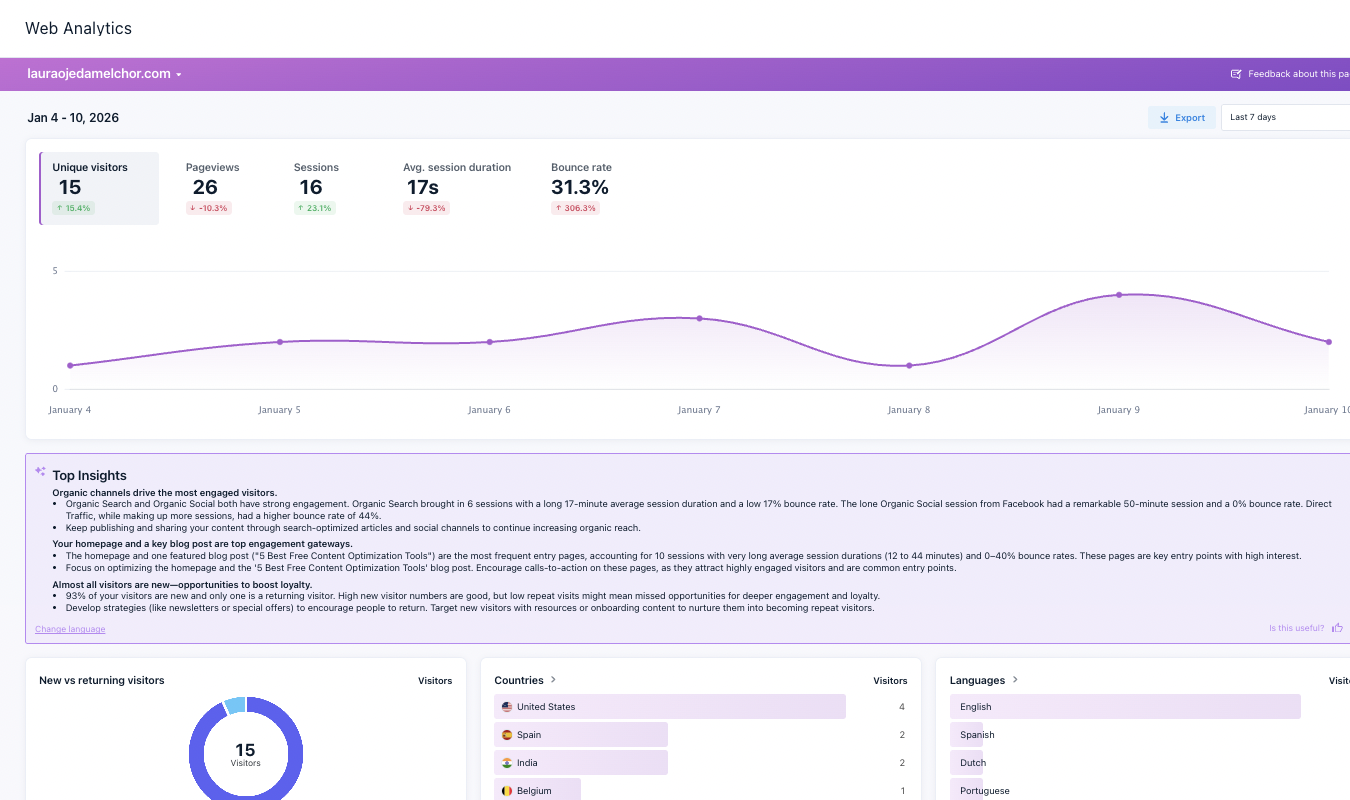
Not all visitors behave the same, and Crazy Egg tracking lets you see those differences clearly with the traffic analytics feature. Similar to Google Analytics, you can track performance based on what pages people visit and the marketing channels that send you the most traffic.
For example, here’s a report on how many sessions came from Google for this website:
Unlike Google Analytics, however, you can also see the visual session tracking and recordings to assess where people dropped off and why.
With built-in segmentation filters, you can also break down behavior by device type, traffic source, referral URL, location, and more.
This means you can:
- See how mobile vs. desktop users interact with the same page
- Understand how visitors from email campaigns behave differently than those from organic search
- Spot friction points for specific audience segments
By tracking how different groups navigate your site, you can tailor experiences, prioritize changes, and improve performance for the audiences that matter most.
Snapshot Reports: One-Click Tracking Summaries
Crazy Egg’s snapshot reports combine multiple visual tracking tools (like heatmaps, scrollmaps, and overlays) into a single, easy-to-digest report. With just one click, you get a comprehensive view of how users engage with a specific page.
You can also see how fast or slow the page loaded on average, how many clicks were rage or dead clicks, and how many people left the page before taking action:
Snapshots are ideal for:
- Benchmarking new or redesigned pages
- Spot-checking performance during marketing campaigns
- Quickly identifying areas of interest or neglect
Each snapshot includes filtering options by date, device, and source, so you can dig into the behavior of different audiences without creating separate reports.
It’s a fast, high-level way to turn visitor behavior into actionable insights with no spreadsheets or complex dashboards needed.
Tracking Goals and Conversions
Crazy Egg isn’t just about where people click. It also helps you understand what those clicks lead to. With goal tracking and conversion tracking features, you can define specific actions (like form submissions, button clicks, or visits to a thank-you page) and measure how well your pages drive them.
Once a goal is set, Crazy Egg shows:
- Which parts of the page contribute to conversions
- How conversion rates vary across segments (e.g., traffic source or device)
- Whether changes from A/B tests improve performance
This makes it easy to tie user behavior to real business results and adjust your design or messaging based on what actually drives conversions.
Integrating Crazy Egg Tracking Into Your Existing Stack
Crazy Egg is designed to complement your existing tools, not replace them. Its lightweight script integrates easily with popular platforms like Google Tag Manager, Shopify, WordPress, Wix, and more.
Key integration benefits include:
- Quick setup with minimal code (or no code if you’re using plugins)
- Seamless syncing with your analytics tools for deeper analysis
- Customizable tracking for specific events or campaign landing pages
Whether you’re managing a simple blog or a complex ecommerce store, Crazy Egg tracking fits neatly into your workflow—no developer bottlenecks, no performance drag.
Real-World Use Cases for Crazy Egg Tracking
Crazy Egg tracking isn’t just about pretty heatmaps; it’s about solving real problems and making smarter decisions. Here’s how businesses use it to drive results:
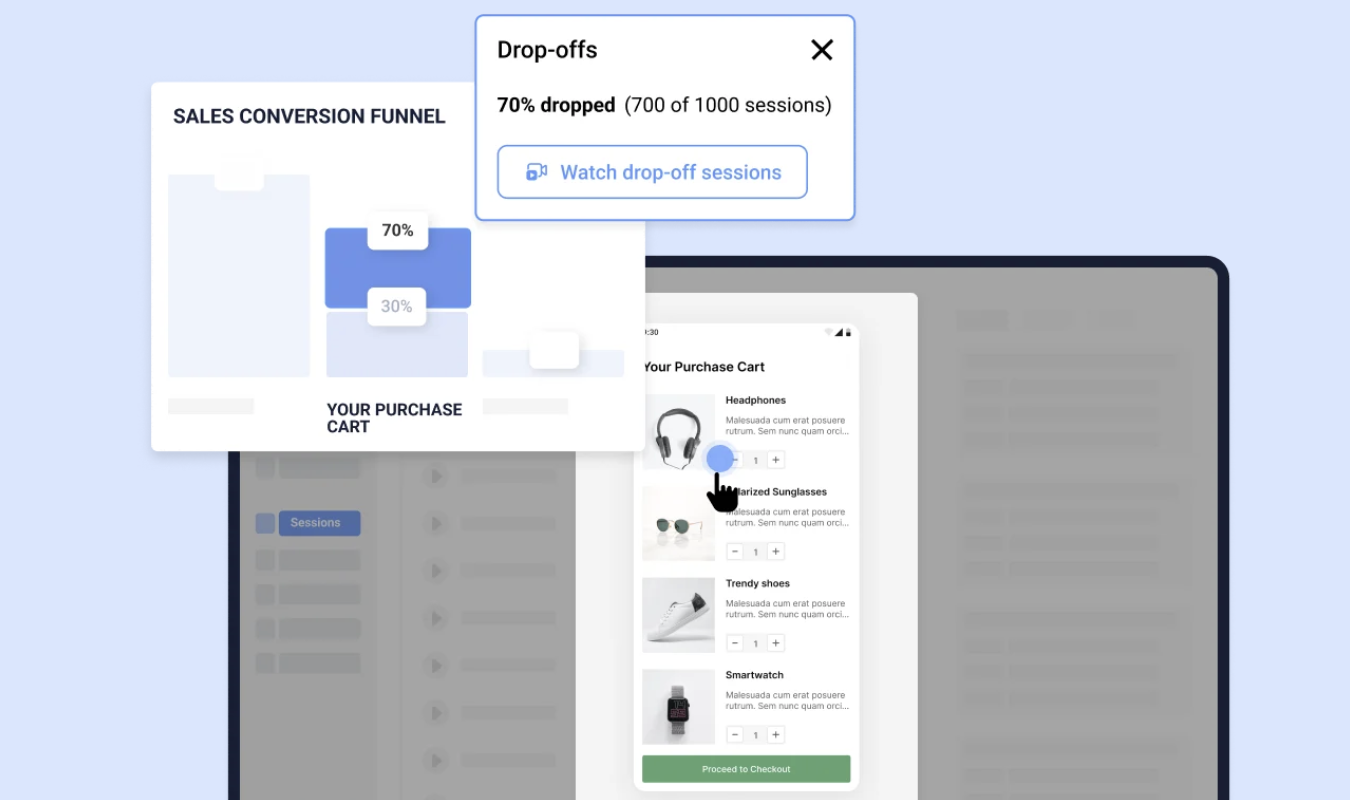
1) Identify and fix UX drop-offs
Crazy Egg tracking helps you pinpoint exactly where users lose interest or encounter friction.
With tools like scrollmaps and session recordings, you can spot areas where people stop scrolling, rage-click, or abandon forms.
These insights allow you to fix navigation issues, streamline key interactions, and remove blockers, so users keep moving through your site instead of bouncing.
2) Increase conversion rates
Want more users to take action? Crazy Egg tracking shows you what’s getting attention and what’s not. By analyzing heatmaps, click data, and confetti reports, you can fine-tune CTA placement, simplify forms, or rewrite headlines that underperform.
These small but strategic changes can lead to significant lifts in your conversion rate without needing a full redesign.
3) Validate design changes
Instead of relying on gut feelings or internal opinions, use Crazy Egg to test and prove what works.
With built-in A/B testing and visual reports, you can experiment with layouts, button styles, or messaging and see what truly improves performance.
It’s an easy way to make confident design decisions backed by real user behavior.
4) Optimize for different audiences
Not all users behave the same. Crazy Egg helps you track how different audiences interact with your site.
Segment behavior by device, traffic source, or campaign to tailor experiences for mobile visitors, ad-driven traffic, or returning users.
This granular insight lets you personalize and prioritize changes that matter most to specific user groups.
5) Support data-driven redesigns
When it’s time for a redesign, Crazy Egg gives you a data-rich foundation to guide your decisions. Use historical tracking data, goal performance, and visual behavior insights to identify what’s working and what needs improvement.
This eliminates guesswork, builds internal alignment, and ensures your redesign is grounded in actual user behavior, not assumptions.
Whether you’re a marketer running landing page tests or a UX team planning a full site overhaul, Crazy Egg turns visitor behavior into actionable next steps.
You can get started with a free trial to take Crazy Egg for a spin and test its tracking capabilities for your site today!