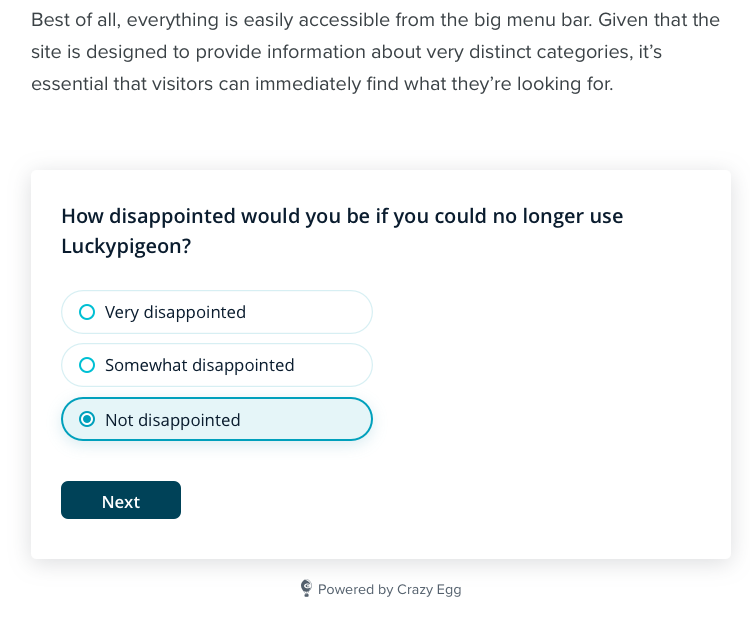
Surveys and CTAs are convenient tools for driving engagement from users, without having to disrupt their site experience. Just pop-up or overlay these on top of your existing pages.
These widgets can be optimized by testing different headlines, offers, and flows. Compare their engagement rates, and learn which messages grab your users’ attention best.
You can now view engagement rate metrics for your Surveys & CTAs. Side-by-side in each dashboard:
- Surveys – Response Rate (Responses divided by Views)
- CTAs – Click Rate (Clicks divided by Views), Conversion Rate (Conversions divided by Clicks)
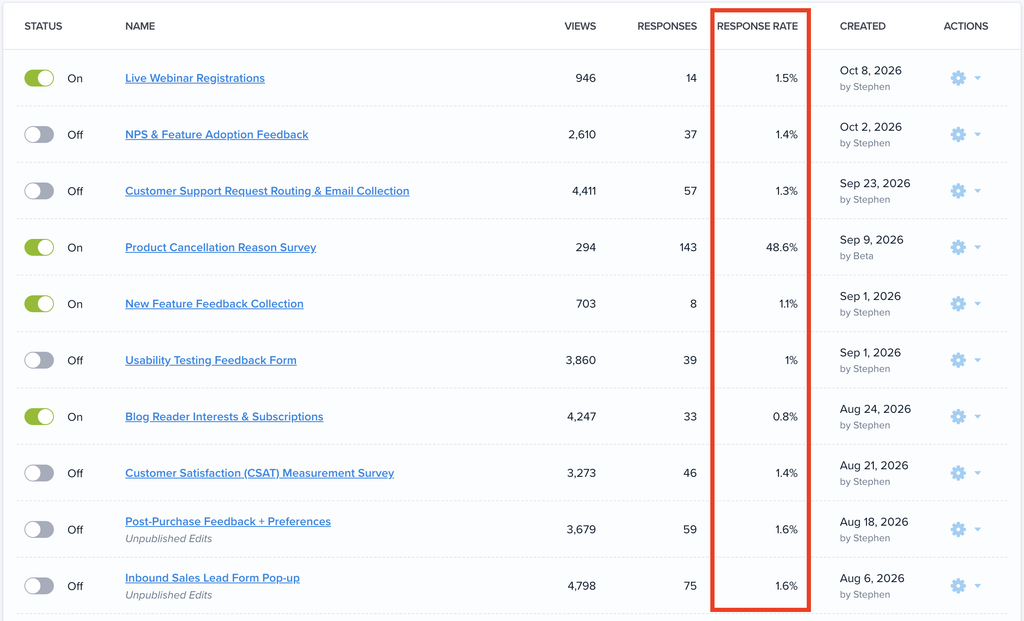
We already provide volume metrics for these features: Views, Responses, Clicks, Conversions. You can see how many users saw and engaged with these on-page widgets.
But to improve the performance of your Surveys and CTAs, you want to improve the percentage of users who engage with them. Those metrics are now easily visible and comparable in Crazy Egg’s feature dashboards.