Finding the best behavior tracking tool for your mobile app or website (or both) is an investment, and it’s important to make sure you pick the best fit. Kissmetrics is one such tool, and it’s ideal for individual user tracking. Mixpanel, another behavior analytics tool, shines at product-level tracking.
We’ll compare their top features in detail to help make the decision easier for you.
Kissmetrics vs. Mixpanel: A Quick Snapshot
Browse this quick overview of how Kissmetrics and Mixpanel compare, or dive into the detailed breakdown below it.
| Feature | Kissmetrics | Mixpanel |
|---|---|---|
| User Behavior Analytics | ✅ Person-based analytics tied to individual user profiles ✅ Tracks complete customer journeys across sessions and devices ⚠️ Analytics tools are simpler and less exploratory | ✅ Event-based analytics focused on product usage patterns ✅ Interactive reports that update dynamically with filters ✅ Flows visualization shows how users move through a product |
| Funnels | ✅ Tracks funnels across sessions and platforms using user IDs ✅ Strong lifecycle tracking across web and mobile ⚠️ Less emphasis on time-to-convert insights | ✅ Interactive funnel builder with drop-off analysis ✅ Dedicated time-to-convert metrics ✅ Retroactive funnel creation from historical data |
| Cohorts & Segmentation | ✅ Cohorts built from demographics or behaviors ✅ Useful for lifecycle and revenue analysis ⚠️ Less flexible exploration tools | ✅ Dynamic cohorts based on properties or event sequences ✅ Cohorts update automatically as users meet criteria ✅ Easy side-by-side segment comparisons |
| Retention Tracking | ✅ Tracks returning users tied to individual profiles ✅ Retention reports comparing cohorts over time ⚠️ Less focused on feature-level engagement analysis | ✅ Retention reports tied to product events and features ✅ Break down retention by events, properties, or cohorts ✅ Ideal for analyzing how product changes impact engagement |
| A/B Testing & Experimentation | ⚠️ A/B testing available but limited to Enterprise plans ⚠️ Not accessible to most users | ✅ Experiment tool supports feature tests and rollouts ✅ Tracks which users saw each variant ⚠️ Experimentation availability depends on paid tiers |
Feature Breakdown: Kissmetrics vs. Mixpanel
1. User Behavior Analytics
Kissmetrics
User behavior analytics help teams understand how individual web visitors or users interact with their product or website. The goal of any good behavior analytics tool is to provide features that help you track user actions on your platform.
Kissmetrics gathers these events for you and organizes them according to user. Basically, it creates a profile for each web visitor.
As that user browses your website and interacts with your mobile app, Kissmetrics collects this data and adds it to the user profile. This gives you a way to see each customer’s unique journey, over time, with your product(s).
That’s not all, though. Kissmetrics provides analytics features for this data, too, although the analytics aren’t as robust as I’d like. You can create funnel reports (more on this in a moment), retention charts, and segments according to the characteristics various users share.
Of course, even though building individual user profiles is a strength here, Kissmetrics does also collect aggregate user data.
Mixpanel
Mixpanel is less focused on connecting data to individual users and more focused on how user actions relate to each other across your product interface.
To that end, it offers tools like session replay, interactive funnels, retention reports, and dynamic cohorts. You can break down behavior by properties like device, campaign, or feature usage.
What I like about Mixpanel is that its reports automatically adjust as you adjust filter settings. You can explore how different behaviors correlate with conversion, engagement, or churn without rebuilding reports from the ground up.
One of my favorite Mixpanel features is its Flows tool. With Flows, you can visualize aggregate steps users take as they move through your product.
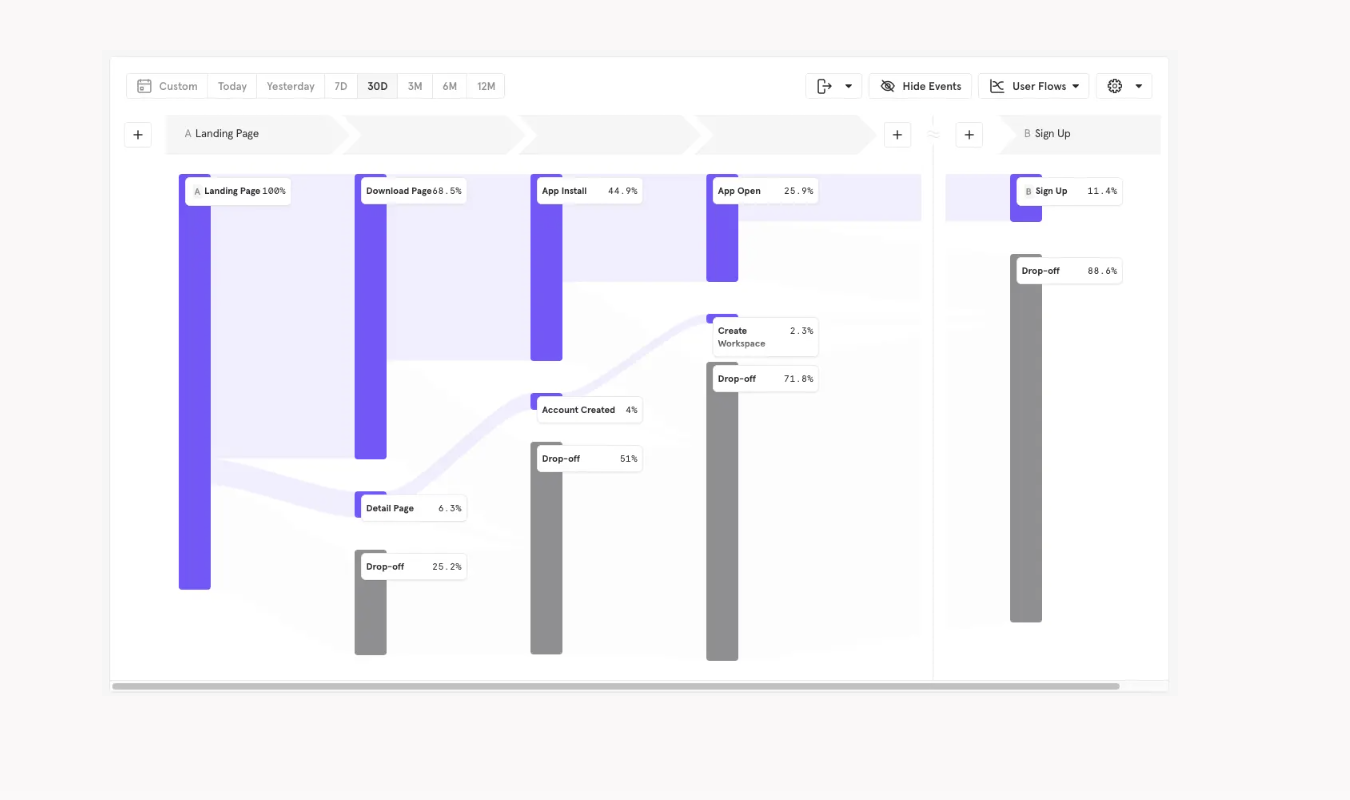
This shows your team where users are spending the most time and where they’re churning in larger numbers than you’d like. Flows data can help you build accurate conversion funnels with Mixpanel’s Funnels tool since you already have an idea of what users do on your site.
2. Funnel Analysis
Kissmetrics
Like most other behavior analytics tools, Kissmetrics lets you build funnels by choosing a sequence of events and then showing the number of users who completed each one. It also shows you which steps precede user drop-offs.
What stands out for me is that Kissmetrics allows you to track users across different sessions and platforms, as long as you define the user’s identity in some way before you start tracking.
For instance, you can ask Kissmetrics to track a sequence like this:
- Visits website
- Signs up for free trial
- Activates product on desktop
- Logs into product app on mobile
- Uses product on mobile
This sequence spans both app and website, and it’s a sequence Kissmetrics can keep up with. The main requirement is that you have to make sure that you consistently track each user via a unique ID.
Other funnel tools only track single sessions and restart anytime the user leaves the website or product, making for fragmented funnels. I really appreciate that Kissmetrics doesn’t. It’s ideal for brands that need to track individual user behaviors across both time and platform.
Mixpanel
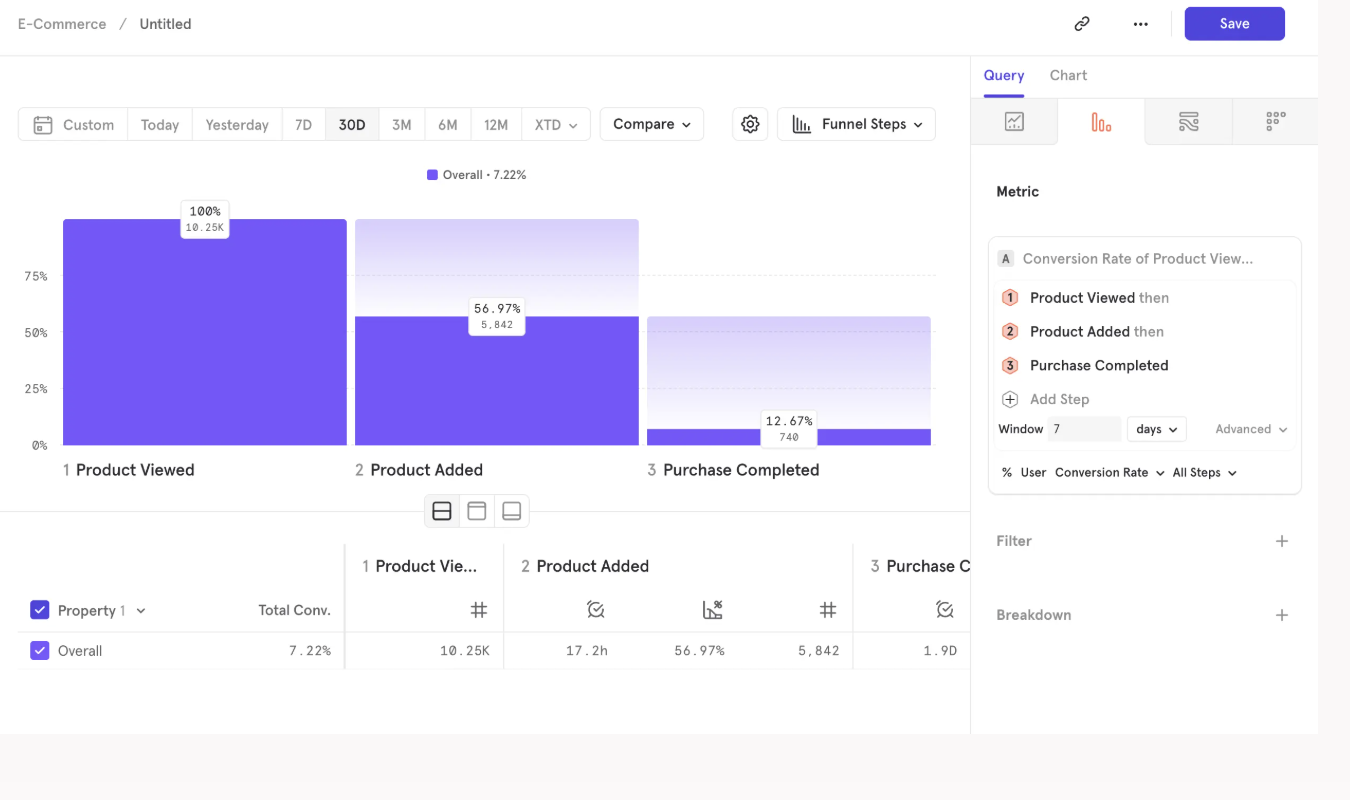
Like Kissmetrics, Mixpanel allows teams to create funnels based on sequences of events. And like Kissmetrics, Mixpanel can track folks over multiple sessions and on more than one platform as long as you set up identity tracking.
But Mixpanel has a bit of an edge over Kissmetrics in the funnels department due to its focus on tracking time-to-convert metrics. In addition to showing where in the step sequence users drop off, Mixpanel also shows you the time it takes users to convert. Whether it takes minutes or days, Mixpanel will tell you.
Also, Mixpanel offers retroactive funnel building, a feature I regularly tout. Instead of forcing you to wait for new data to trickle in, you can use data you already have and use it to create funnels.
That way, you get a picture of how users have historically found their way to conversion on your site or app.
This feature is particularly helpful for smaller brands who don’t have tons of web traffic yet, and who need to learn more about their funnels regardless.
3. Cohort Analysis and Segmentation
Kissmetrics
Being able to create cohorts of users with similar behaviors and characteristics is key to a thriving analytics strategy. Kissmetrics delivers on this front: you can group users into cohorts based on shared behaviors or characteristics.
You could focus on demographics, like grouping users together based on their age range, location, or device type.
Or, you could look more closely at behavior and combine folks who seem reluctant to jump from a freemium to a paid plan. Or group together all users who sign up for your email list after seeing a specific campaign.
You get the idea. You can even group users together based on which step they stopped at in a conversion funnel.
These cohorts can then be used across Kissmetrics’ suite of tools, including funnels, retention charts, and revenue analysis graphs.
Mixpanel
Mixpanel also supports cohort analysis and segmentation, but true to form, it emphasizes flexibility and exploration too. Cohorts are defined by properties or entire sequences of events along with demographic characteristics.
For instance, you could group together users who trigger a specific feature five times a week.
Once you’ve defined your cohorts, you can compare them side-by-side and apply them to reports for easy analysis.
The cohorts also update automatically as new users meet the criteria you’ve set, which is convenient. As long as you’ve got the cohort set up, you’ll get the users who match those criteria fed right into it.
4. Retention Tracking
Kissmetrics
Kissmetrics measures retention by analyzing whether your users come back to your platform and keep performing meaningful actions over a period of time.
It’ll tell you, for example, which of your users log back in a few times a week to use the product. And which ones ditched it after their free trial ended.
Because Kissmetrics ties every single event to an individual user profile, the analytics here get really specific. Kissmetrics can tell you how often a specific user comes back and how their behavior changes over sessions and devices.
You can visualize all these nuances and fluctuations using a Kissmetrics Retention report. To set up a report, you’ll define a starting event—like signing up for the product—and a returning event, like logging into a dashboard.
Kissmetrics will then calculate how many users from the starting-event group come back and complete the follow-up action over different periods of time.
If you’ve created different cohorts and segments, you can ask Kissmetrics to analyze retention by cohort and compare how those cohorts compare over a period of time. That way, you know which types of users tend to be more engaged with your product in the long-term.
A core difference between the way Mixpanel and Kissmetrics approach retention is this: Kissmetrics focuses on highlighting which of your customers are the most loyal and active. Mixpanel, as you’ll see in a moment, helps you understand how your product’s features impact user engagement.
Mixpanel
Like Kissmetrics, Mixpanel includes a dedicated Retention report feature that measures how many users come back and perform a specific action over a set time period. Setting up and tracking retention is essentially the same process as it is on Kissmetrics.
But Mixpanel’s reports focus less on how individual users or user types interact with your product over time and more on how various product features and updates affect user engagement.
For instance, you could analyze whether users who tested out a beta feature return to the app more often than those who didn’t.
This could give you tons of insight on whether that new feature is worth fully launching and supporting. If the new feature brings those users back 2x more than before, you’ve got a winner on your hands. If it doesn’t, you might have some decision-making to do.
Mixpanel makes this type of analytic work easy because you can break retention down by events, feature usage, cohorts, and properties from right within the report. No rebuilding needed.
Kissmetrics doesn’t tilt its workflow toward product feature usage in the same way. Where
Mixpanel specifically offers reports specifically crafted to analyze product feature use and engagement patterns, Kissmetrics makes you manually define these events first. Only then can you analyze them using funnels or retention charts.
5. A/B Testing and Experimentation
Kissmetrics
Kissmetrics offers A/B testing tools that let you create multiple versions of anything from emails to ad campaign copy. But there’s a huge caveat here: it’s only available to enterprise customers with lots of traffic. There’s not even an option to add A/B testing on to one of Kissmetrics’ regular plans for an extra fee.
This is a missed opportunity, IMO, because A/B testing is such an effective way to measure how customers actually respond to changes you think are going to be amazing.
And with Kissmetrics’ focus on creating fully-fleshed individual user profiles, making A/B testing more accessible seems like a perfect complement. A no-brainer.
But for whatever reason, it’s not. At least not right now.
Mixpanel
Mixpanel also offers A/B testing with its Experiment tool, but like Kissmetrics, you can only buy it if you use a paid plan. Usually, that’s an Enterprise plan.
It’s a little fuzzy trying to figure out who can use this feature, because it’s only listed as an add-on for Enterprise plans, but the copy says it’s only available for paid plans—which could include Mixpanel’s Growth plan.
But I digress. Mixpanel offers a lot more information on its Experimentation feature than Kissmetrics does.
And I like what I see. Teams get the whole kit and caboodle, from feature flag-based rollouts (ideal for mobile apps!) to cohort-based audience targeting. Mixpanel automatically tracks which users saw each version and compares how those user cohorts perform across key metrics like feature usage, conversions, and retention.
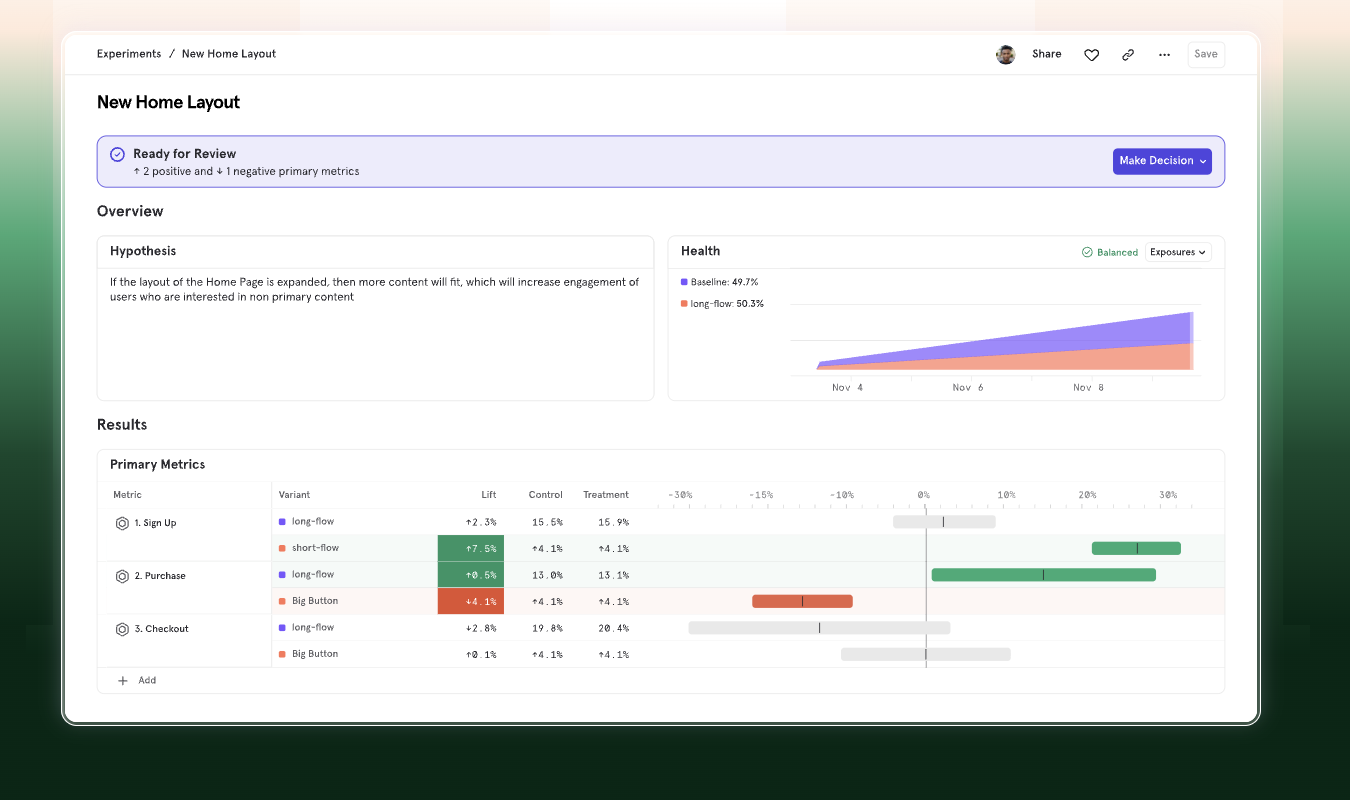
Plus, the dashboard is one of the most easy-to-absorb I’ve ever seen.
Pricing Breakdown: Which Has the Best Value?
Now that we’ve looked at the five core features, let’s dig into pricing with a quick table.
| Kissmetrics | Mixpanel |
|---|---|
| No permanent free plan; offers a free trial before paid tiers. | Free-forever plan with core analytics (funnels, retention, insights) and up to about 1M monthly events. |
| Paid plans typically start around $299/month and scale based on tracked users and advanced reporting features. | Paid plans start around $24–$25/month for the Growth tier and scale based on the number of events tracked each month. |
| Pricing scales mainly with the number of tracked users and advanced reporting tiers. | Pricing scales primarily with event volume (every tracked user action counts as an event). |
| Best value for analyzing individual customer lifecycles and value | Best value for product (and mobile app) analytics and tracking feature usage |
Kissmetrics is the more expensive of the two in many ways, but if you need individual user tracking, it can be worth the price. Mixpanel is the more valuable of the two if you need a tool primarily to track the success of product iteration.
Final Verdict: Is Kissmetrics or Mixpanel Right for You?
If you want to get to know your customers on a deep and individual level, Kissmetrics may be right for you. It offers analytics that tie every single event to an individual user profile.
This makes it incredibly easy to track customer journeys, analyze customer lifecycles, and connect user actions to your revenue.
For a tool that’s more focused on product usage and feature engagement, Mixpanel might be a better fit. It helps you analyze how users interact with specific parts of your product.
This makes tracking adoption, engagement patterns, and retention easy, even across various user segments.
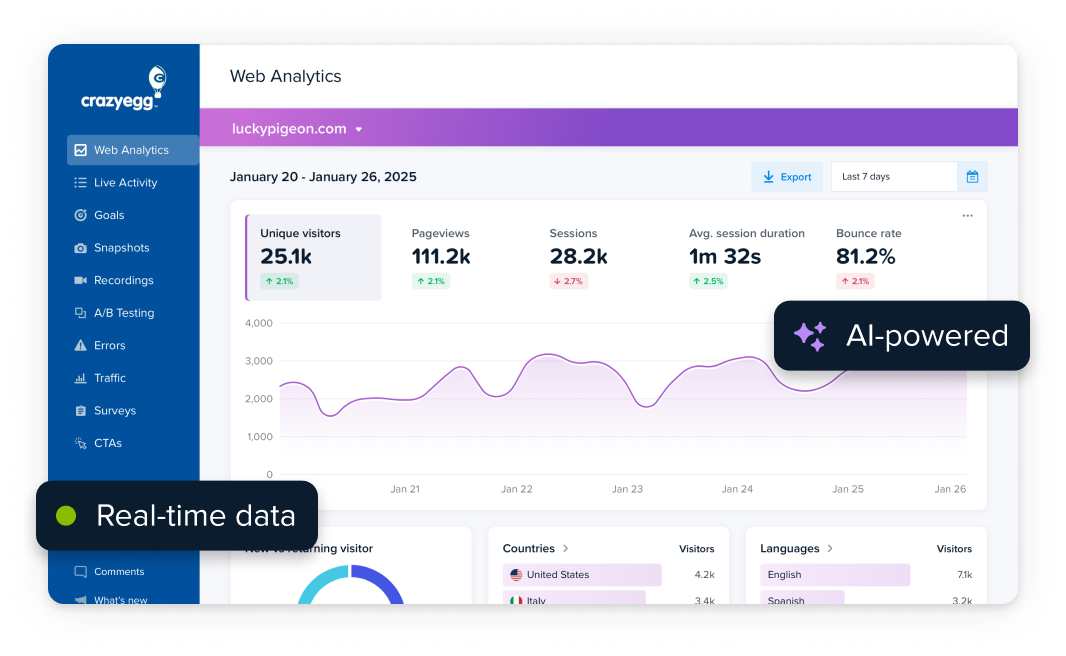
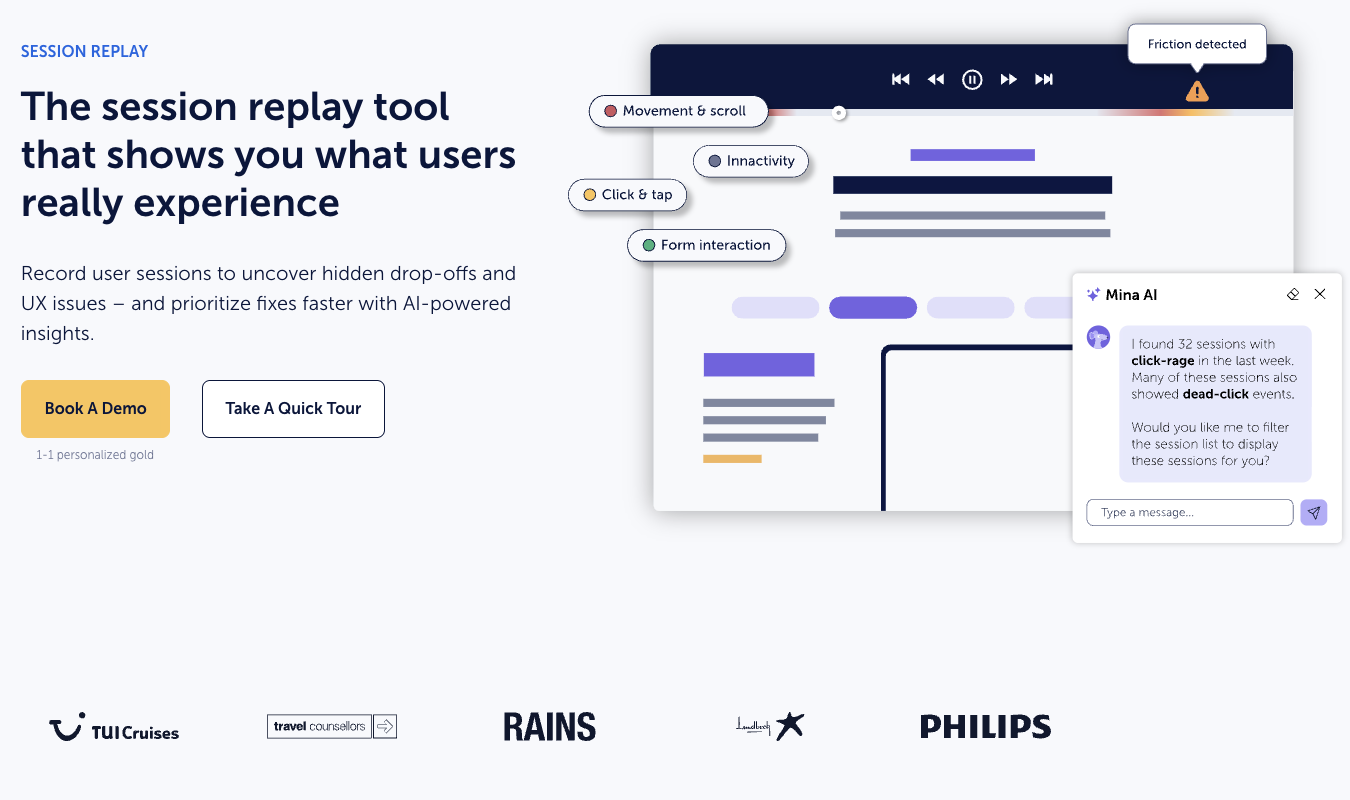
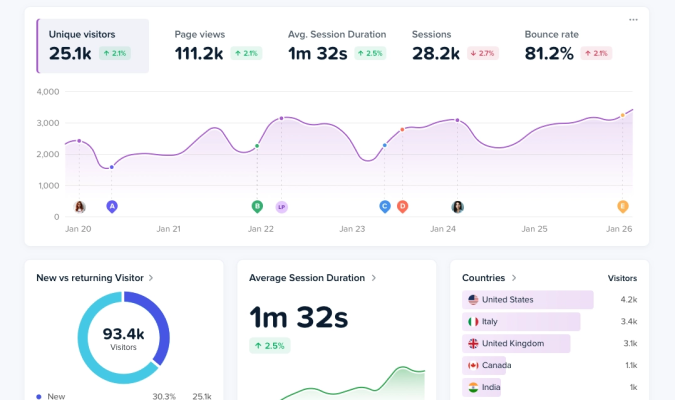
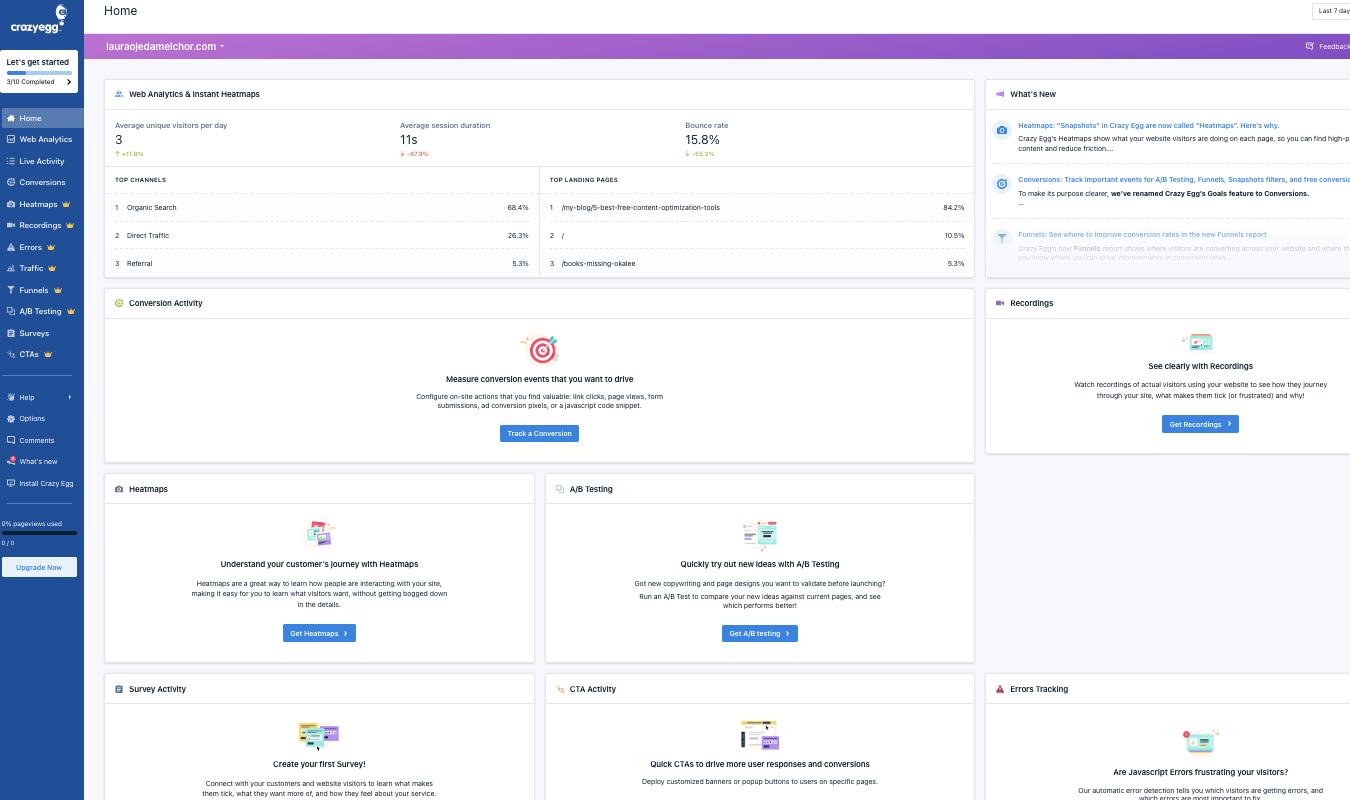
If you need a tool that has deep behavior analytics tools for websites—heatmaps, session recordings, user surveys, web analytics, errors tracking, and A/B testing—try Crazy Egg. Several of Crazy Egg’s tools are free—forever.
Learn more about Crazy Egg’s tools, or see Mixpanel’s and Kissmetrics’ pricing pages to start using one of those.