The crux of AI’s power and promise comes down to its ability to make sense of data in unruly, confusing datasets. It can then build on its analysis to provide actionable insights.
Understanding how AI is currently doing this, what its limitations are, and how it’s evolving are all key to its smart use in your data strategy.
What Do I Mean by Data Analytics?
In using the term “data analytics,” I’m interested specifically in user behavior. The most prominent example of this is web analytics, but it also includes third-party user data—intent data (G4) and search keyword data (Ahrefs), for example—and internal team data (such as you might find in your Power BI dashboard).
This isn’t to say that AI isn’t impacting other areas—cybersecurity quality assurance (QA) and credit-risk analysis are two well-known cases. However, quantitative measurement of behavior in relation to first-, second-, and third-party customer-facing assets (websites, ads, social media, etc.) is what I’ll mostly be focusing on.
1. Actionable Insights for Faster Decision-Making
The core innovation of AI in analytics centers on actionability.
For Hiten Shah, CEO of Crazy Egg, the trend towards AI-assisted actionability is best understood as the shift from the questions “What happened?” and “Why did it happen?” to “How can I use this?”
“Historically, analytics helped teams understand what happened and why,” Hiten said when I asked him about the context of this shift. “AI is now being used to translate that understanding into concrete next steps, creating a bridge between insight and execution.”
For Hiten, when AI functionality works well (and he’s eager not to overlook teething issues), it connects the what, the why, and the how: “It helps prioritize signals, recommend actions, and reduce decision latency, while humans remain in the loop.”
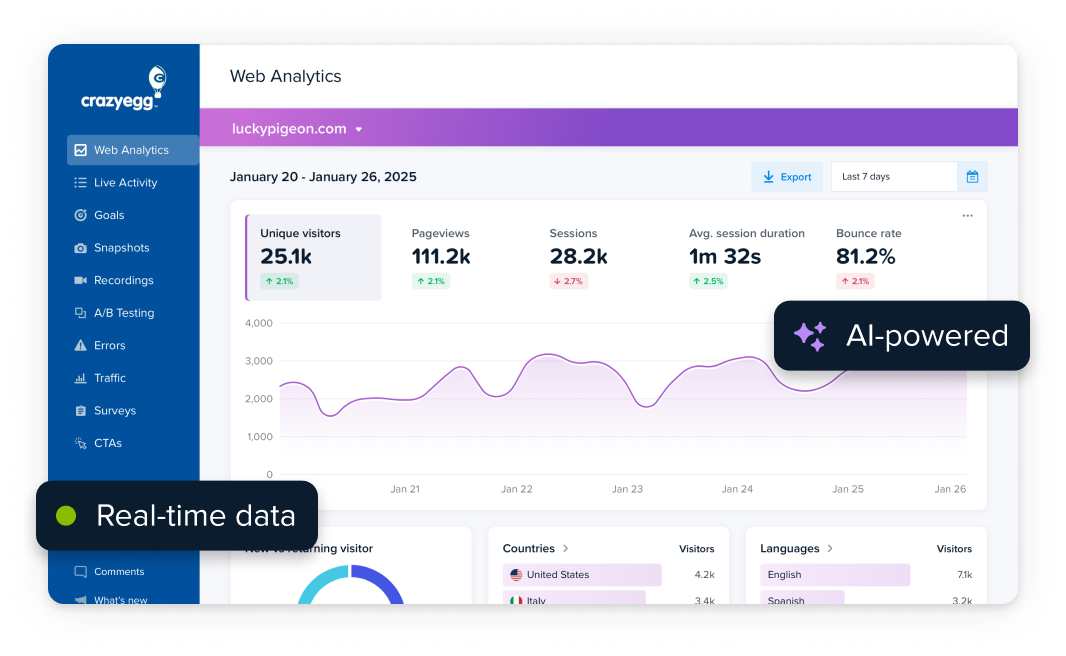
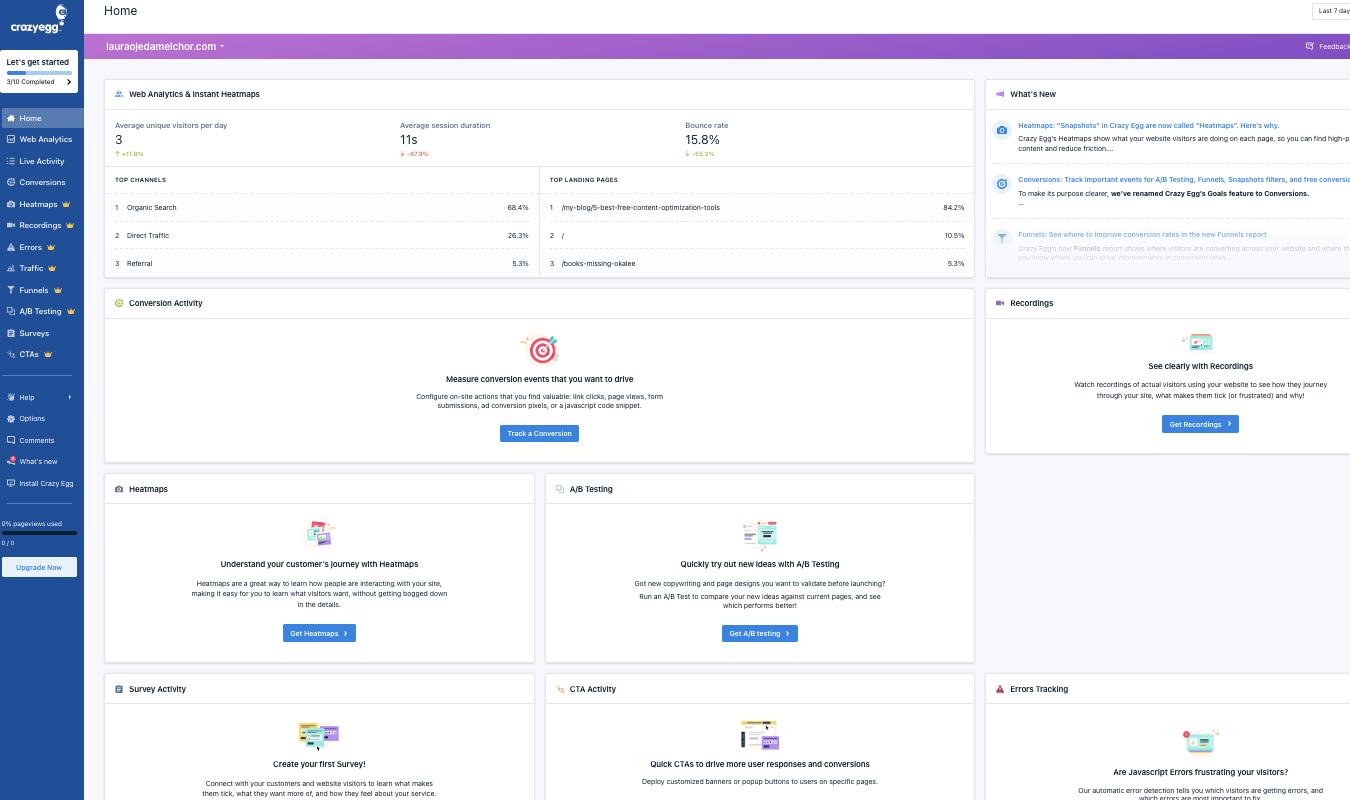
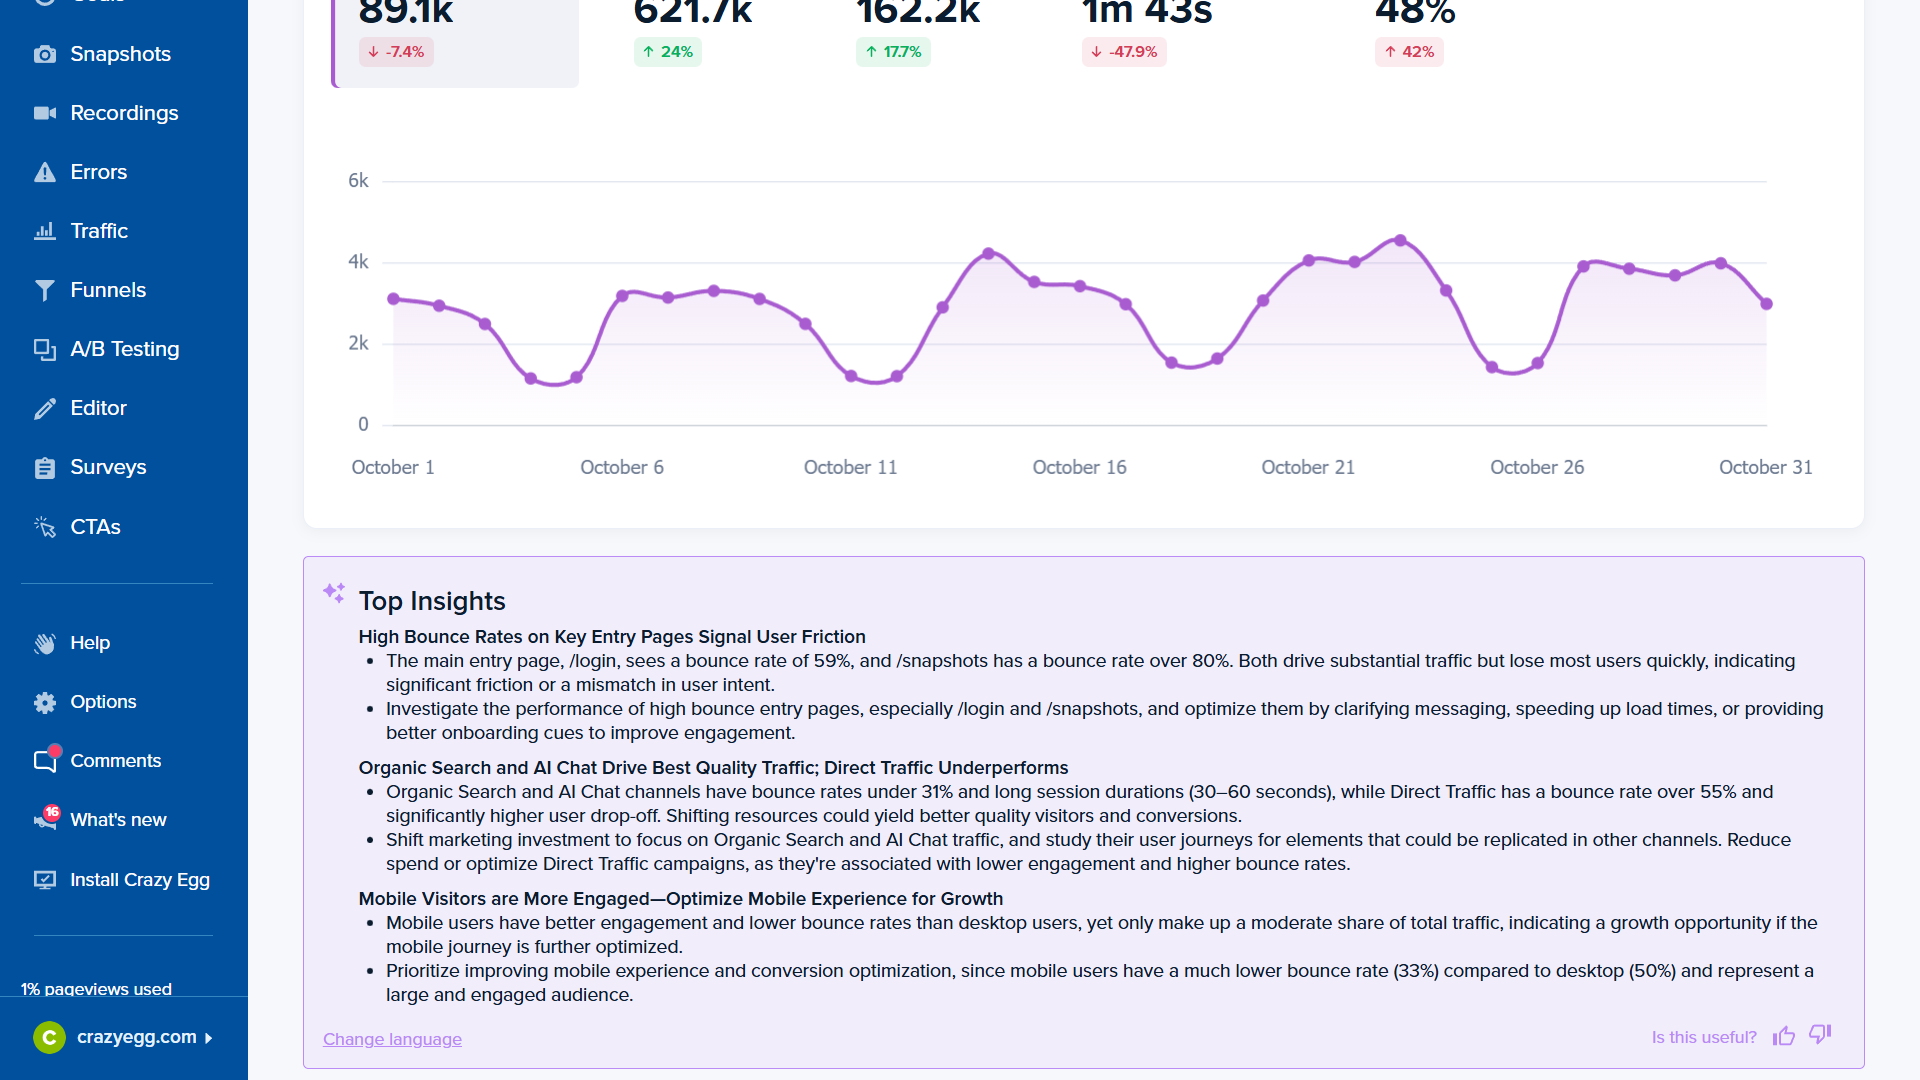
We can see examples of this in Crazy Egg’s user interface, where actionable insights sit alongside select charts. One example reads, “Shift marketing investment to focus on organic search and AI chat traffic, and study their user journeys for elements that could be replicated in other channels.”
This might not strike an experienced analyst as a breathtakingly profound action step. But it’s worth keeping in mind that such advice could easily have taken several hours of analysis of page-specific charts. Even then, the logical outcome of this analysis wouldn’t necessarily have been obvious.
One useful way of understanding AI’s impact on decision-making is through the DIKW pyramid. DIKW is a well-accepted way of understanding how raw data turns into actionable insights. AI is automating and improving outcomes at all four stages, culminating in detailed, accessible “wisdom” at the top.
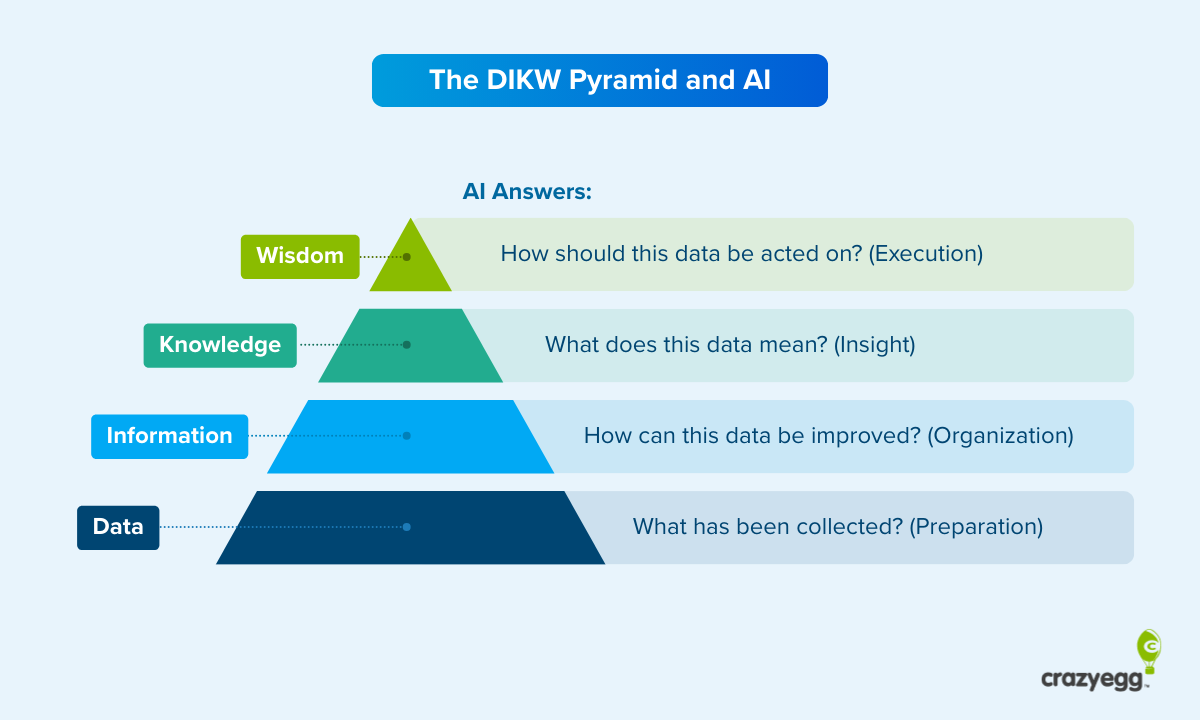
Here’s how AI works at each stage of the pyramid:
- Data: Connects different data sources and performs basic structuring.
- Information: Cleans, checks, and enriches the data and provides additional context.
- Knowledge: Draws on models and heuristics to understand what the data means.
- Wisdom: Understands data insights in light of optimization and decision-making frameworks to suggest practical next steps.
Another example of insight automation is Google Analytics’ in-app AI tool, Analytics Advisor. It sits in the GA4 dashboard and can be opened whenever needed.
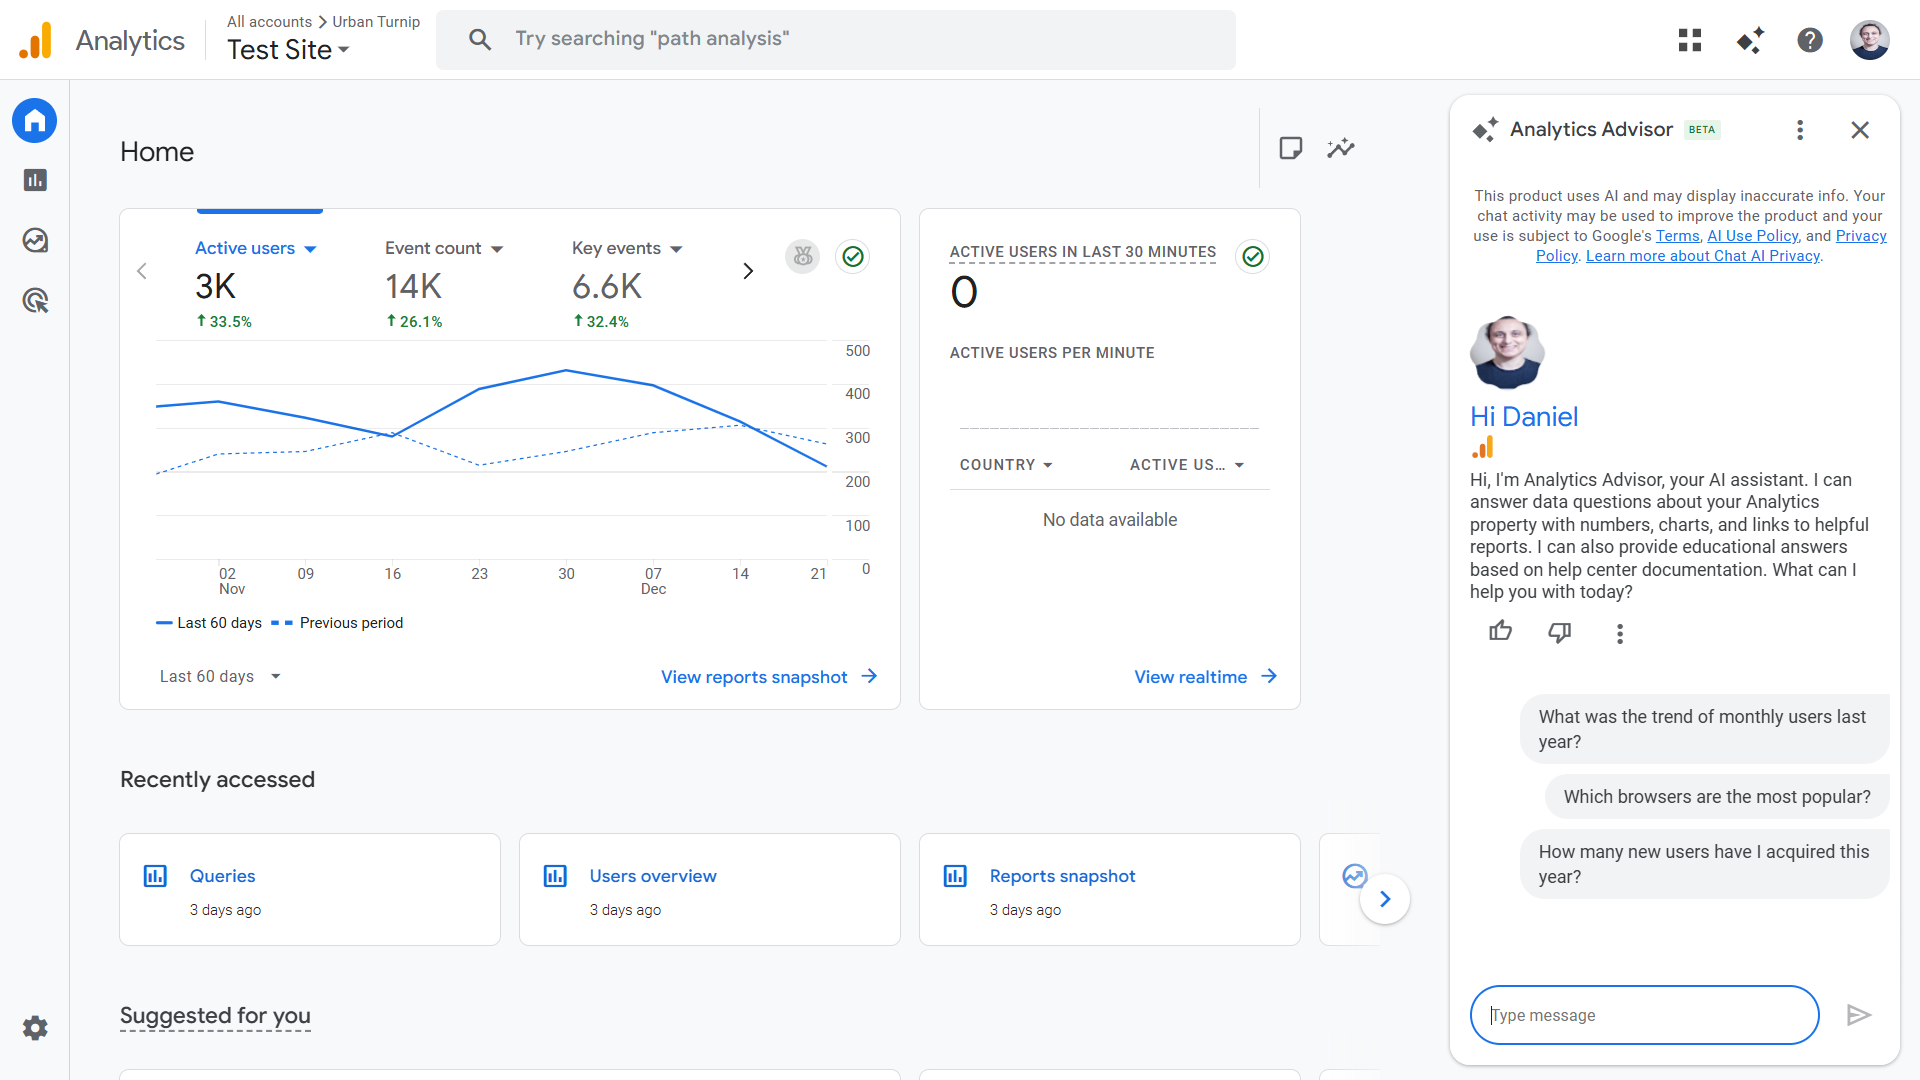
When asked a question, it offers far more than generic advice pulled from Google’s documentation. It pulls site activity metrics and adjusts them to your variables and criteria—such as when I prompt it to tell me my site-wide bounce rate over the last seven days.
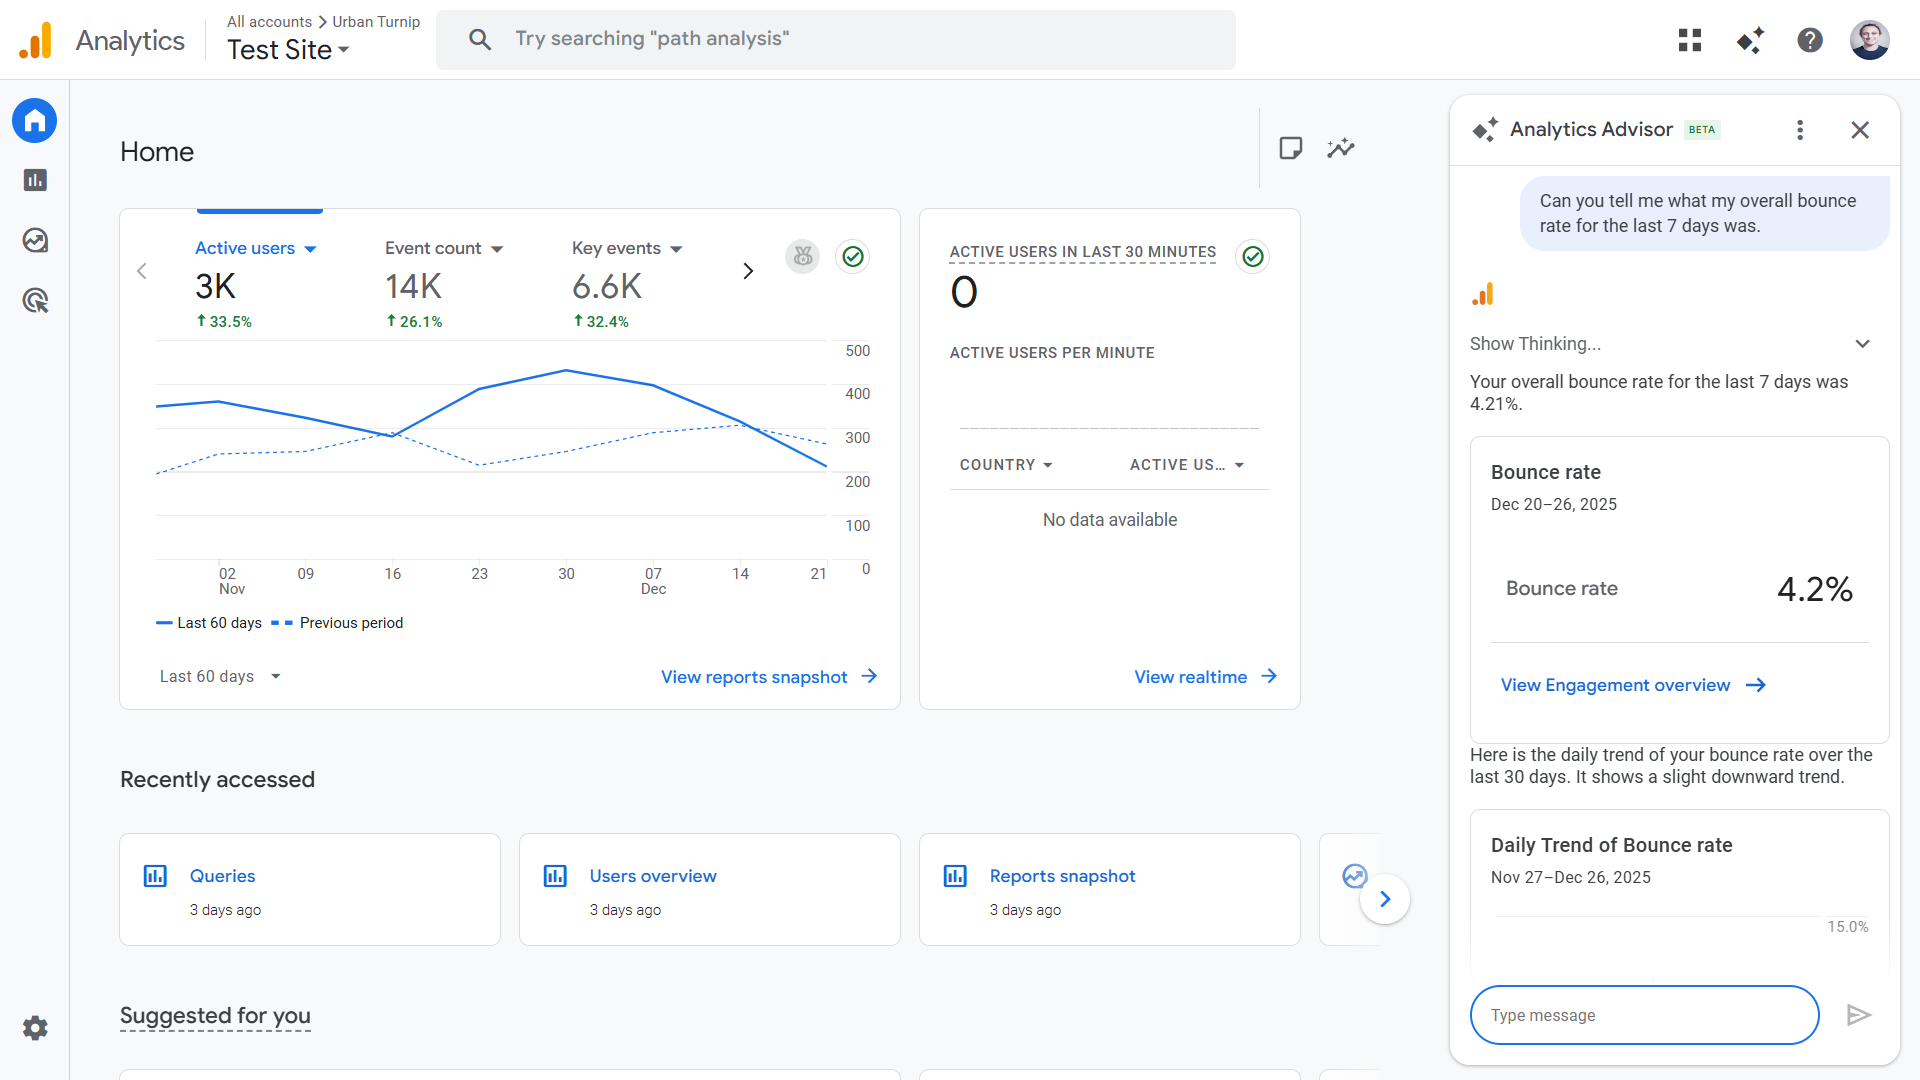
In addition, Analytics Advisor can draw on optimization best practices—using both official Google Analytics documentation and third-party sources—to suggest practical ways of improving specific metrics.
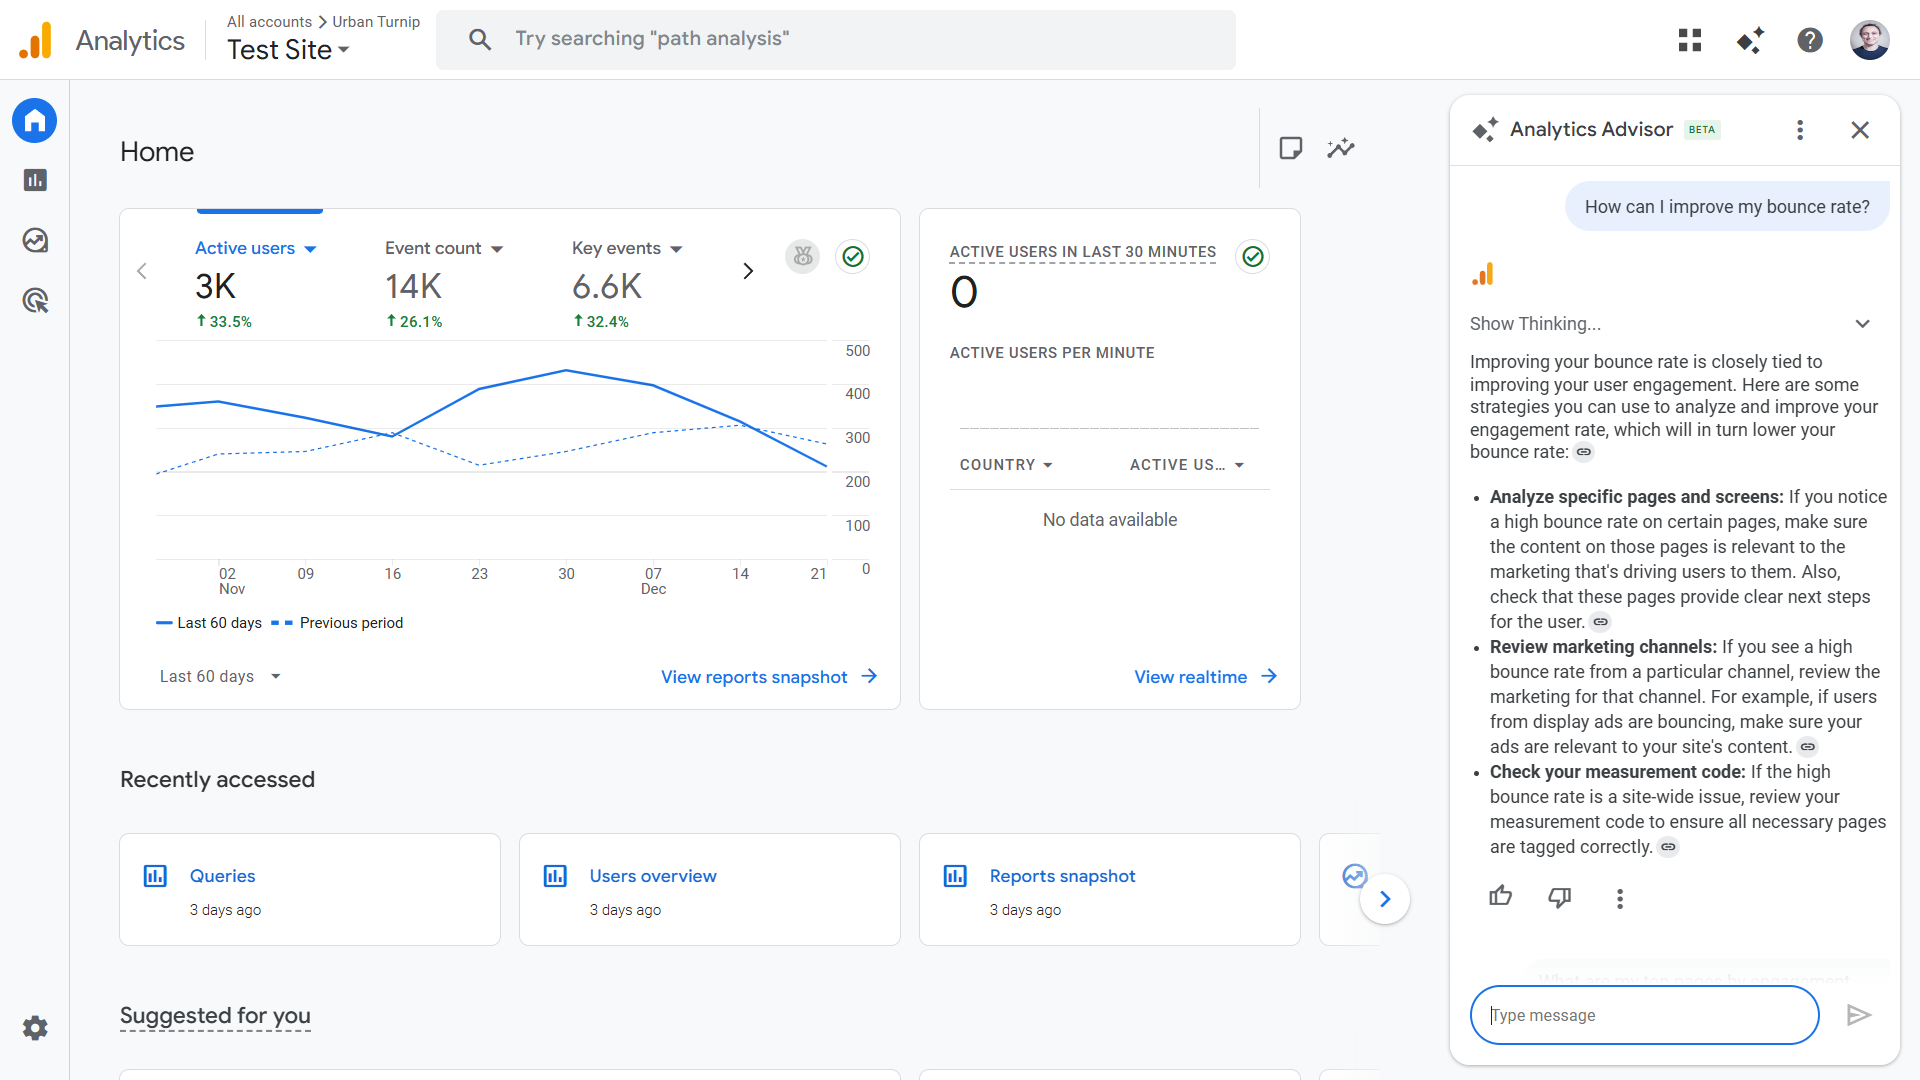
This application is still in its early stages. The guidance in the example above is generic—though still useful, especially to a non-specialist—and there are problems with AI insights as a whole, particularly in relation to reliability (AI often gets it wrong). But these problems are actively being worked on, and the tech is operational.
As AI-assisted execution develops, Hiten believes that we will see greater autonomous use of AI that takes the form of agentic workflows. He says, “Over time, as trust, reliability, and accountability mature, parts of that loop will close. Analytics will move from informing action to safely taking limited action on its own.”
2. Improved Data Quality Management and Enrichment
AI is proving particularly effective at finding and rectifying bad data that can negatively impact insights further down the line. This is a backend process—most users won’t see it in their dashboards—but it’s allowing for precise and broader insights.
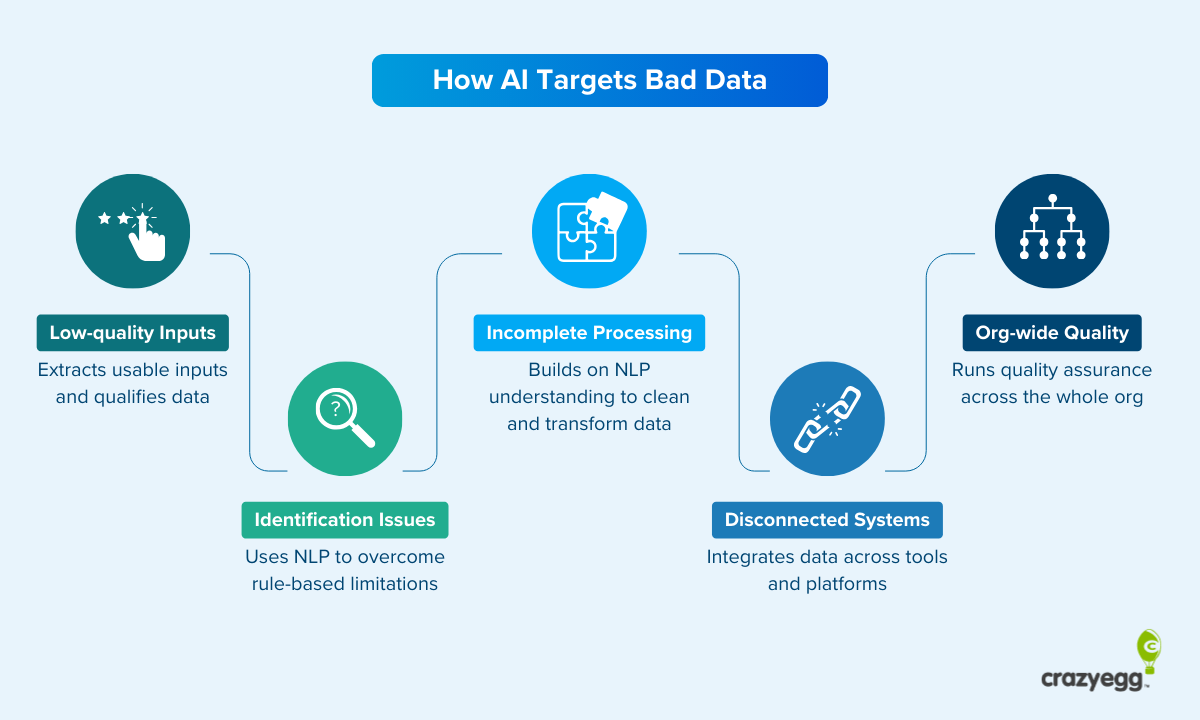
Here’s how AI addresses poor data at key stages of the data management process:
- Low-quality inputs: Extracts usable inputs from unstructured data sets and even qualifies data at the source (for example, while collecting AI chatbot customer service queries).
- Identification issues: Uses NLP to recognize entities, fields, and organizational schema far more effectively than traditional rule-based automation.
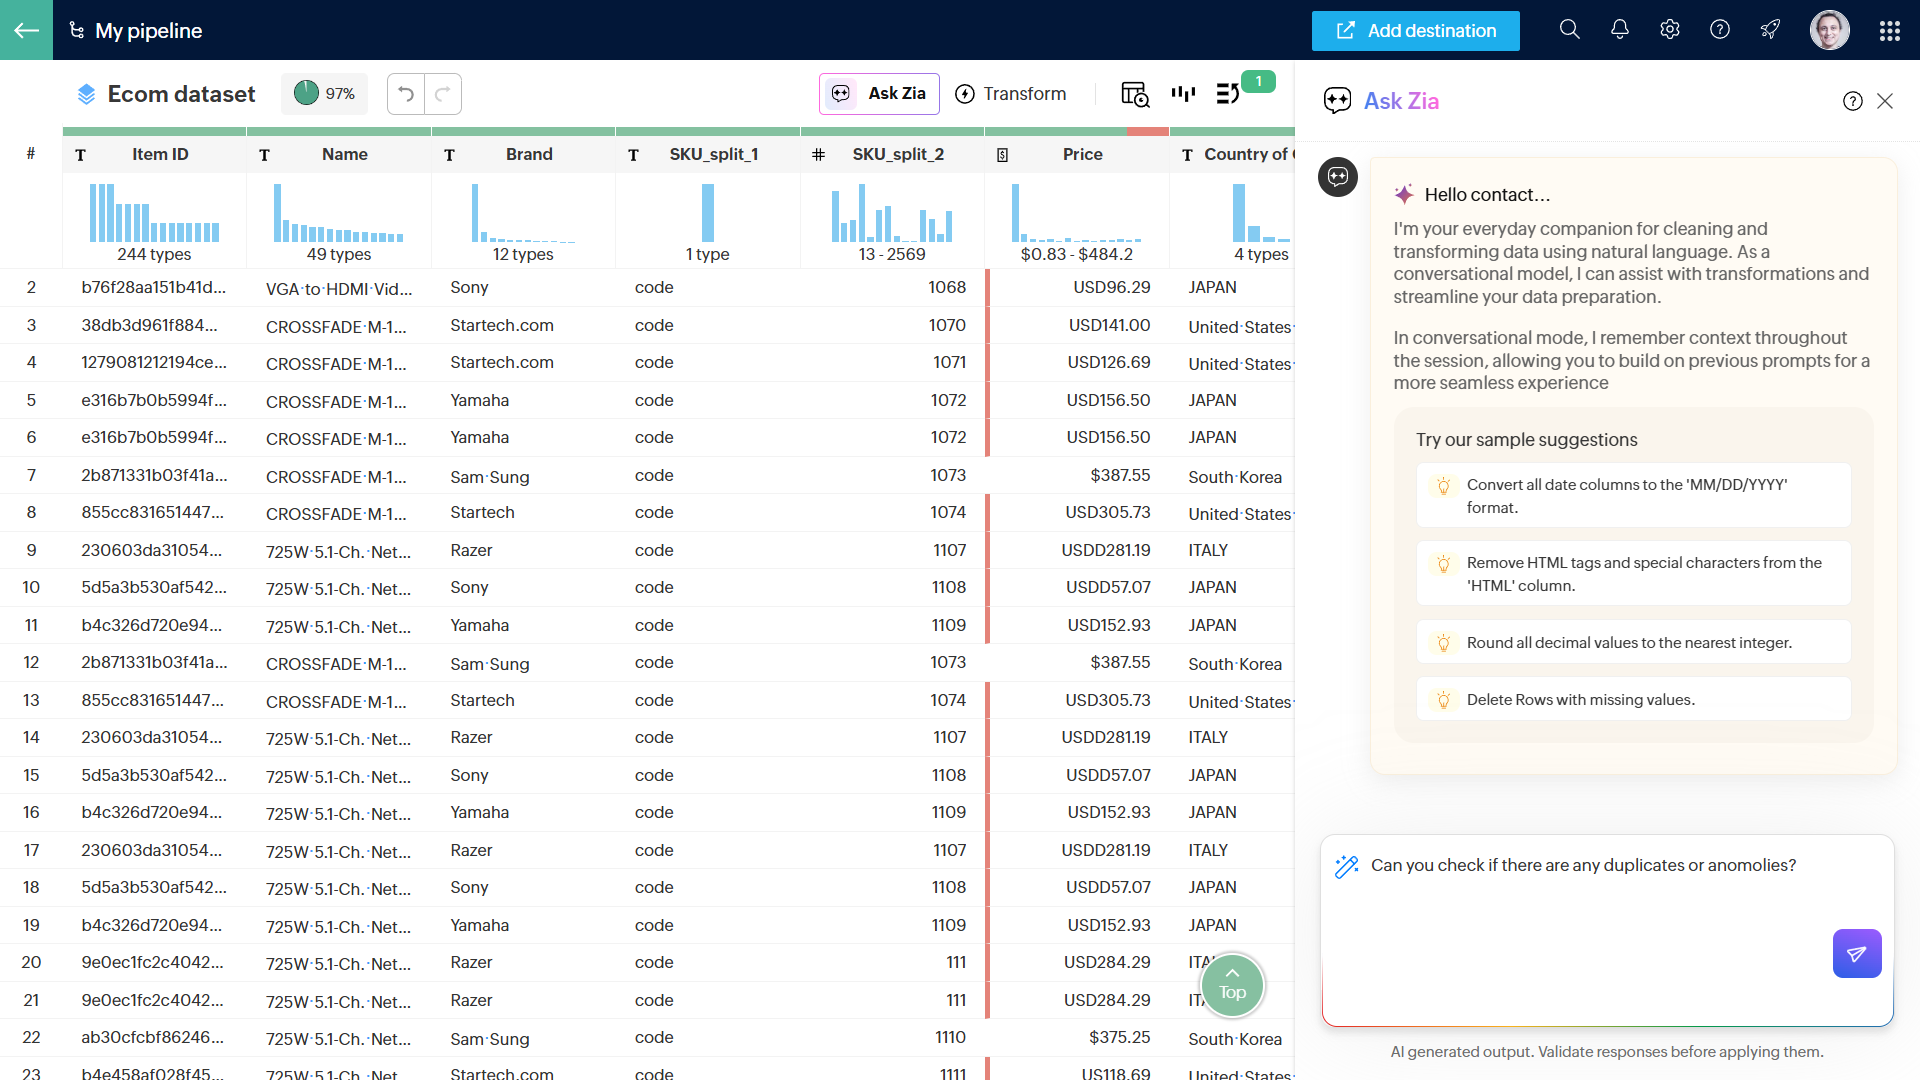
- Incomplete processing: Builds on NLP-based recognition to clean and transform data. For example, Zia is a conversational AI within Zoho DataPrep that can perform processing tasks (like deduplication and transformations) when prompted.
- Disconnected systems: Runs matching, reconciliation, and conflict flagging across different systems, ensuring that teams are working from the same data sets. It can be used to create a single source of truth (SSOT) in a central dashboard.
- Organizational quality: Applies a standardized set of quality assurance rules across the org and flags risks as they arise.
Use Case: AI Enrichment and Lead Intent Tracking
As one of the standout new categories of AI SaaS, automated SDR platforms (essentially cold email tools) provide a window into an interesting use case—AI intent tracking. Agentic AI can gather and analyze numerous intent signals at scale, feeding these into client dashboards.
Jaspar Carmichael Jack is the CEO of Artisan, arguably the leading startup in this new category and famous (notorious might be a more accurate word) for its “Stop Hiring Humans” campaign. Artisan uses AI for wide-scale web scraping and enrichment, which then feeds into intent tracking algorithms.
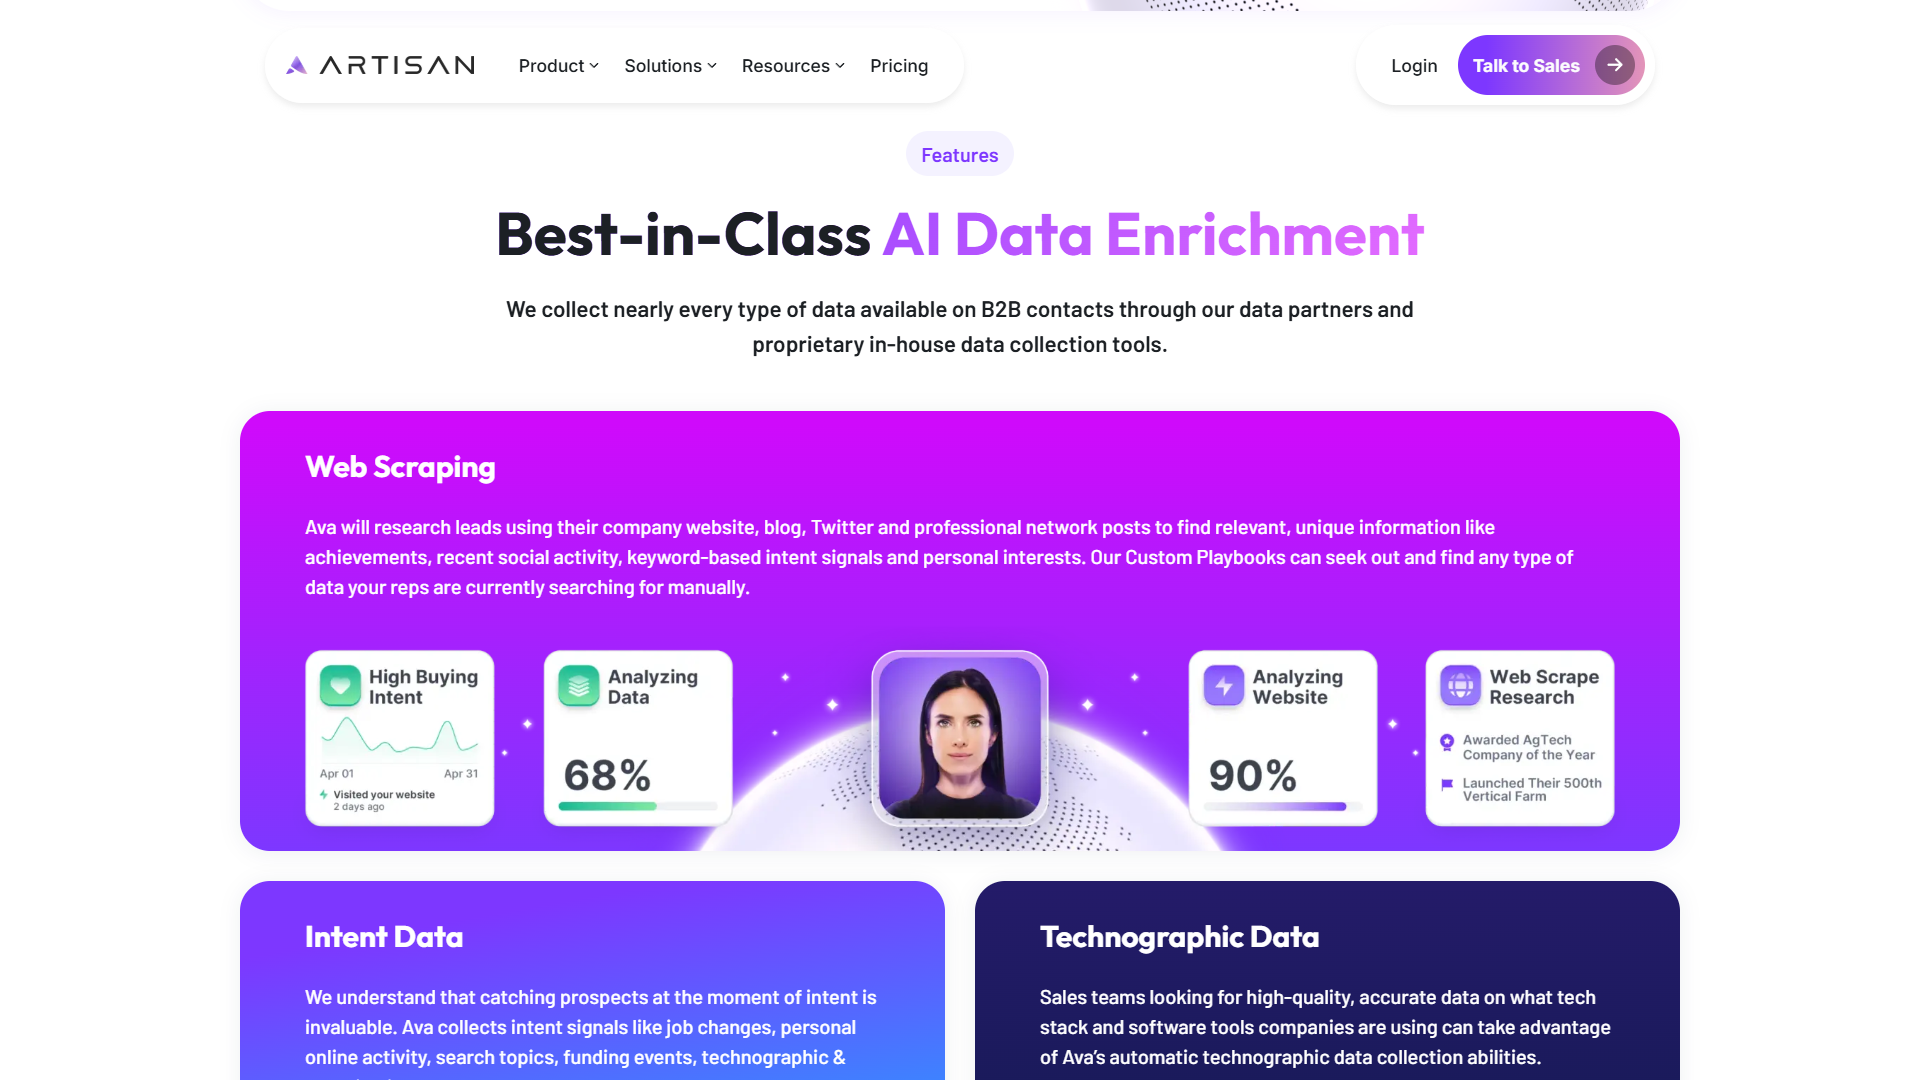
Jaspar told me that “AI handles the complexity of web scraping at scale and makes it usable. It understands the structure of pages immediately, bypasses the noise, and extracts intent signals that actually make a difference, and we can prove it in our client results.”
The fact that users don’t need to engage in any analysis is a key part of Artisan’s value proposition: “It’s all actionable instantly. Our system uses the signals to prioritize leads, and reps and AEs can monitor this process without doing any work. A tag of ‘Hot’ or ‘Warm’ is added to the lead’s profile, and our AI automatically reaches out with an email. If the lead responds positively, they’re routed to a rep.”
3. AI Functionality via Embedded Analytics
Embedded analytics refers to analytics features that are integrated into customer-facing apps, typically ones that aren’t primarily analytics platforms. This stands in contrast to traditional business intelligence (BI) platforms like Microsoft BI and Tableau that present internal data.
There are two trends at play—the increasing prevalence of embedded analytics in all types of platforms and the availability of minimal-code solutions that allow product developers to integrate AI-based analytics functionality into their app.
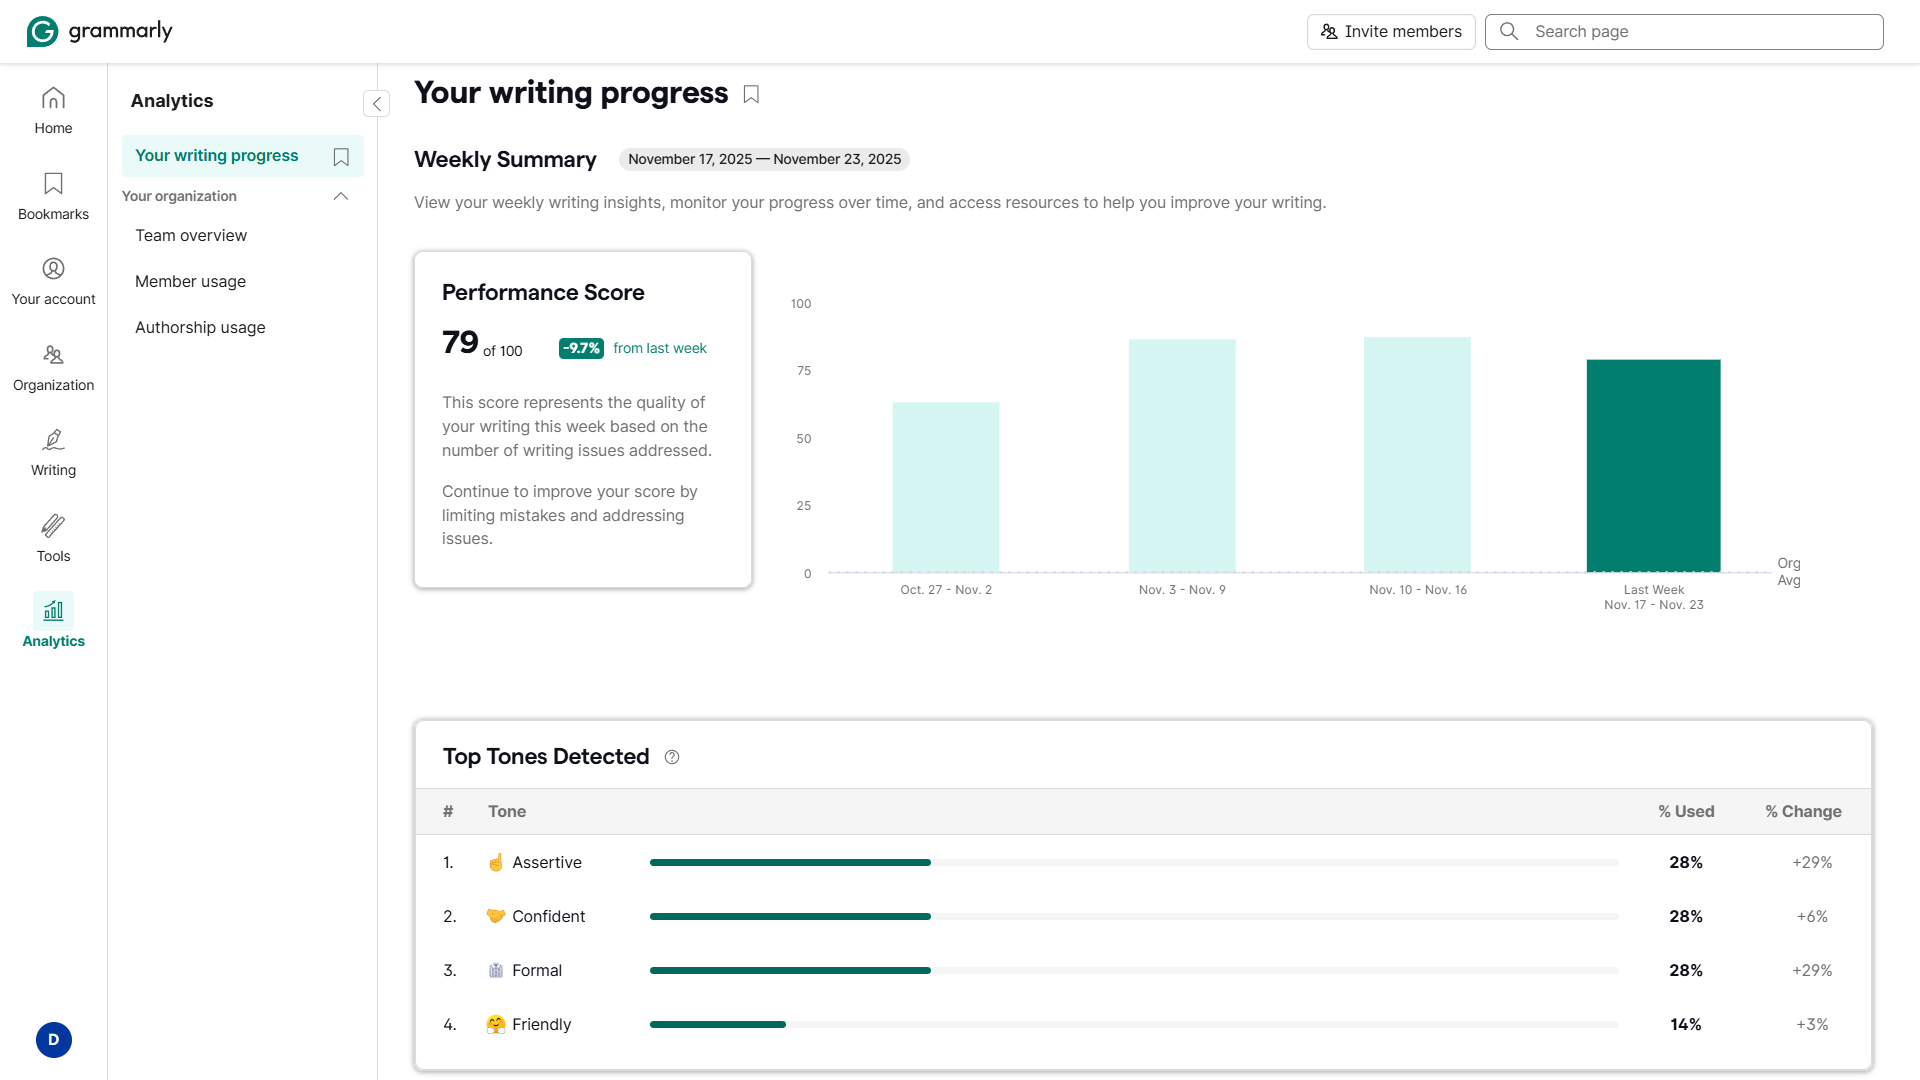
In the first case, we can now see analytics in platforms where we wouldn’t typically expect them. Grammarly, for instance, includes AI-assisted personal and team activity tracking.
In the second case, one of the big drivers of embedded analytics is the surge in dedicated tools. They essentially provide out-of-the-box functionality via an integration, with comprehensive SDKs and UI design dashboards included. This makes it easy for independent and smaller developers to add analytics and AI features. There’s no need for a dedicated development team.
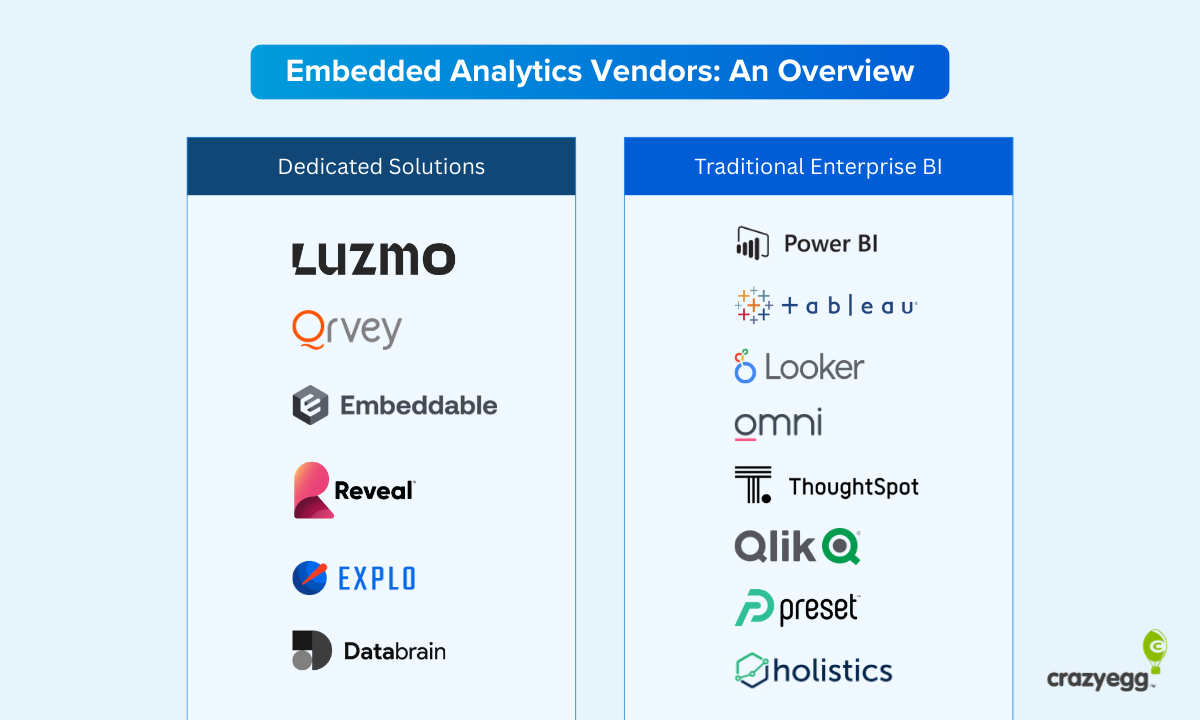
This is important because it means that AI-assisted analytics and insights are not exclusive to big brands with in-house software engineering teams. It’s normalizing granular analytics for small and point solutions. Insights are becoming the norm across the whole tech stack and at every point in the workflow.
Use Case: AI-Generated Summaries in Embedded Analytics
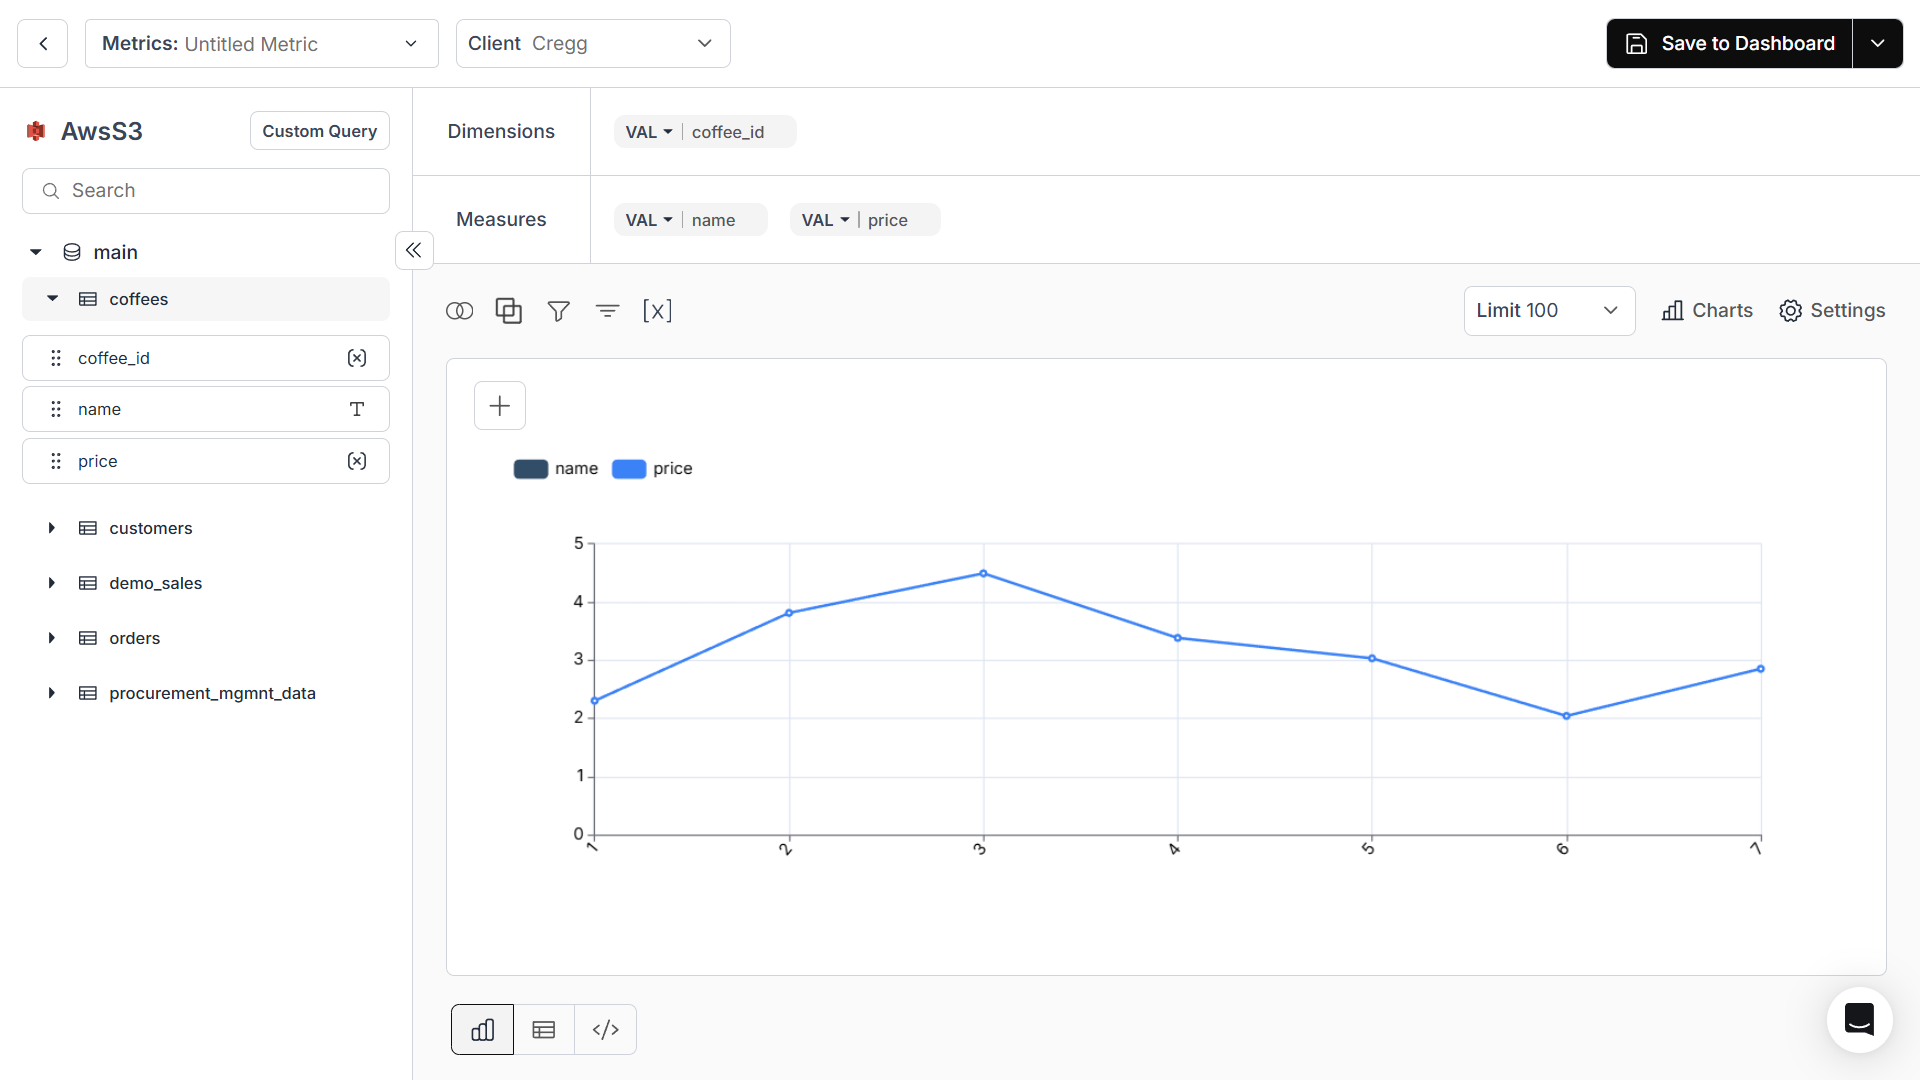
DataBrain is one of the new spate of embedded analytics solutions that have entered the market in the last two to three years. Developers can add AI-enhanced embedded analytics to their apps with ease.
Its users simply connect a data source, design charts for their dashboard, and then integrate it using web components. Configuration along the way is somewhat technical, but the process takes a fraction of the time and cost of building an in-house solution.
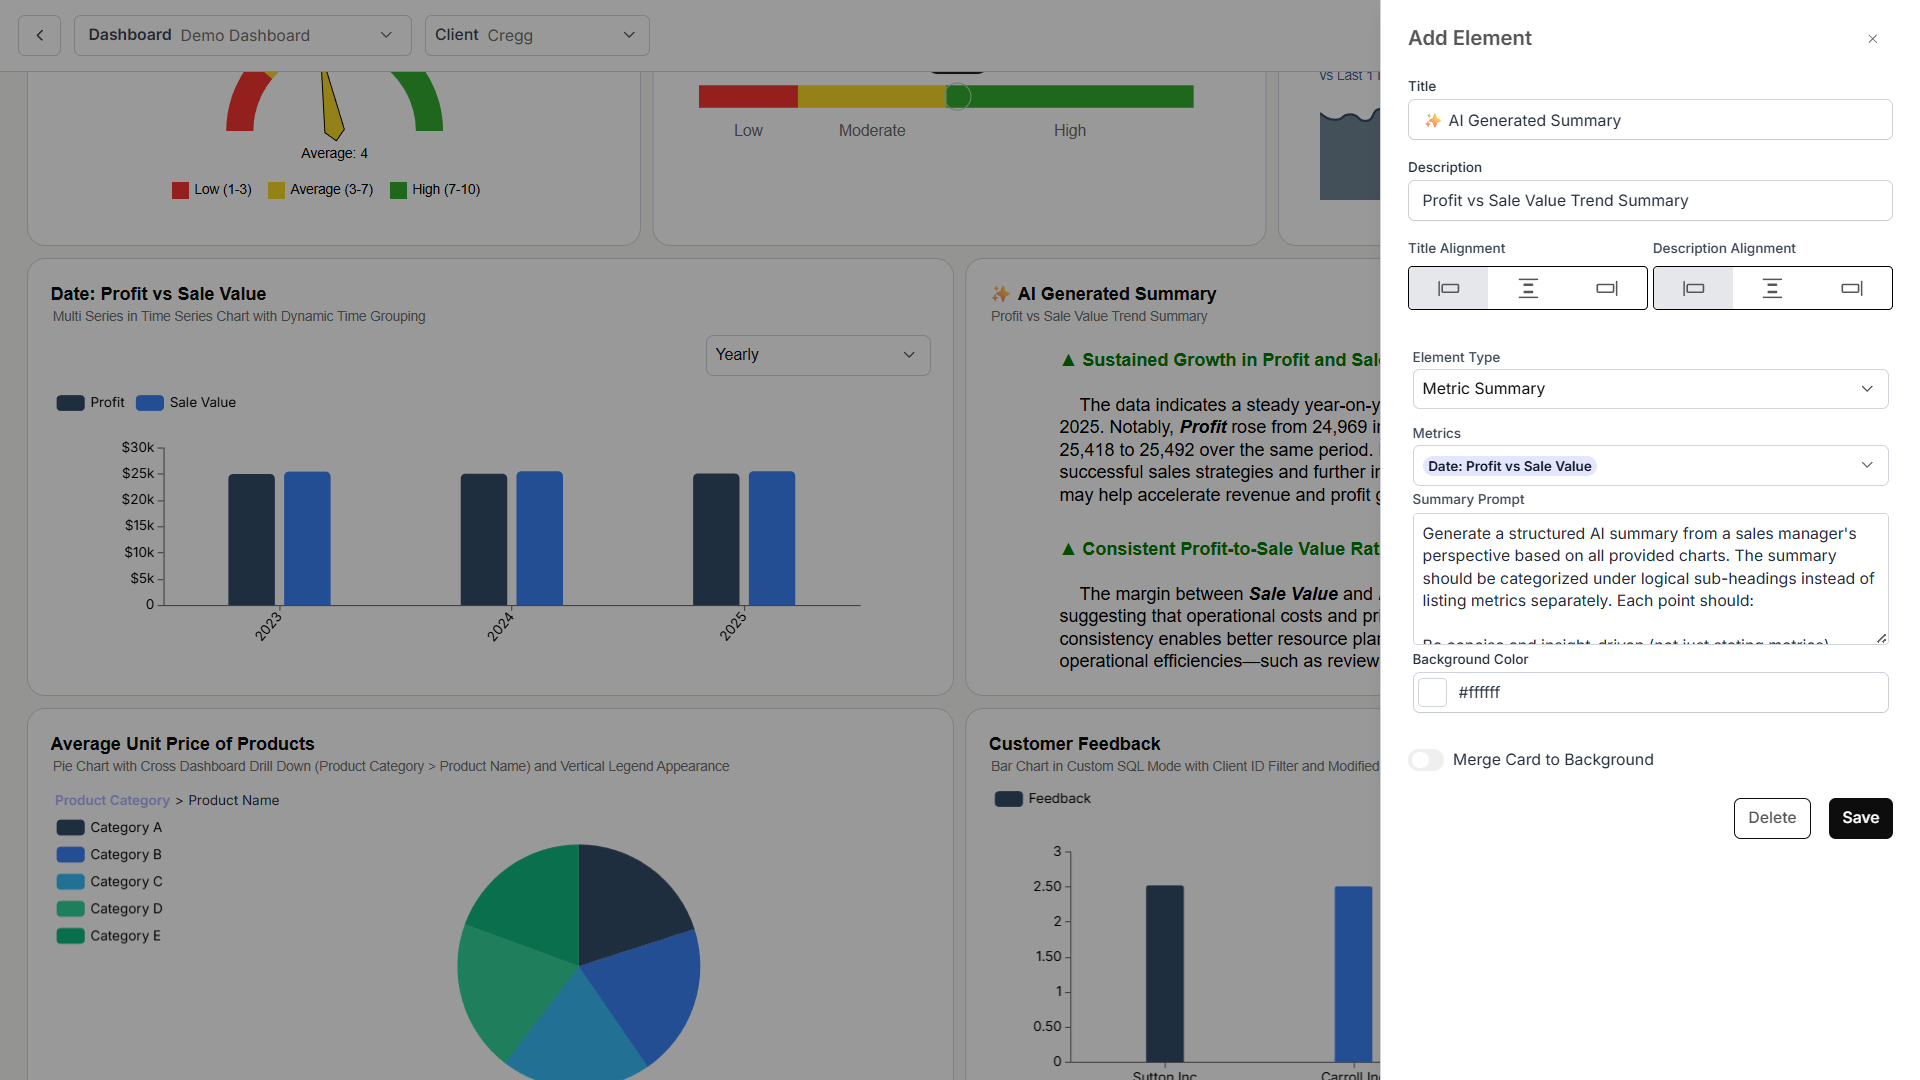
DataBrain, like many of the solutions in this space, offers AI functionality like metric summaries that providers can make available to their customers. The focus is on drawing data points together and presenting useful insights that can be acted on.
CEO Rahul Pattamatta told me that the “biggest shift is the ability of non-technical users to ask more questions from the data, which was previously gated by a team of data analysts. AI has allowed synthesis of insights easily.”
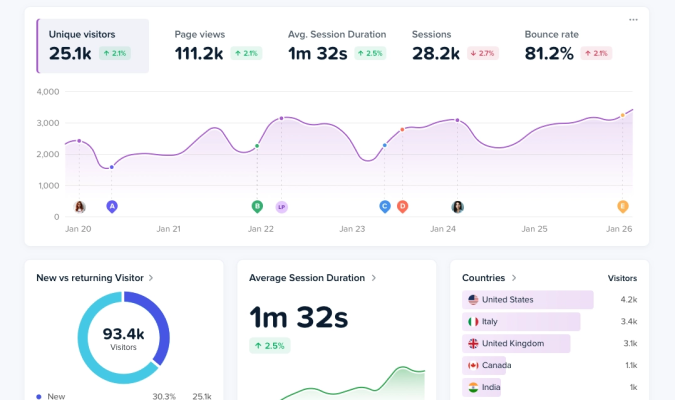
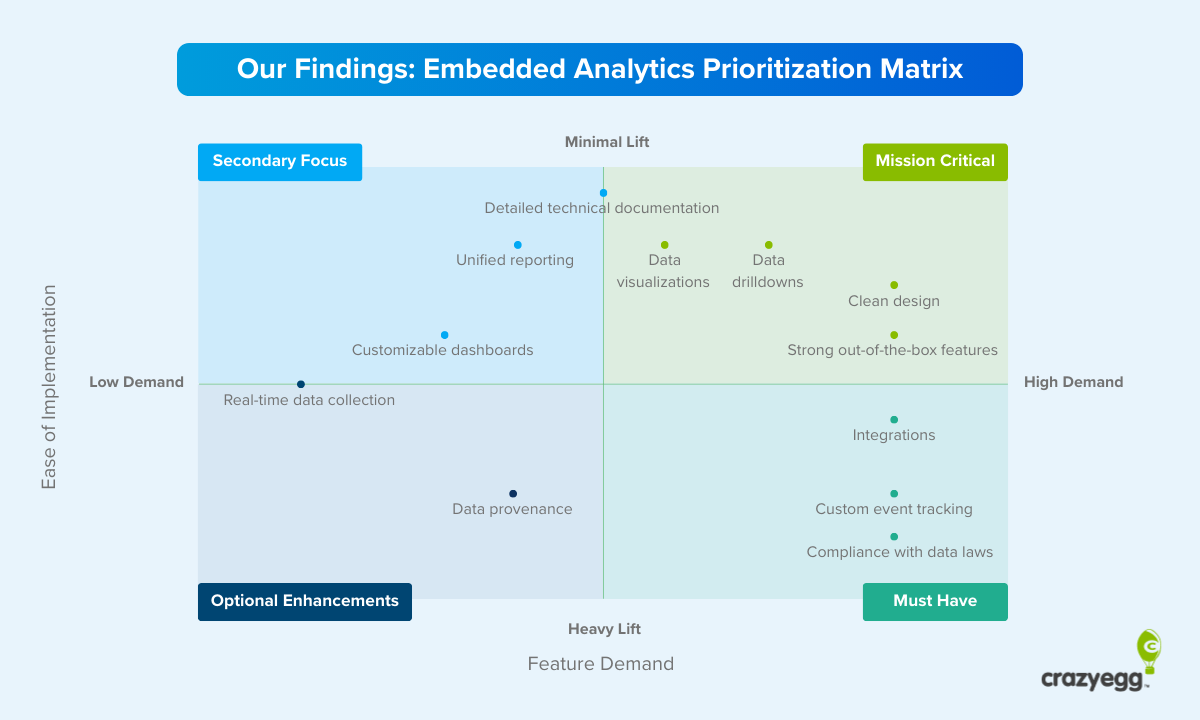
Rahul also believes that “crisp presentation and storytelling beat giant dashboards always.” This fits with research conducted by CrazyEgg into what end users are looking for in digital analytics dashboards and is something that embedded analytics tools, with their easy-to-integrate data storytelling features, make possible.
4. Reporting at the Surface of the Workflow
Analytics is moving closer to the surface of work, appearing at all stages of app workflows where data is relevant to granular decision-making.
According to Hiten Shah, “Insights are showing up inside editors, experiments, and workflows rather than isolated dashboards.” This matters “more than any model improvement” because it presents potential action steps while decisions are being made and “determines whether insights actually get acted on.”
To find an example of how ubiquitous this is becoming, I only needed to look at the apps currently open in my browser as I was writing this article.
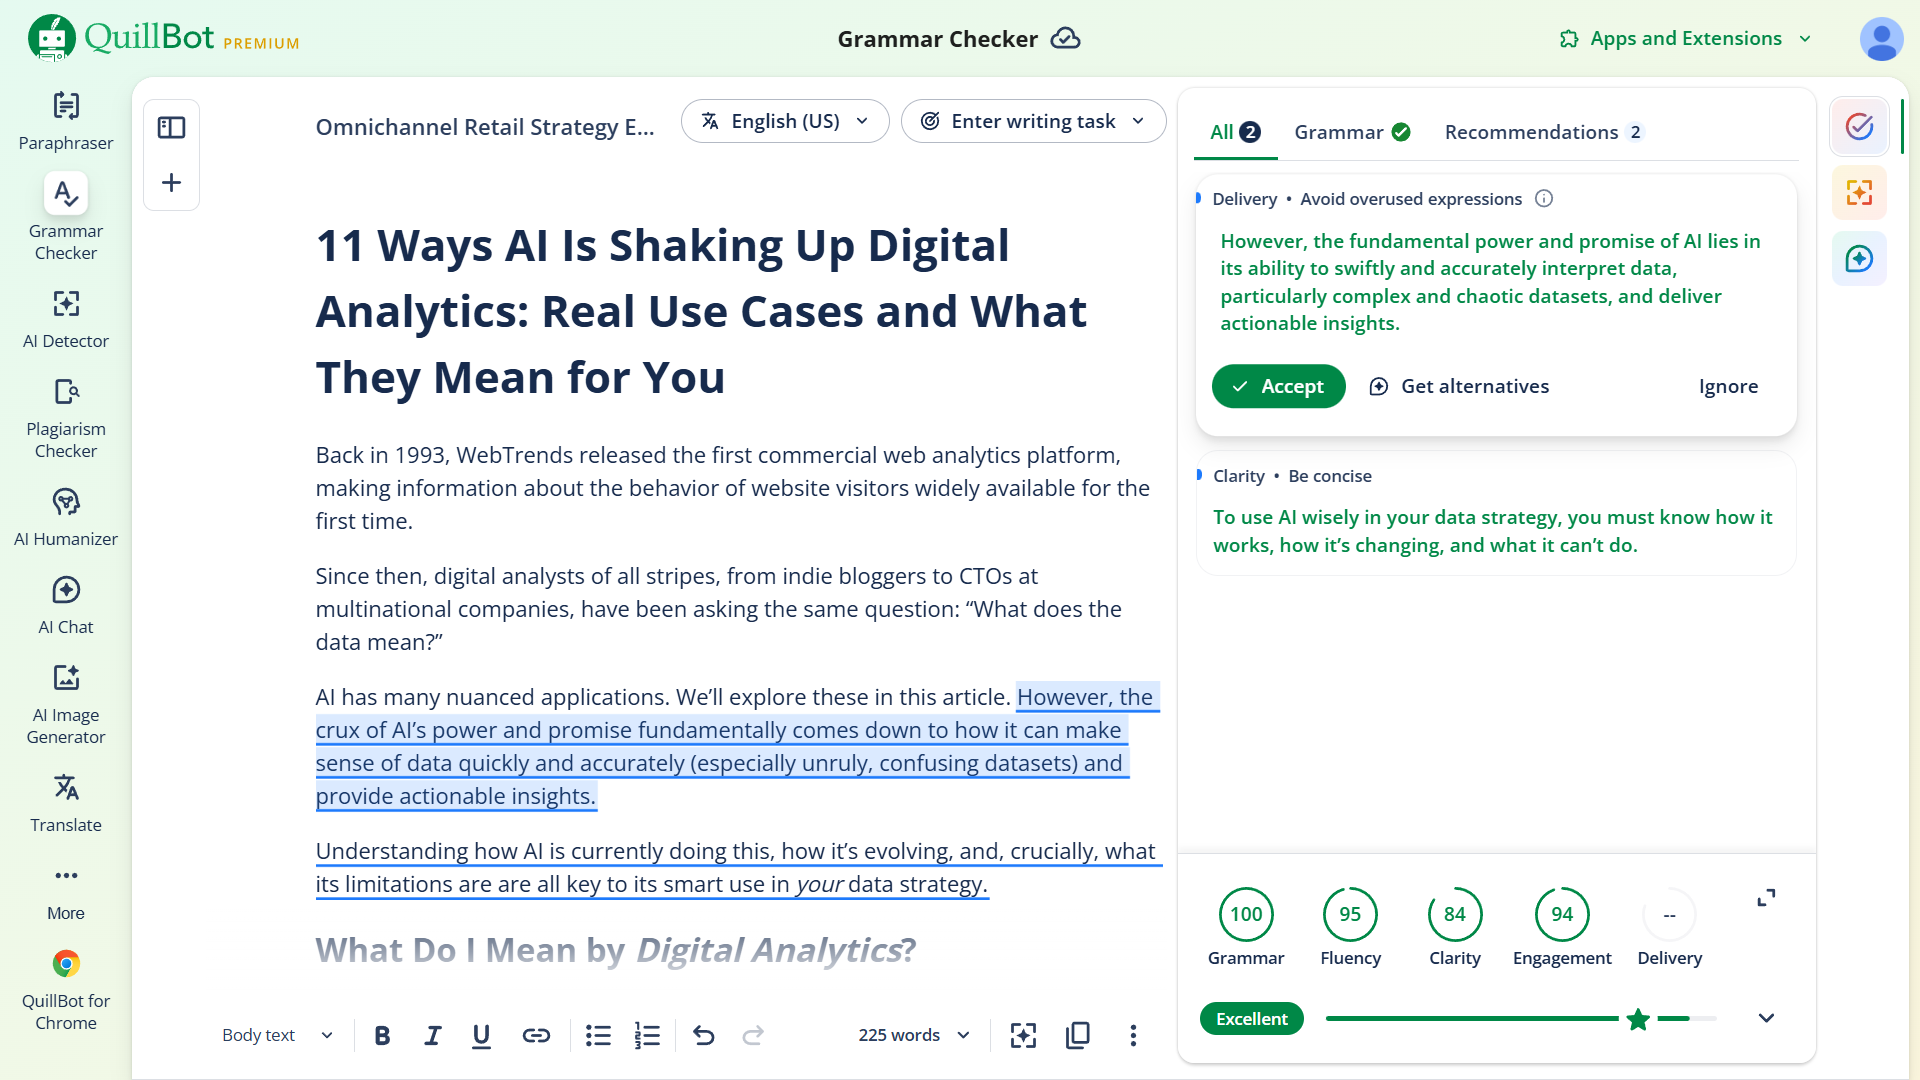
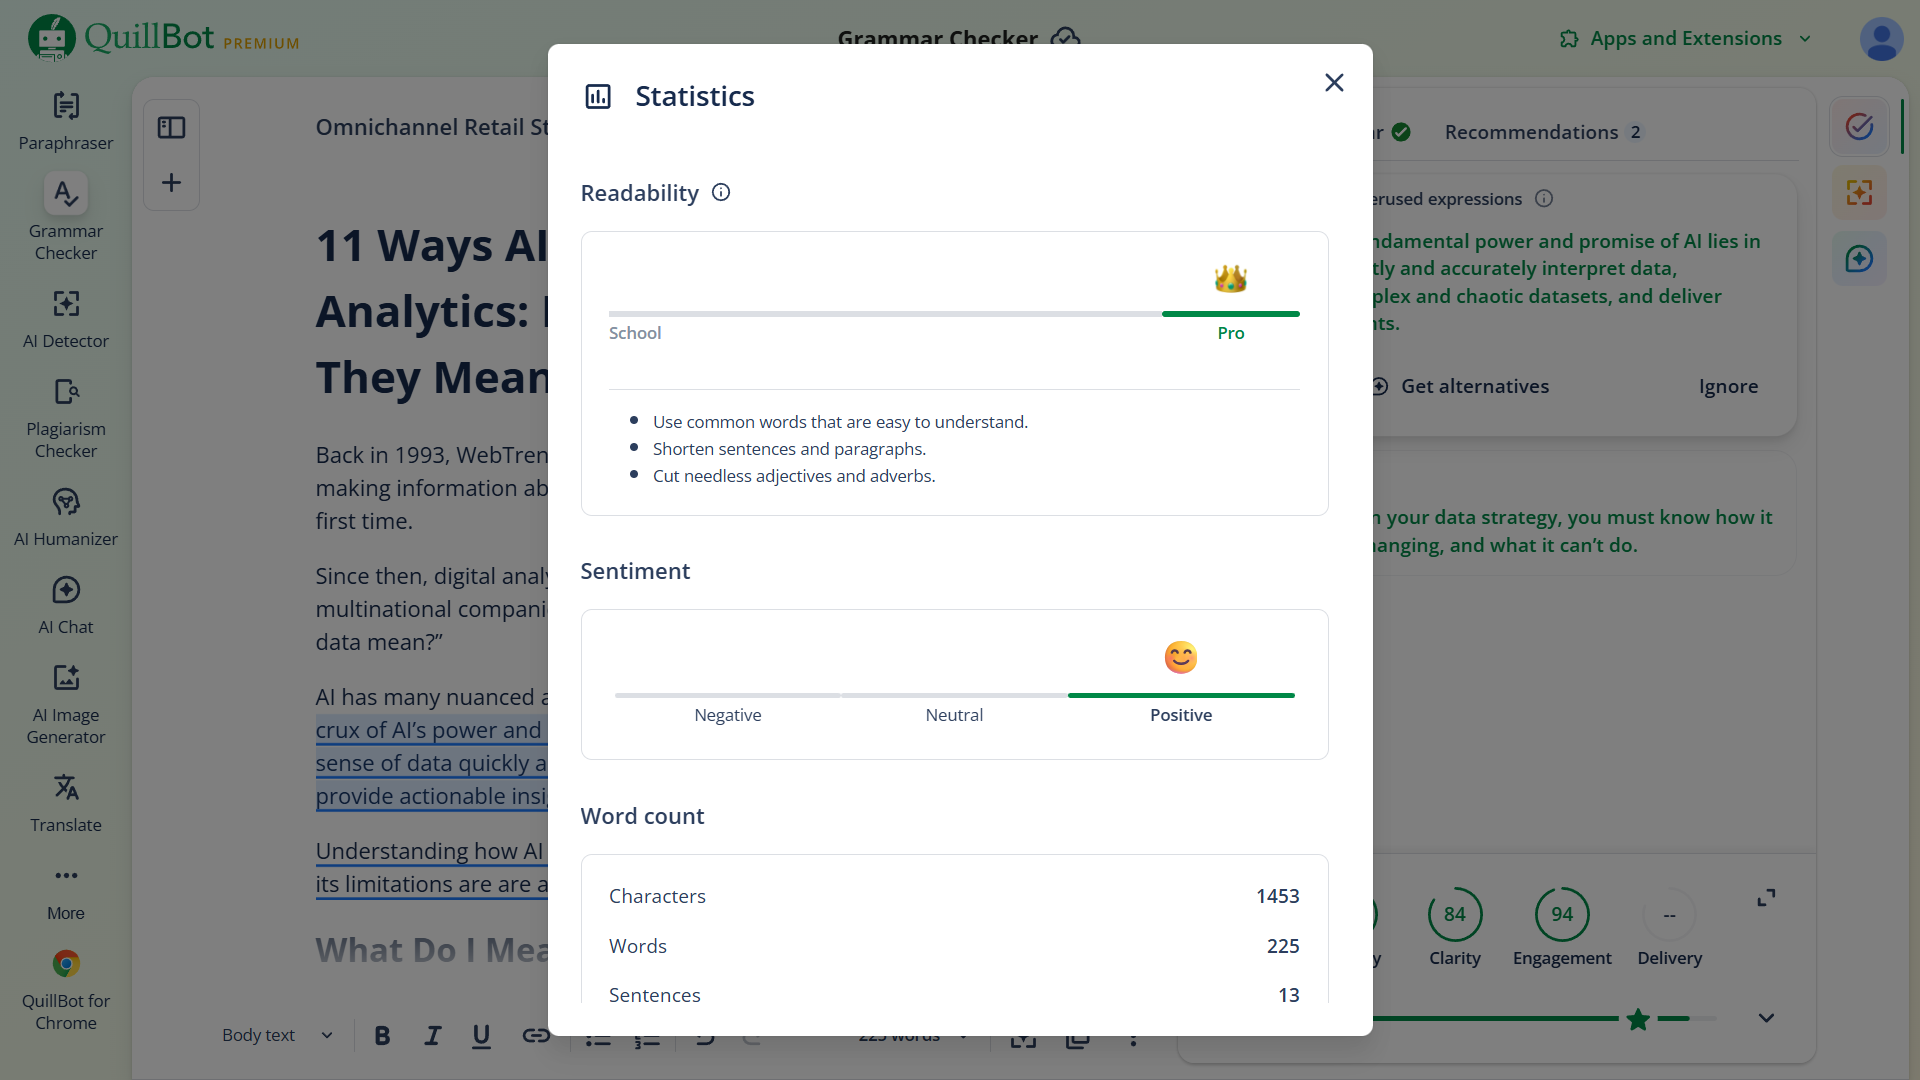
QuillBot (my grammar checker of choice) analyzes my work as I write it, calculating different quality scores and suggesting how I might optimize it. Like by cutting adjectives and adverbs.
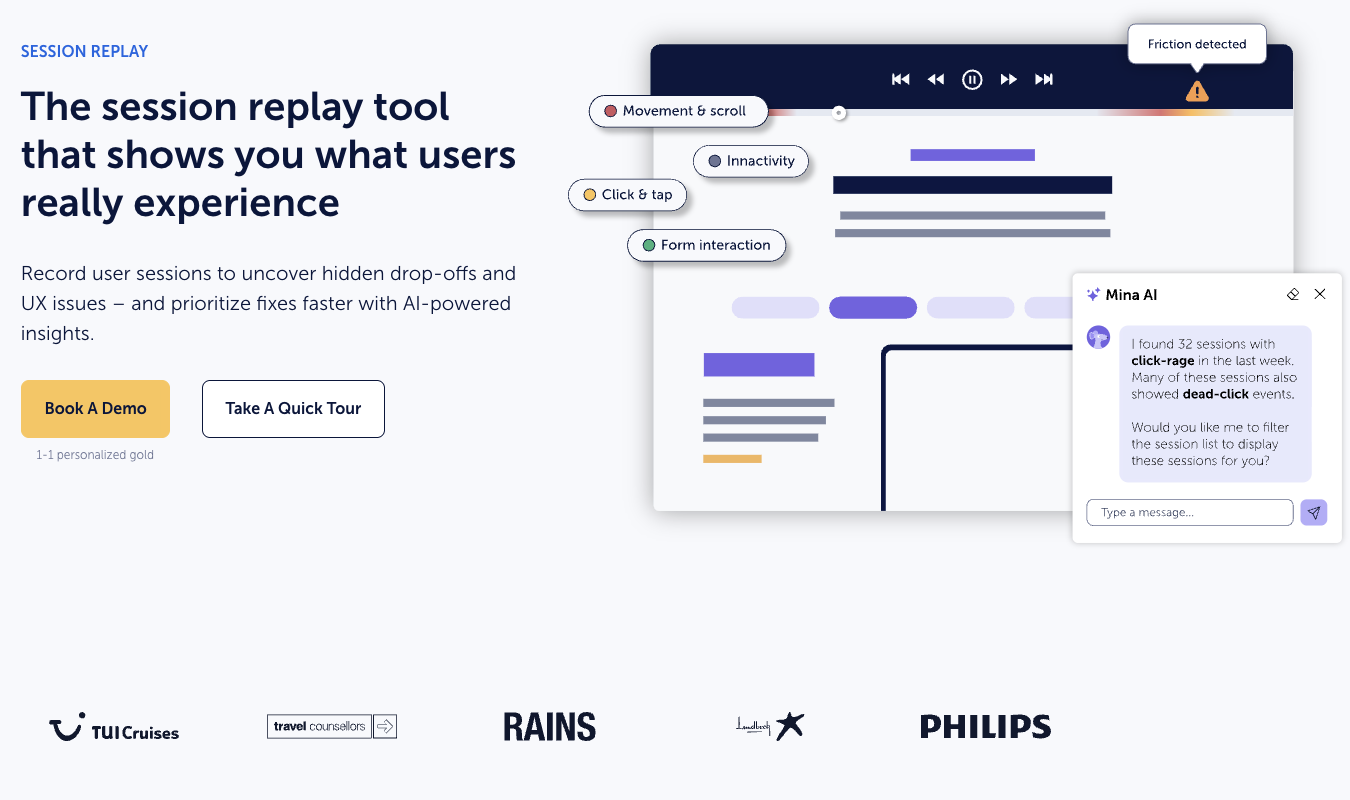
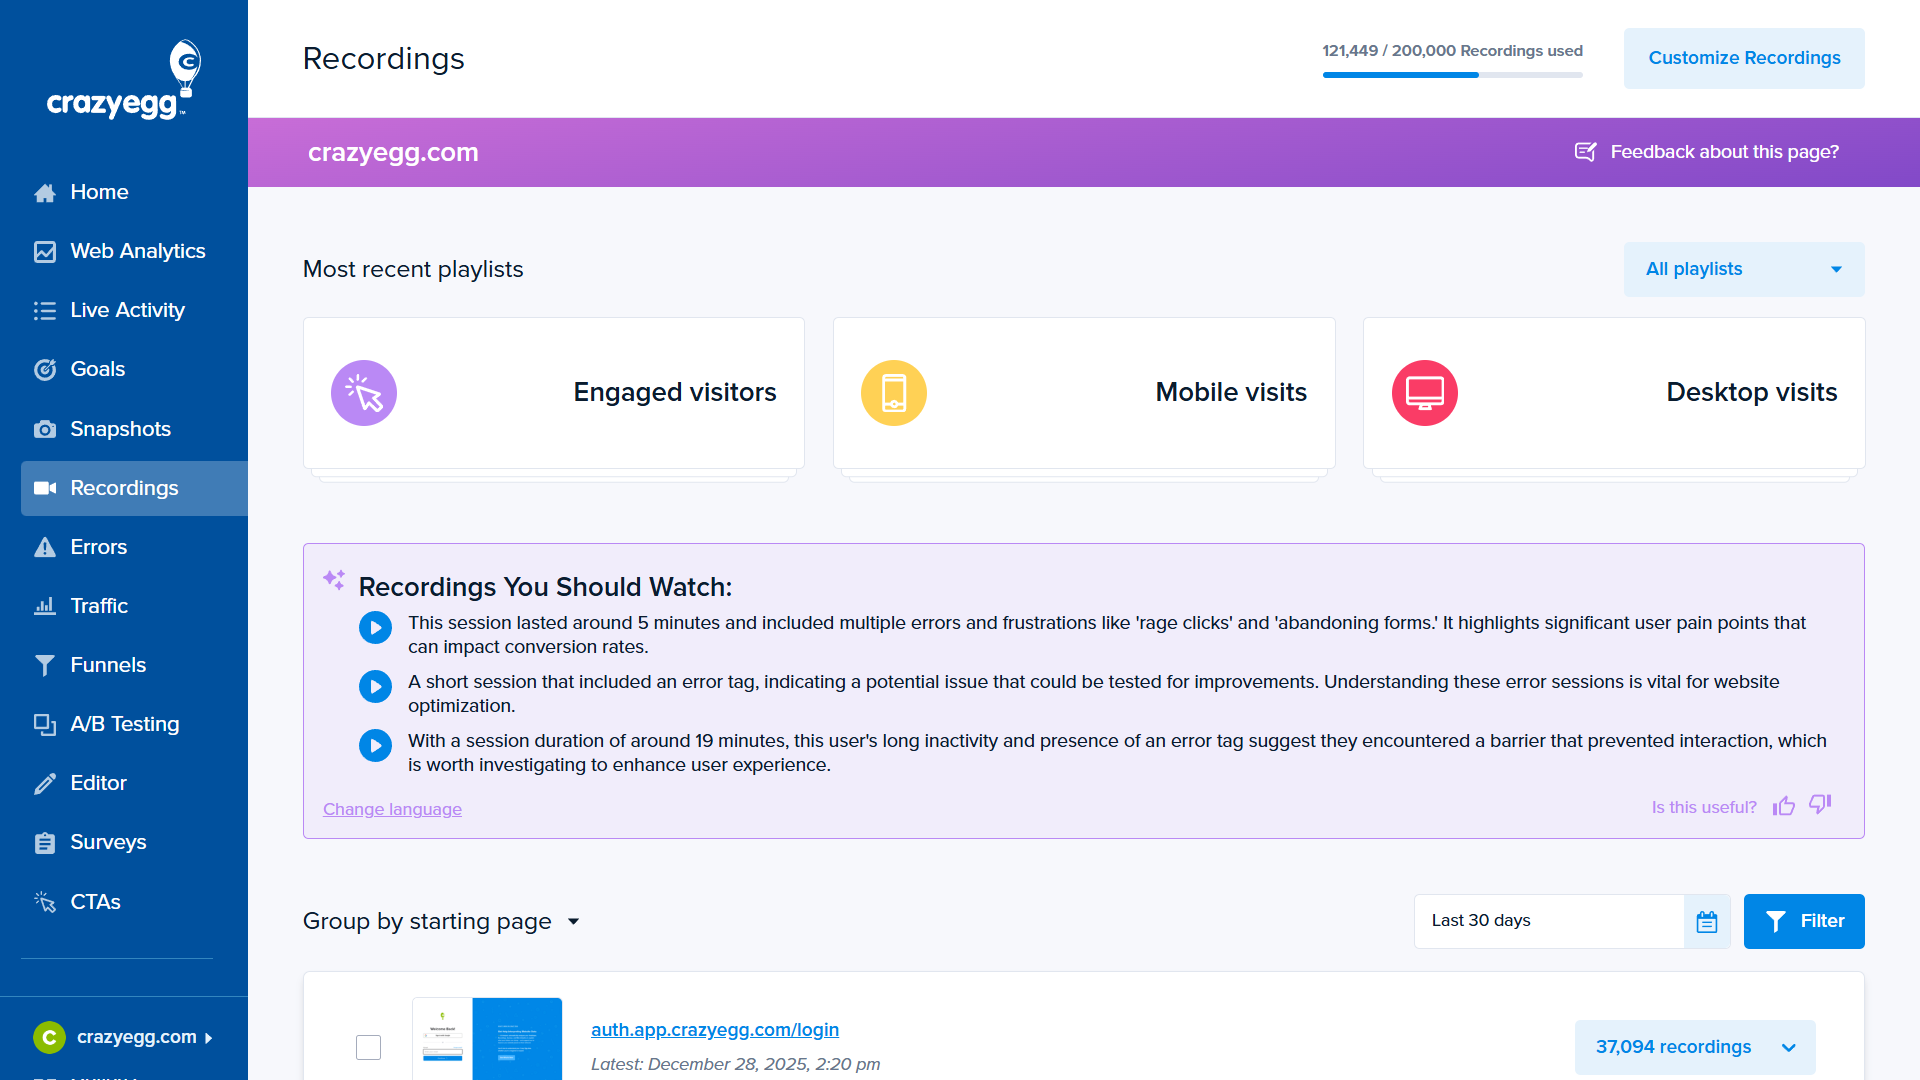
Crazy Egg features also demonstrate how AI integrates directly into the decision-making flow. For example, suppose a user reviews landing page analytics every month. After one review in which they see an unusually high number of drop-offs, they decide to check user session recordings. Their goal in this case is to use insights gleaned from these recordings to optimize for a lower bounce rate.
This may typically have involved trawling through dozens of uninformative sessions. However, AI instantly surfaces recordings with key insights in the User Recordings panel. The user can review the AI summary and, if appropriate, prioritize these sessions. There are even auto-generated blue play icons for accessing them. If they feel they have enough information to begin A/B testing after watching, they have potentially cut hours from their workflow.
For product developers, the ability to improve customer experience is clear. For most apps, there will be a multitude of opportunities to surface specific insights that enhance choices while in the app.
This kind of reporting also opens data analytics up to non-data professionals in a meaningful way. It’s possible for employees with a minimum of analytics experience to make use of data insights, thereby improving the quality of their work.
5. Qualitative and Quantitative Convergence
Companies are prioritizing the collection of zero-party data. Cookie deprecation and stricter privacy laws (such as GDPR and CCPA) have been a key driver. As has the declining reliability of inferred data (in which intent is guessed). Tracking has become noisier, and attribution harder, from increasingly messy customer behavior patterns.
Now, previously ignored sources of first-party qualitative customer data—sales transcripts, customer service tickets, reviews, and the like—are also receiving greater attention.
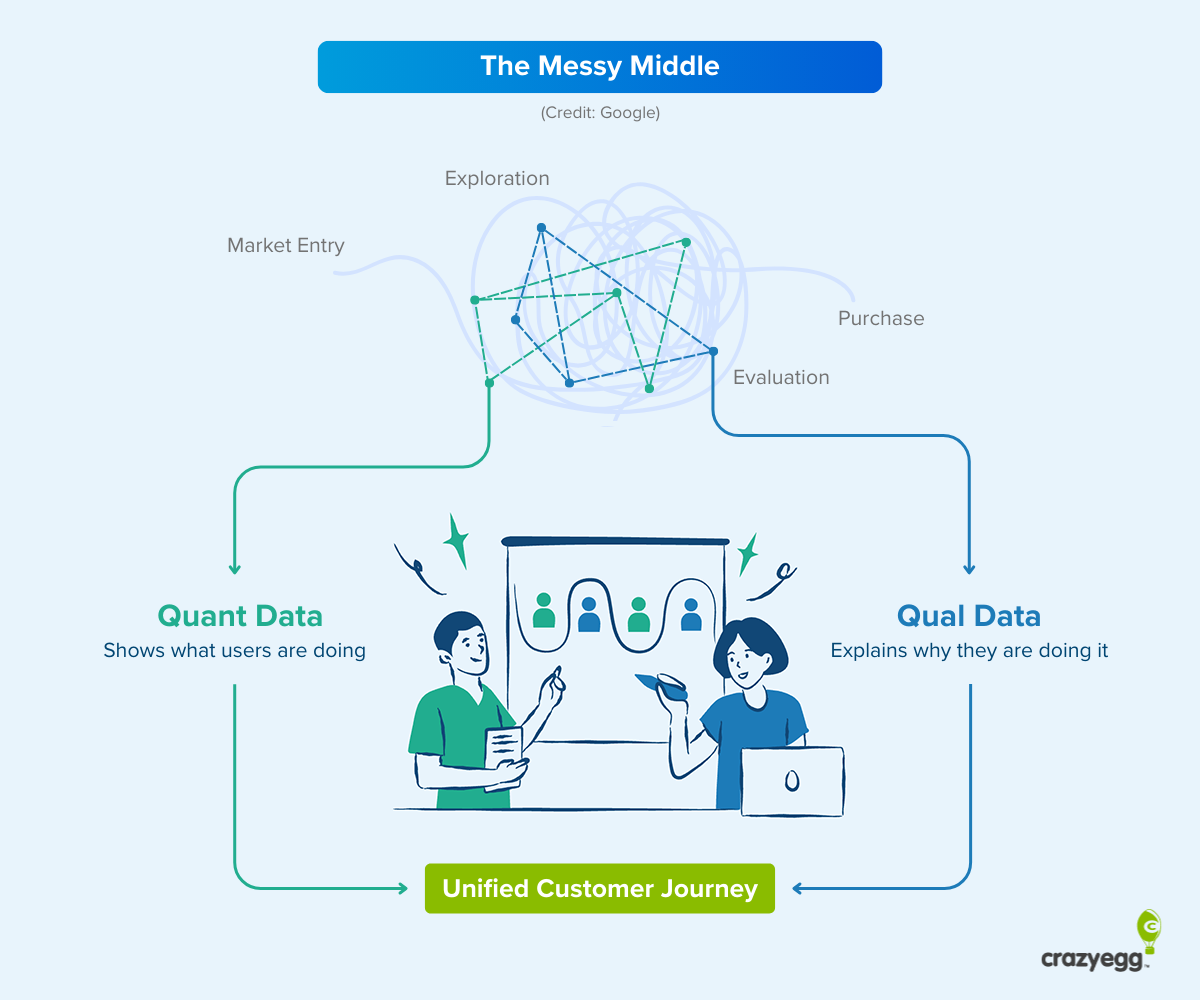
AI decodes this qualitative data in two ways. First, AI-supported natural language processing makes it possible to analyze vast amounts of text and draw out, categorize, and interpret useful information. Not just simple word counts (the traditional approach), but themes, context, and intent, all by virtue of the large datasets that LLMs are trained on and which enable contextual comprehension.
Second, AI is able to combine quantitative metrics, such as conversions, drop-offs, and engagement, with qualitative signals like session replays, survey responses, scraped intent signals, and so on. This makes it possible to reason across both, which is where real understanding lives. By mapping both quantitative and qualitative data onto shared representations, AI can identify correlations and connections. This links what users say with what they do, thereby making sense of complicated behavior that otherwise lacks context.
Use Case: Customer Feedback Analytics
Customer service tools like Qualtrics, Medallia, and Thematic have integrated AI analysis, allowing companies not only to collect data but also to sync disparate sets and extract insights. Moreover, there are safeguards in place to prevent hallucinations and oversights.
Thematic in particular is pioneering a combined quant and qual approach. CEO Alona Medelyan has spoken about avoiding “pre-canned taxonomies” in order to extract data that uncovers things that weren’t previously known.
AI was incorporated into Thematic data interpretation models after hallucinations became more manageable with careful prompt engineering and task separation after the release of GPT 3.5.
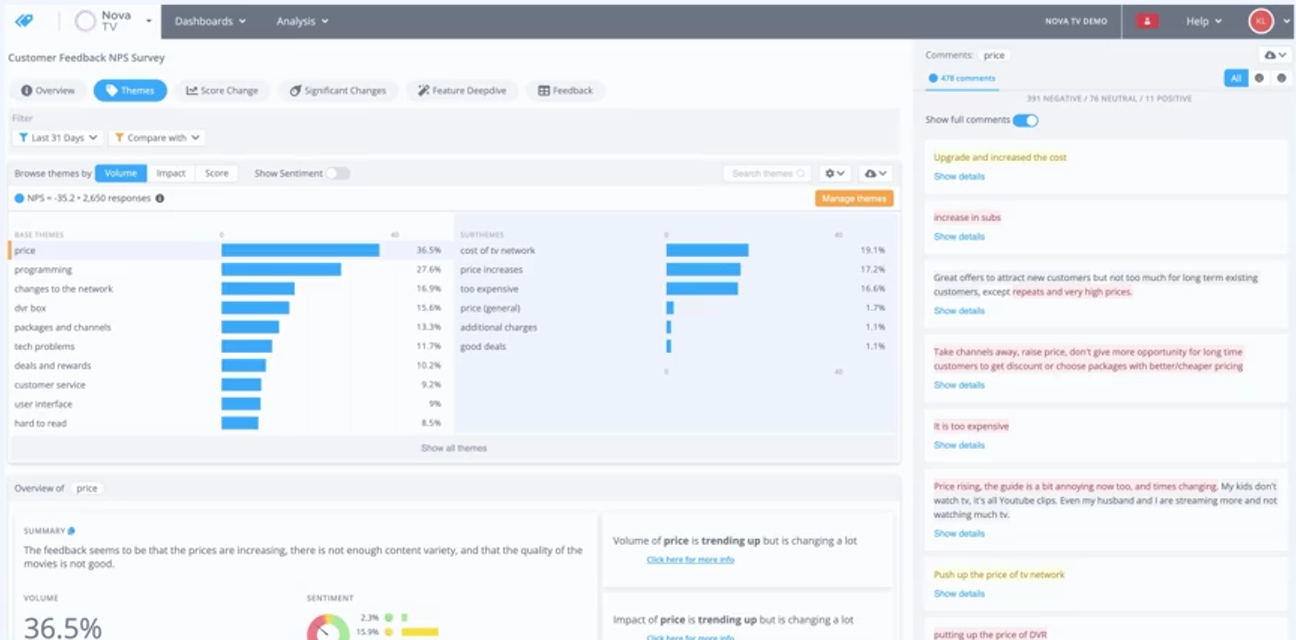
In addition, the AI is fully transparent. Users can see into the underlying process of how themes from text are created, modifying or disregarding as necessary. This thematic understanding is then automatically connected to qualitative metrics to provide a comprehensive explanation of why scores have changed and what they mean for the future.
6. Automated A/B Split Testing
A/B testing is something of a stock phrase in conversion optimization. It’s talked about a lot. But the process of generating, testing, and evaluating hypotheses is labor-intensive. Even for something as simple as a CTA change.
It also requires a nuanced familiarity with CRO and UX optimization strategy. In many cases, companies that do have the resources and traffic numbers to run tests often aren’t taking advantage of the opportunity. “It takes too long to set up, run, analyze,” was the third most common complaint among SMBs in a 2025 study on A/B testing.
Here’s an overview of how agentic AI is taking over this task and reducing manual work:
- Reviews existing web assets, pulling data from sources like Google Analytics and extracting page elements (like headers) using NLP and computer vision.
- Generates hypotheses about how changes to page elements will affect conversions, ranking them based on historical data.
- Automates the creation of alternative assets—platforms can now create images—for human review.
- Deploys these assets and runs A/B and multivariate tests, forming new hypotheses and repeating the process when winners emerge (platforms typically allow for upwards of 100 tests per month).
For CEO of Fibr.ai, Ankur Goyal, the power of agentic AI when it comes to split testing lies in the integration of different functions. He summed up the issue excellently in a LinkedIn post: “Every team has a tool for A/B testing. Another for personalization. One for analytics. None of them talk.”
This disconnection leads to hypotheses that aren’t fully tested and budgets that are wasted on subpar optimization. He believes the future of CRO lies in “end-to-end conversion platforms where data, decisions, and delivery are agentically connected.”
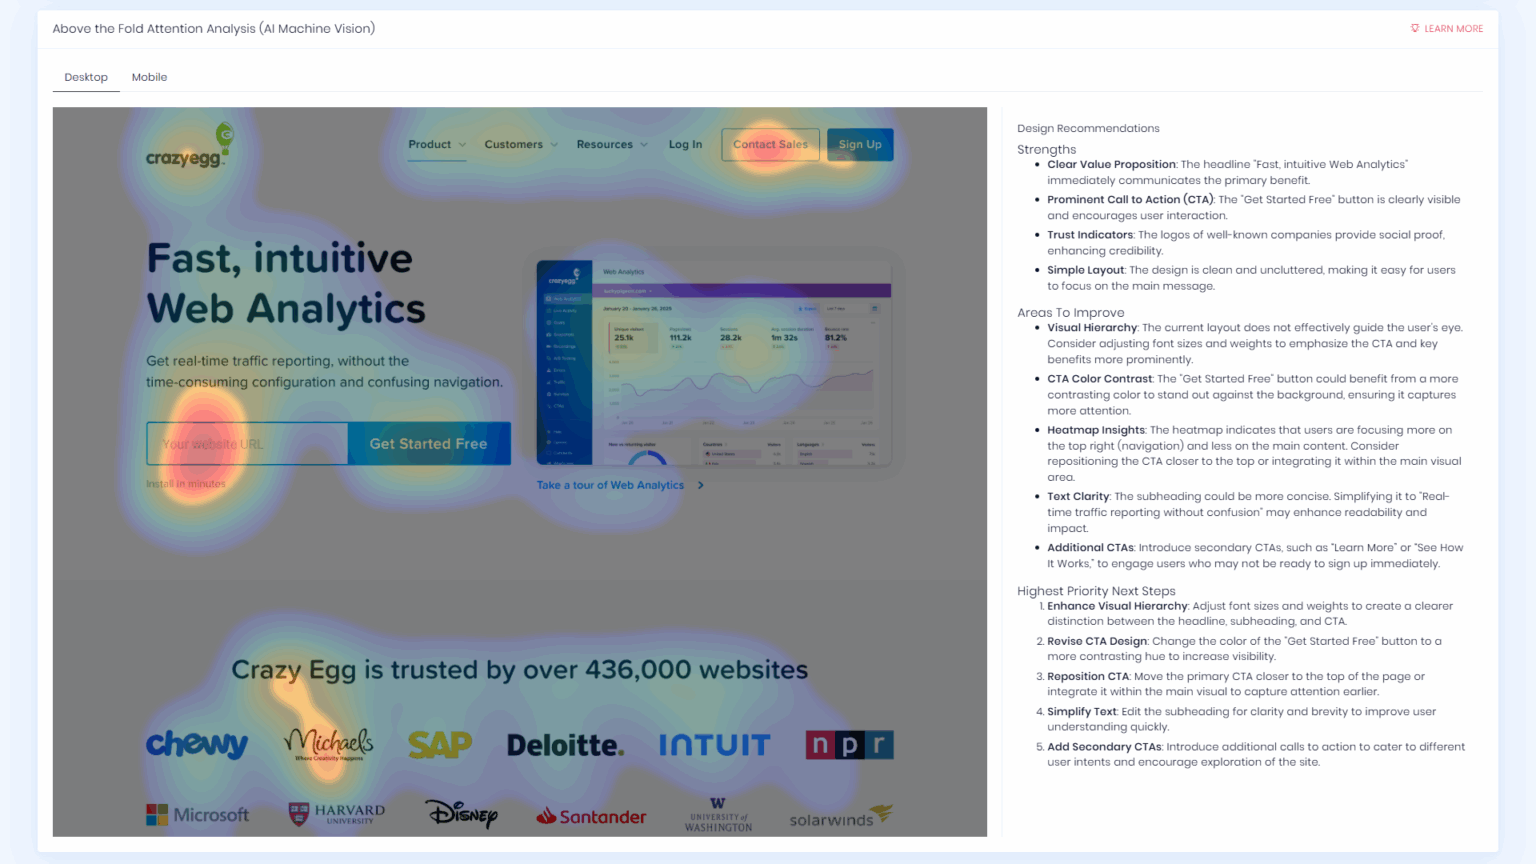
I have written about one aspect of this technology—landing page analyzers and their use of computer vision to make sense of visual hierarchies and form hypotheses (pictured above). I was unimpressed by the conclusions they generated. However, I do believe that the underlying technology holds a lot of promise, and I can only envision more companies taking notice as models improve.
Use case: Synthetic A/B testing
One emerging use case with incredible potential is synthetic A/B testing. AI agents interact with a customer asset (like a landing page) and mirror the demographic and psychographic behavior of a defined audience.
Amazon and a group of researchers ran a remarkable experiment with synthetic agents. The paper, published in early 2025, describes how agents accurately replicated the real human behavior of shoppers on Amazon:
“In a demonstrative controlled experiment, we employ AgentA/B to simulate a between-subject A/B testing with 1,000 LLM agents Amazon.com, and compare agent behaviors with real human shopping behaviors at a scale [sic]. Our findings suggest AgentA/B can emulate human-like behavior patterns.”
As synthetic testing becomes widely available—most likely through dedicated tools—it will allow for UX and CRO testing without the need for live audiences. This will enhance the quality of human A/B tests with more rigorous hypothesis iteration and open up testing to companies that don’t have high volumes of traffic.
7. Autonomous “Closed Loop” Analytics
AI tools that can execute full workflows autonomously are gradually entering the market. Although these systems are currently limited to relatively modular applications, they are viable.
Google Ads’ “Smart Bidding” engine, which uses machine learning to interpret contextual signals and optimize bid amounts for defined outcomes (like conversions), is one of the best-known examples.
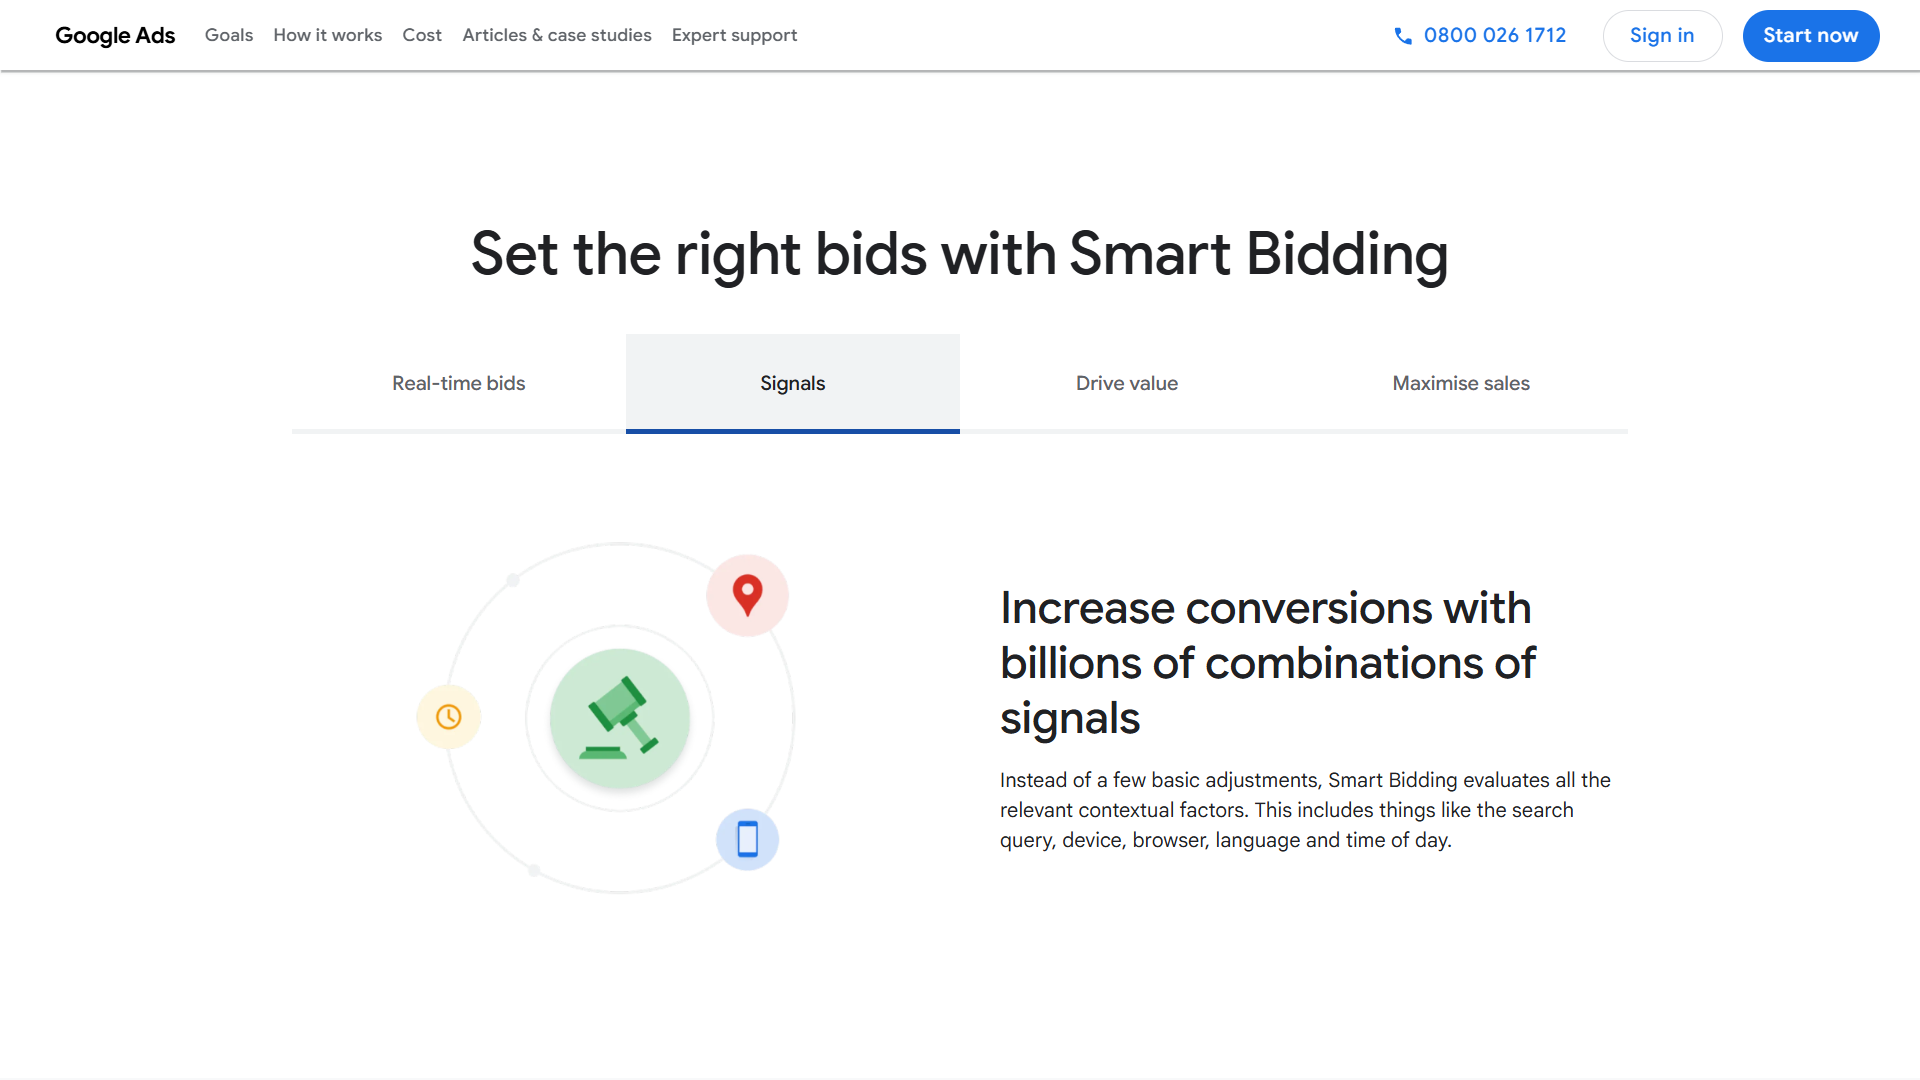
“Over time, as trust, reliability, and accountability mature, parts of the human-in-the-loop paradigm will close. Analytics will move from informing action to safely taking limited action on its own,” says Hiten.
“Trust” and “reliability” are the key words here. The issue with AI (and this applies particularly to analytics) is that models can be accurate on average but also unreliable, as they occasionally make big mistakes. However, guardrail and internal correction systems that target issues like hallucinations are one of the top priorities for AI companies.
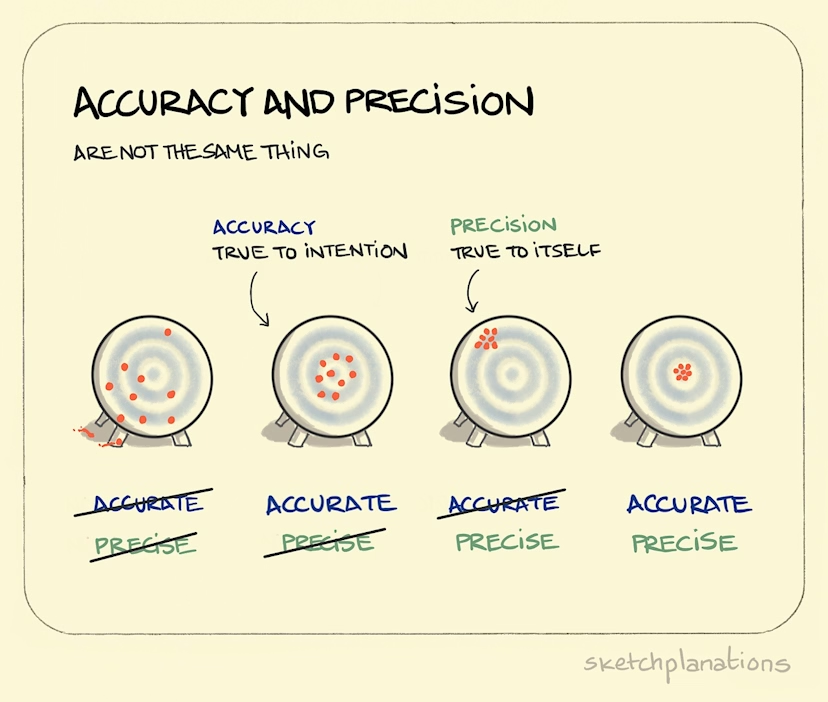
In an article titled The 9s of AI Reliability, Kushal Chakrabarti highlighted one of the central problems currently preventing wide-scale AI adoption—the disconnect between accuracy and reliability.
Kushal describes it like this:
“Roughly, accuracy is hitting the bullseye on average but reliability is hitting the same spot repeatably. You can be unreliably accurate (centered on average but inconsistent), reliably inaccurate (consistent but off-center) or any of the other combinations. The AI industry has been optimizing for accuracy. Economics demands reliability.”
The graph below from Sketchplanations (precision and reliability are synonymous) explains the concept well:
Hiten Shah also echoed this sentiment when I spoke to him: “Trust and interpretability are becoming first-order concerns. As AI takes on more judgment, teams care less about how clever the model is and more about whether its reasoning is legible and defensible. Analytics that can’t explain itself will quietly stop being used.”
What These Data Analytics Trends Mean for Your Organization
What do all these innovations mean for your business?
There are many shiny new features. However, as Crazy Egg CEO Hiten Shah rightly likes to point out, “If a metric doesn’t drive a different action, it’s clutter.” AI-assisted or not, digital analytics tools are only as valuable as the action they drive.
Here’s a checklist for making use of these new technologies effectively:
- Integrate AI processing into your custom data workflows. Data processing—imputation, deduplication, enrichment, etc.—is currently one of AI’s most powerful use cases. Begin by identifying the most labor-intensive tasks in your data workflows, then use an AI preparation tool to automate or semi-automate discrete processing tasks, working down from the biggest bottlenecks. For instance, you might enrich missing fields in lead profiles at CRM ingestion prior to routing to sales.
- Measure embedded analytics by how well they shorten decision-making cycles in operational roles. The beauty of embedded analytics in point solutions is that they allow non-data specialists to make informed decisions while undertaking granular work. Copywriters can improve newsletter quality, for example, and graphic designers can simulate engagement with a set of images before picking one to post on social media. Review tech stacks with employees and ask where metrics and insights offer genuine value. Then measure their effect on decision-making by tracking actual time spent on the tasks in which they’re used.
- Combine high-quality qualitative and quantitative data. Pick your best sources of qualitative customer data—for example, customer support tickets or sales transcripts. Use your AI tool of choice to review them for themes and sentiments over the previous 6 to 12 months. You can then join these with quantitative metrics about the same user groups—such as churn rates, win rates, and deal cycle lengths—to extract insights. True value lives in the combination. If you’re relying exclusively on quantitative data, you’re missing important context. If you’re over-focused on qualitative data, you don’t have a complete picture of the behavior.
- Create SOPs so that employees who aren’t data specialists can integrate AI-generated data insights into decision-making. These should include guidance about which in-dashboard action steps to follow from AI dashboard widgets and when to interrogate suggestions via AI chatbots. Importantly, stipulate when suggestions always require human oversight and verification.
- Experiment with automated A/B hypotheses. It’s still early days for agentic A/B testing, but that doesn’t mean you shouldn’t be familiarizing yourself with current capabilities. Cautiously experiment with automation tools, focusing on hypothesis creation initially. In addition, allow for auto-adjustments of low-risk elements, like headlines and CTAs, but lock pricing, offers, and broader messaging out of automation. Also keep a close eye on synthetic testing as platforms come out.
Adapting to AI is, of course, an ongoing, imperfect process. That said, analytics innovations tend to fall into one of three categories—insights, processing, and testing. The best way to ensure you’re up-to-date with the latest AI has to offer is to continuously ask how your analytics-based tasks are improving across all three of these areas.