Until You Can See, You're Blind
Crazy Egg organizes the wealth of valuable data we collect into several different formats with our leading visualization tools
Free 30 day trial • Cancel anytime
Leader in Visual Website Analytics and Heatmaps
When you look at your company’s website with a discerning eye, you may think you’re seeing the whole picture. Yet hidden on all your web pages, constantly accumulating and changing, are thousands of crucial data points that represent valuable insights which could improve your website’s success — and your revenue.
Wouldn’t it be amazing to reveal all this data? Now it’s possible. Like a pair of x-ray glasses, Crazy Egg lets you see exactly what people are doing on your website by overlaying their actions — as beautifully visualized data — directly on top of your web pages!
Once you unlock and visualize this data, such as where your visitors click most (and where they fail to click), you will begin to see new opportunities to design more effectively, streamline user flows, and apply optimizations that can dramatically raise your conversions and improve your UX.
With Crazy Egg, you will:
-
Get priceless insights for high-ROI changes
-
Use your web budget much more effectively
-
Make a great case for prioritizing your redesign
-
Speed up your user testing and analysis process
-
Show your boss that your changes worked
-
Enjoy more conversions and better engagement
-
Harness the full power of your visitors
Crazy Egg organizes a wealth of valuable data into the following visualization tools:
What’s Hot and What’s Not?
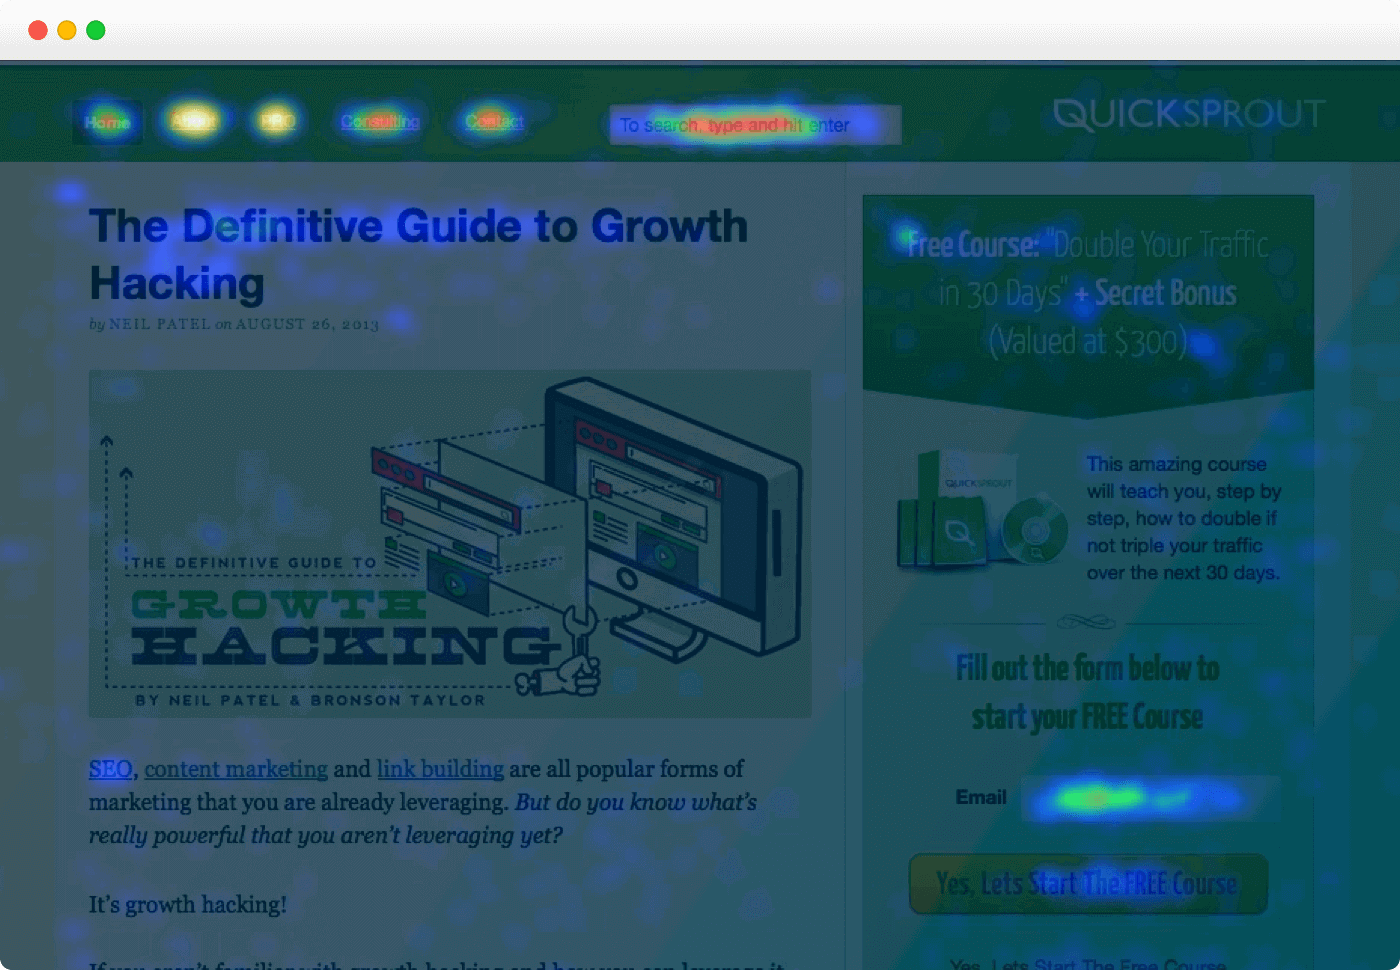
Heatmap, our signature tool, displays exactly where visitors focus their attention, and where they don’t. The areas users click on most are a bright yellow, and the colors beautifully fade down to dark blue and black where users aren’t clicking at all.
When you know what your users are doing, you can modify or redesign your pages to place your most important and profitable links and buttons where you know their attention is focused.
Learn More About Heatmaps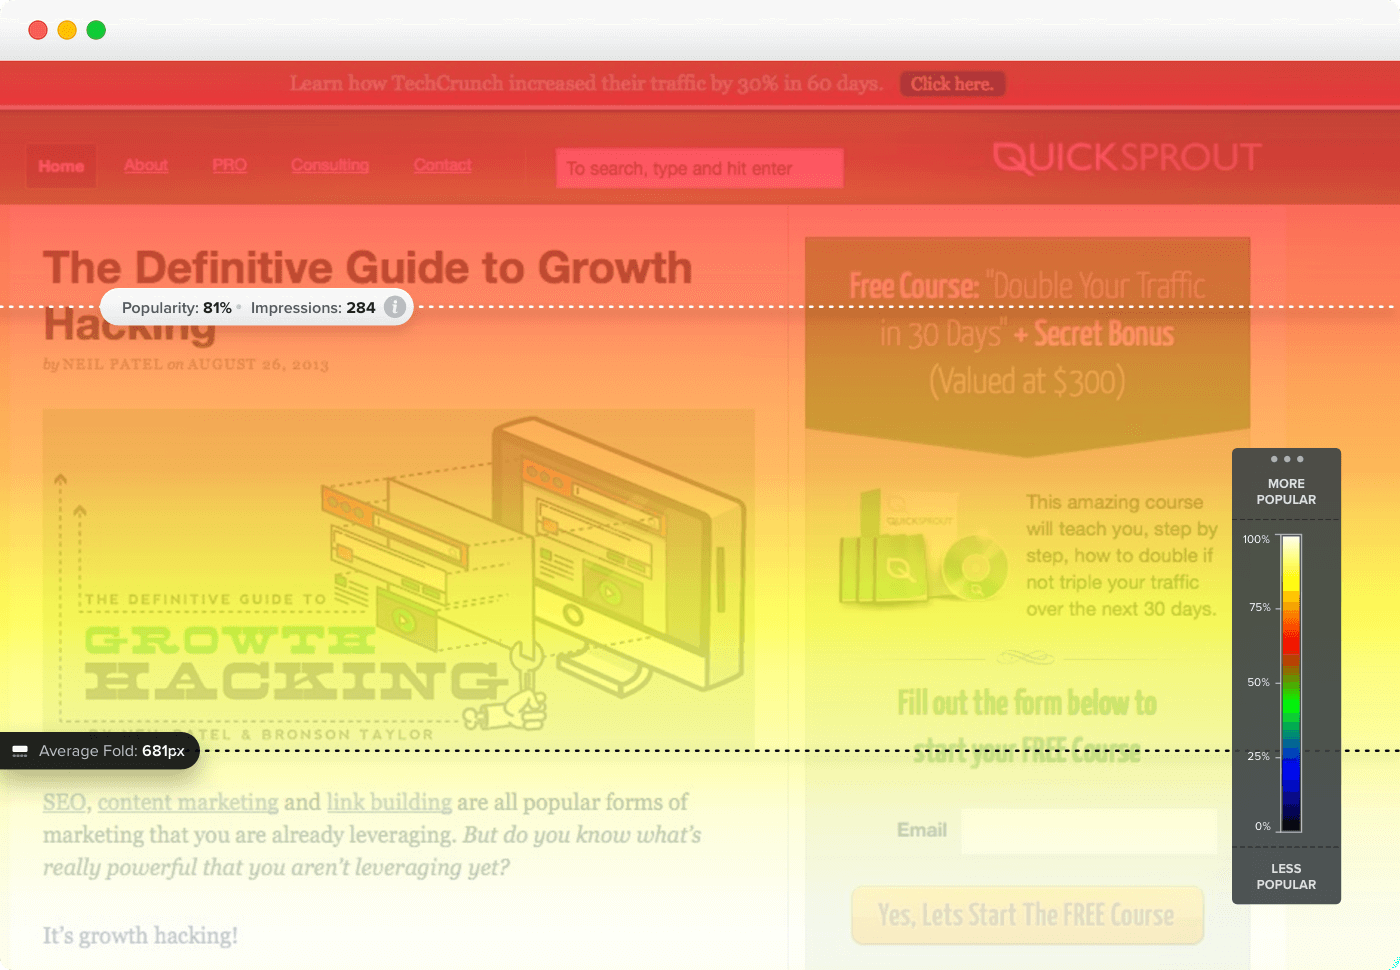
Find Your Sweet Spots with Scrollmap
Scrollmap shows you how interested your visitors are in your content, or aren’t.
By being able to see what part (or parts!) of your web pages most of your visitors scroll to, you can find the sweet spots that should display your most important or profitable calls to action.
Learn More About ScrollmapsImprove your clients website experience. Increase your revenue.
Free 30 day trial • Cancel anytime
Ridiculously Easy
A/B Testing
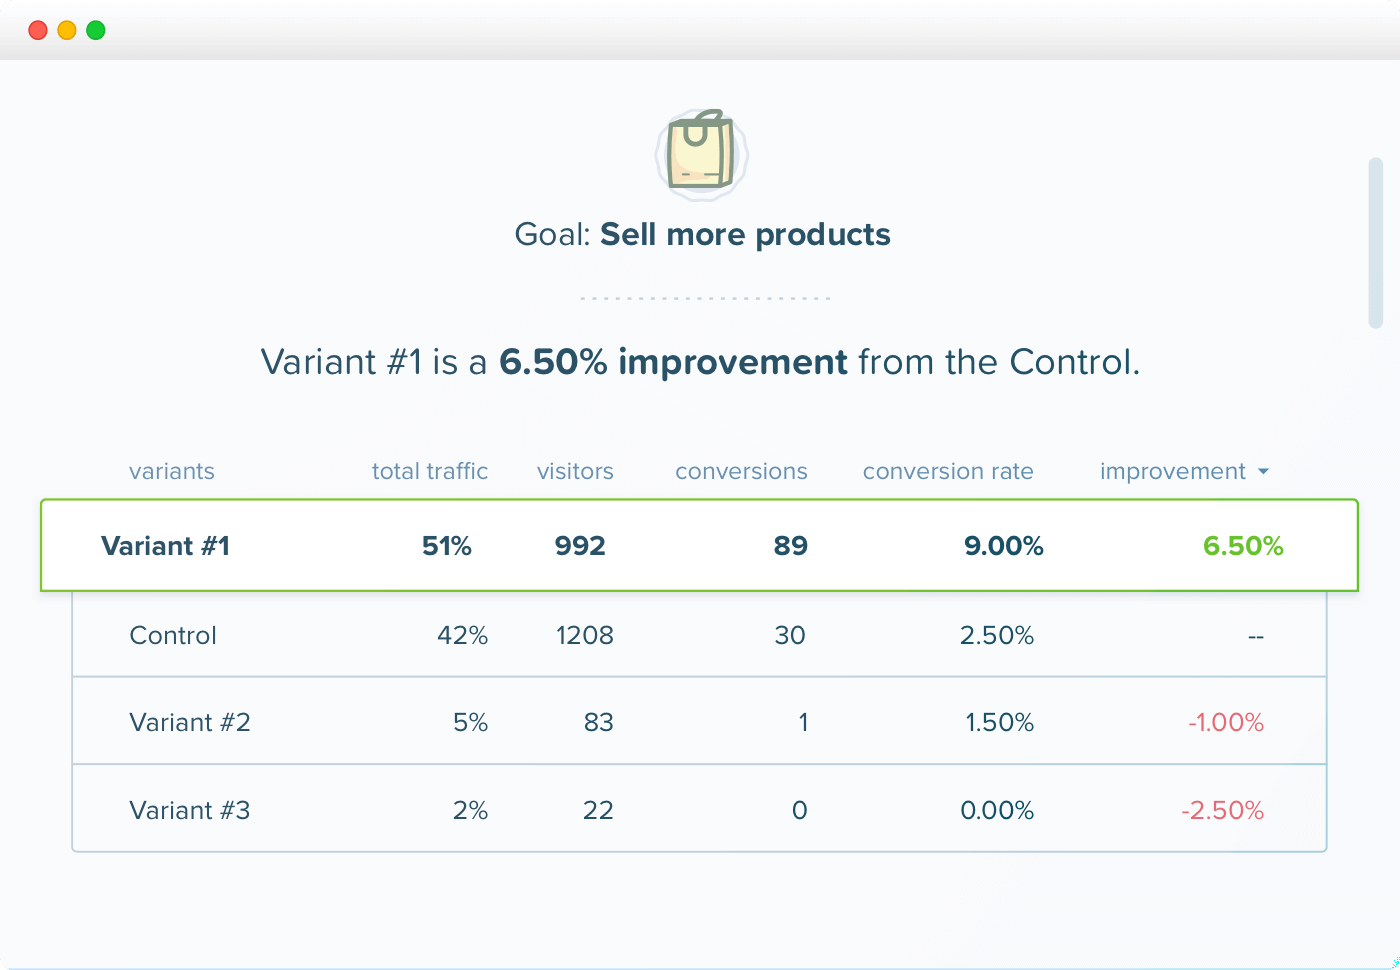
A/B Testing reveals the best performing elements and pages on your site, and with Crazy Egg creating experiments and getting results has never been easier! You will be able to set up and launch your tests in a few minutes.
Furthermore, continuous optimization lets you see how your ideas stack up against each other and quickly see which are performing best. Add new ideas, retire old ones, and keep optimizing for the best results.
Learn More About A/B Testing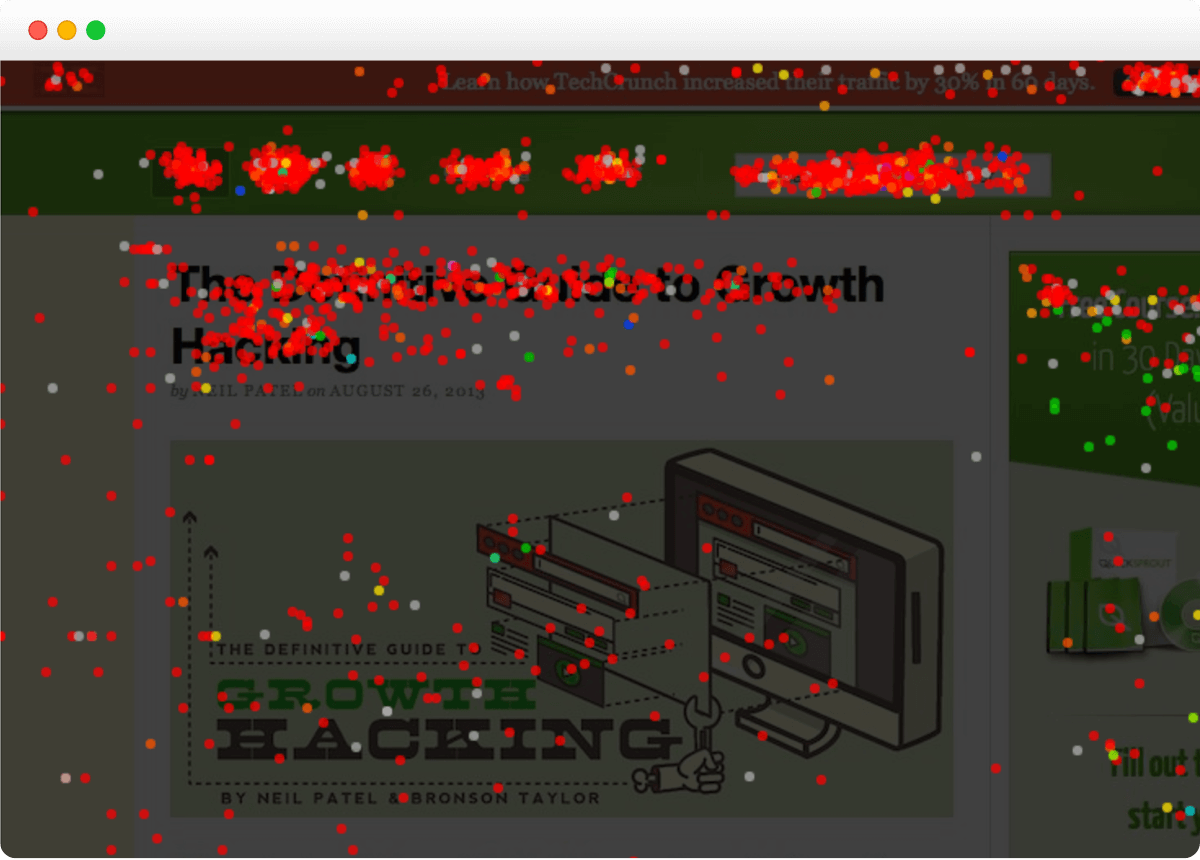
You’ll Go Crazy Over Confetti
Our Confetti Report unveils how your users are clicking within your site with pinpoint accuracy. It separates clicks into 18 unique types, including "New vs. Returning Visitors," "Referrer (Referral Source)," "Search Term," "Country," "Time of Day,"" and many more.
By analyzing all this data, you can gain huge insight into your visitors’ behavior and create highly effective changes to improve your site’s performance and profitability.
Learn More About Confetti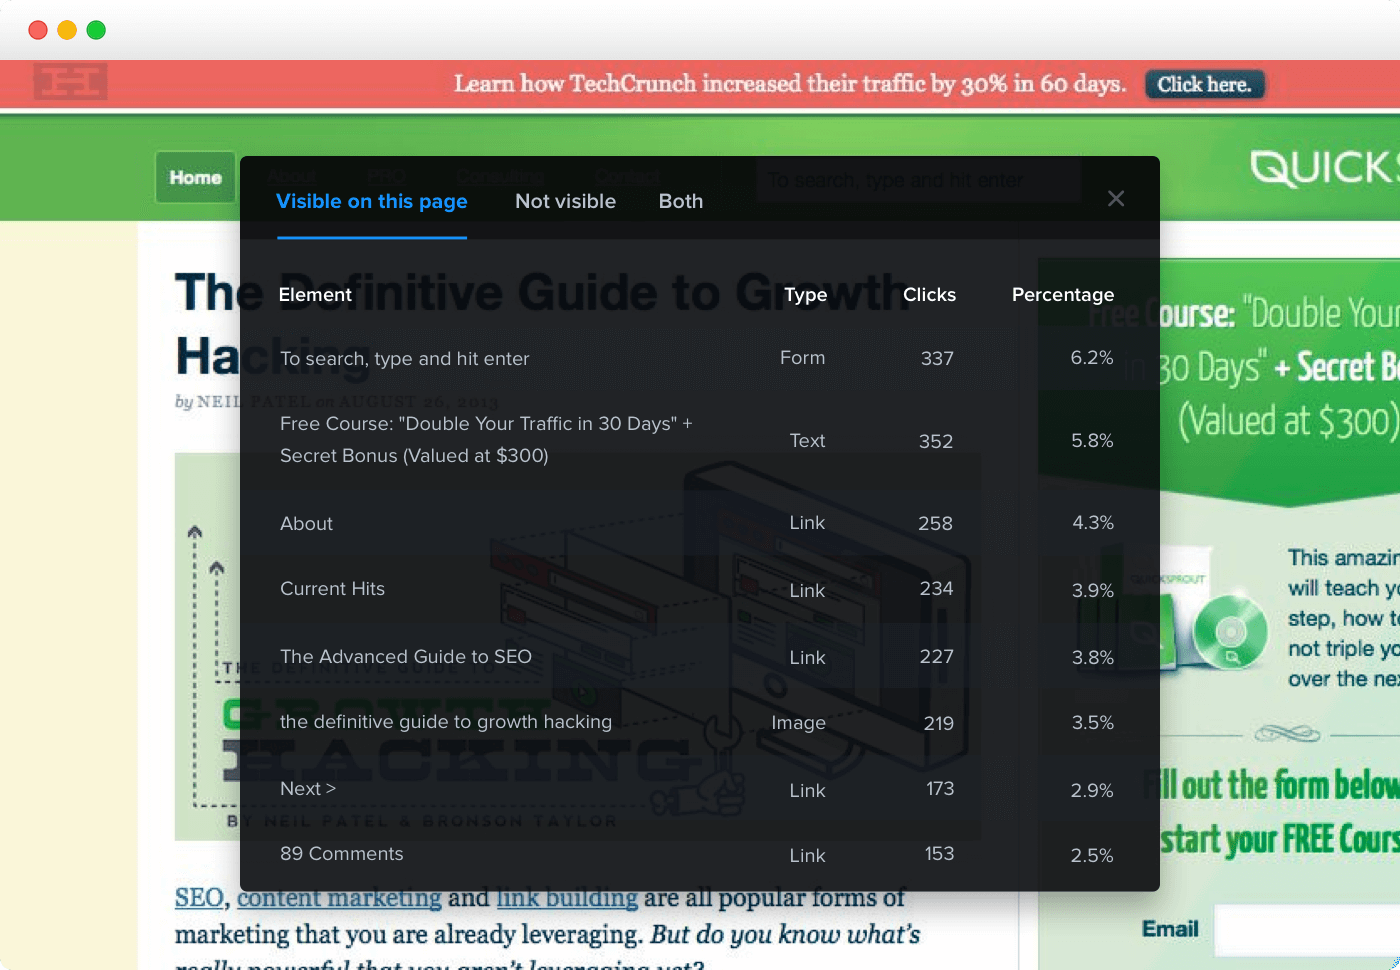
When You Just Need the Numbers
List Report provides a straightforward table of how many times any elements are clicked as tabulated data. No fancy graphics, just numbers.
You can also instantly sort by type of element (i.e., links or buttons), and you can quickly see the numbers for animated web page elements such as pop-ups. You can also export your data to CSV.
Learn More About List Report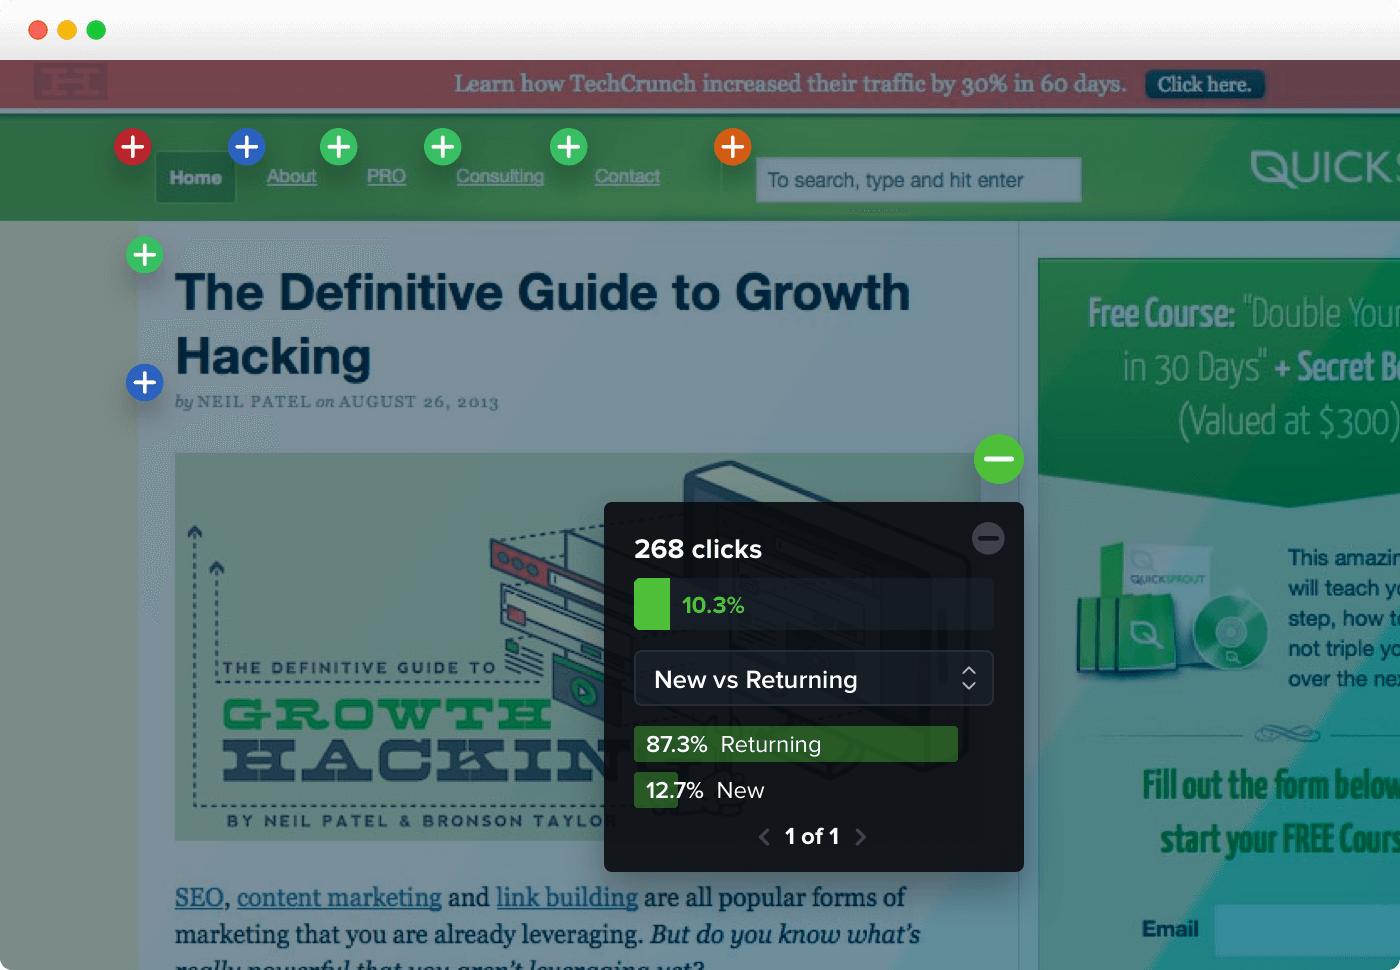
Remove Your Site’s Trap Doors
The Overlay Report breaks down your click report by individual elements, such as divs, buttons, headers, and other distinct areas.
This is a great tool for designers who understand HTML, and it’s the quickest way to uncover all the revenue-losing links that allow a visitor to exit your site or your sales funnel.
Learn More About Overlay ReportWatch Your Visitors’ Behavior in Real Time
Recordings allow you to actually view your visitors’ mouse movements, exposing frustration points. It’s as if you are standing right beside them while they use your site! This is the best way to visually see critical UX issues, such as when a user gets stuck or encounters a broken element on your site. Watch the video below to see why.
Crazy Egg Records the Entire User Session
From the moment a visitor comes to your site to the end of their session, you'll see every movement of their cursor and everything they click on.
Find the Website Recordings You Really Need
Use our Recordings Filter to find specific recordings on your pricing page, specific features, signup flows, or any other section of your site.
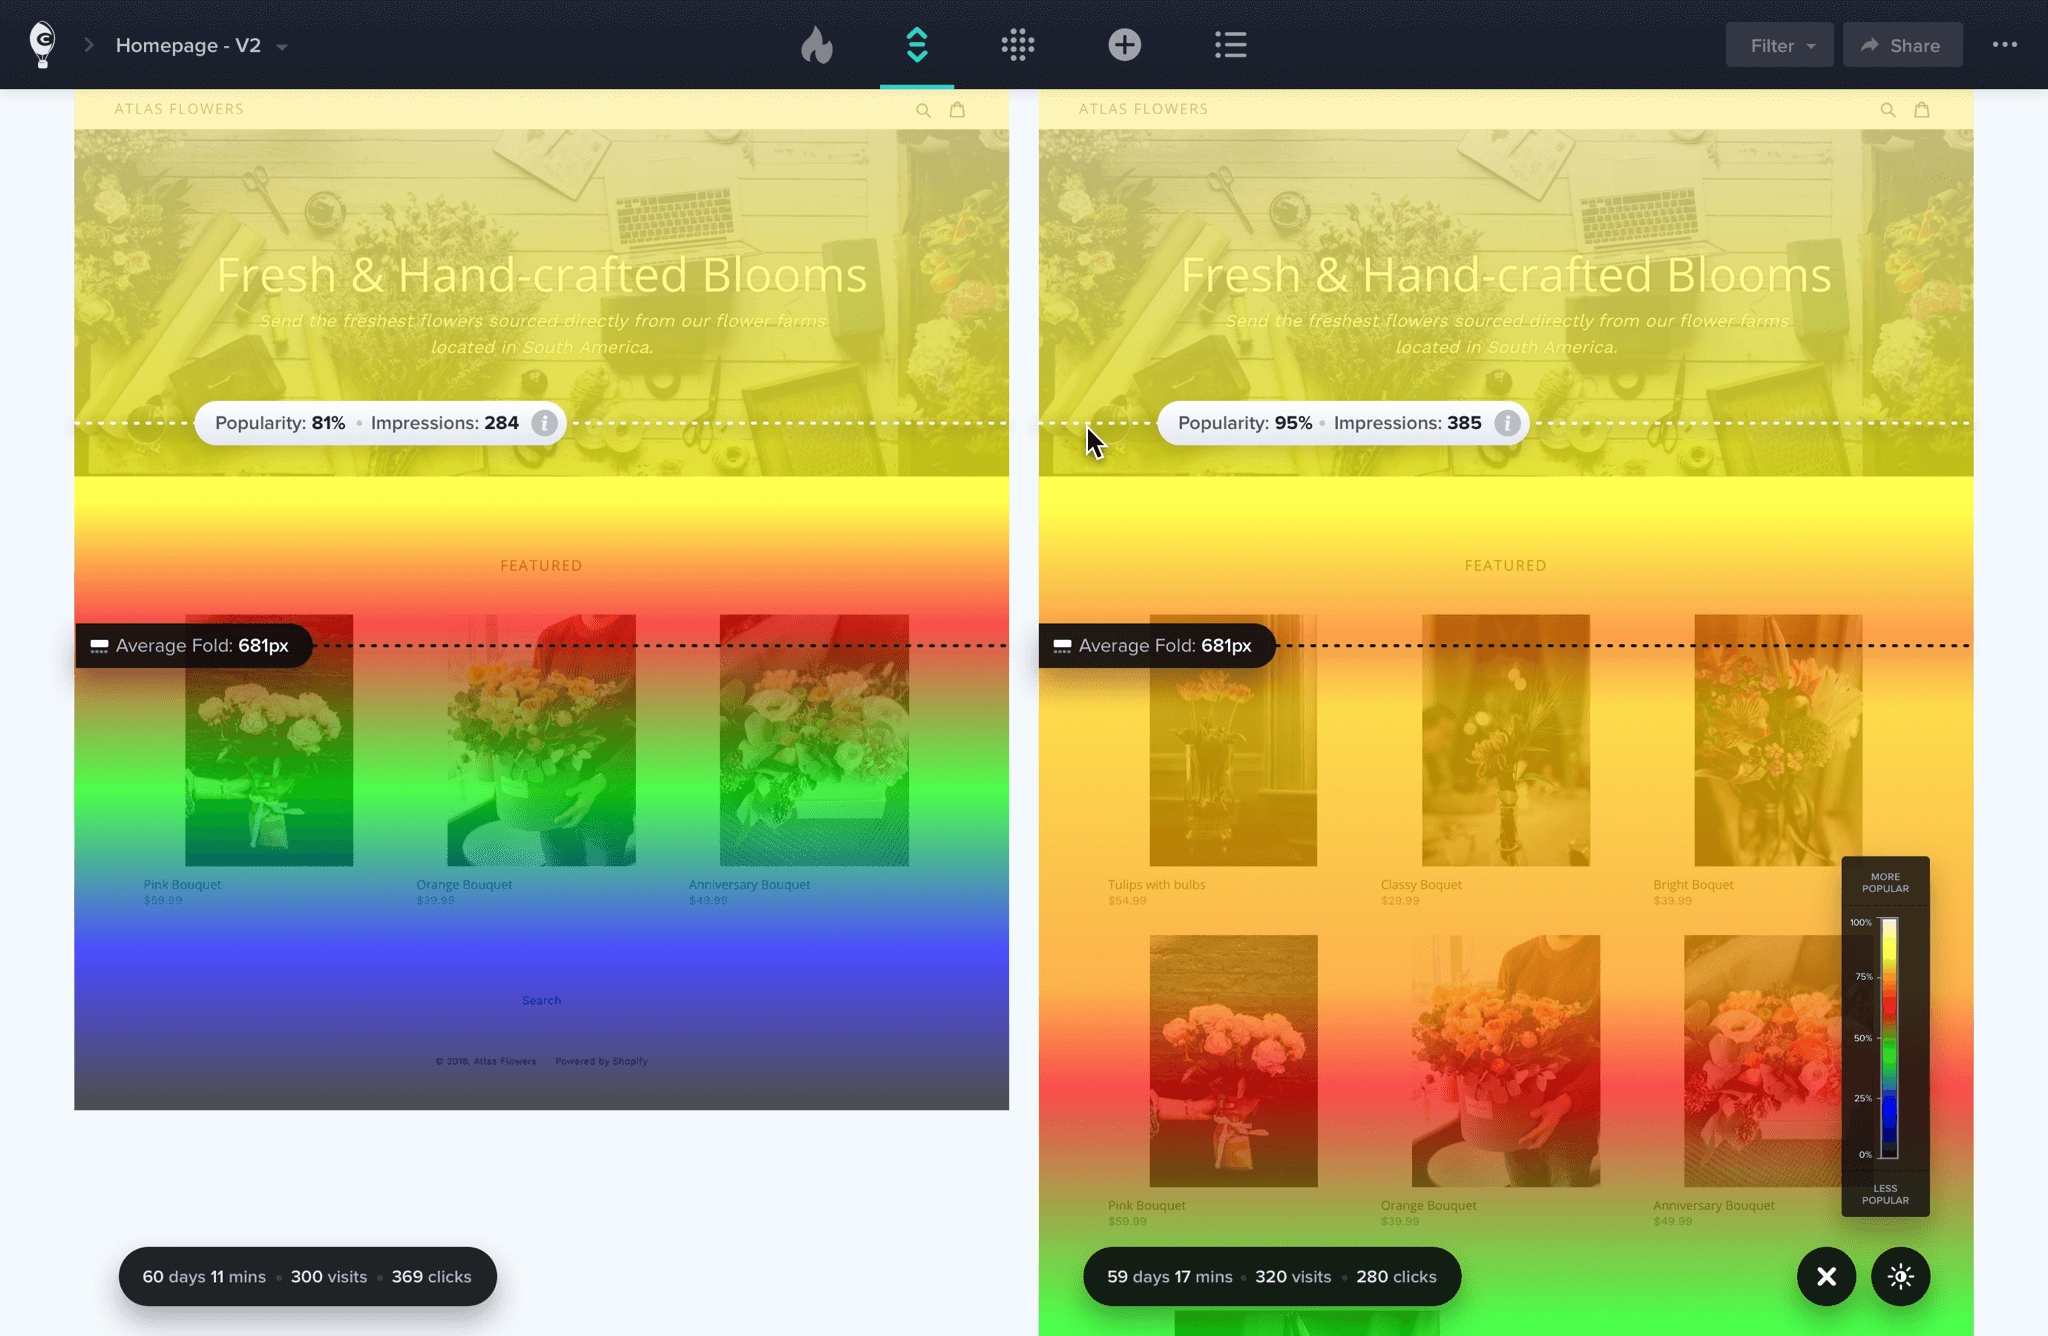
Side-By-Side Comparisons
Snapshots provide you with side-by-side comparisons of your heatmaps (or any other report), giving you a presentation of the evolution of your changes and optimizations. It's one thing to be able to generate a heatmap of a web page's usage, but it's an eye-opening learning experience when you can see the before and after effects of your users' on-site behavior. You can also compare your mobile site to your desktop site, and you can download snapshot data to include in your own reports.
Crazy Egg integrates with your favorite apps
Get set up faster and start improving sooner with integrations to your favorite apps.