


Heatmap Reports
See where visitors are interacting with your site, so you can optimize page design and drive more conversions. .
- Five different maps to view and segment data
- Filter by date, audience segment, traffic source, or conversion status
- ✨AI Analysis works to find important conclusions for you
- No sampling for greater data precision
Install in minutes • Free 30 day trial • Cancel anytime

Trusted by over 449,000 websites worldwide


Poor page design creates worse experiences and converts fewer customers
- Excessive content distracts visitors from your best-performing offers
- Confusing layouts and errors create user frustration
- Slow page load times drive users to leave, hurting SEO rankings
Website heatmaps help you see where to improve each page
-
Locate top-performing offers
High-click links are your most valuable content. Drive more attention to these and reduce friction to convert.
-
Remove barriers to conversion
Low-performing content often distracts users from higher-impact offers, or hides those offers by pushing them down the page. Either move distractions elsewhere or remove them.
-
Find where users get frustrated
Users rage click when they want to engage — but encounter dead space, missing links, slow loading, and more. Fix obstacles getting in their way.
Five ways to visualize, segment, and export your data
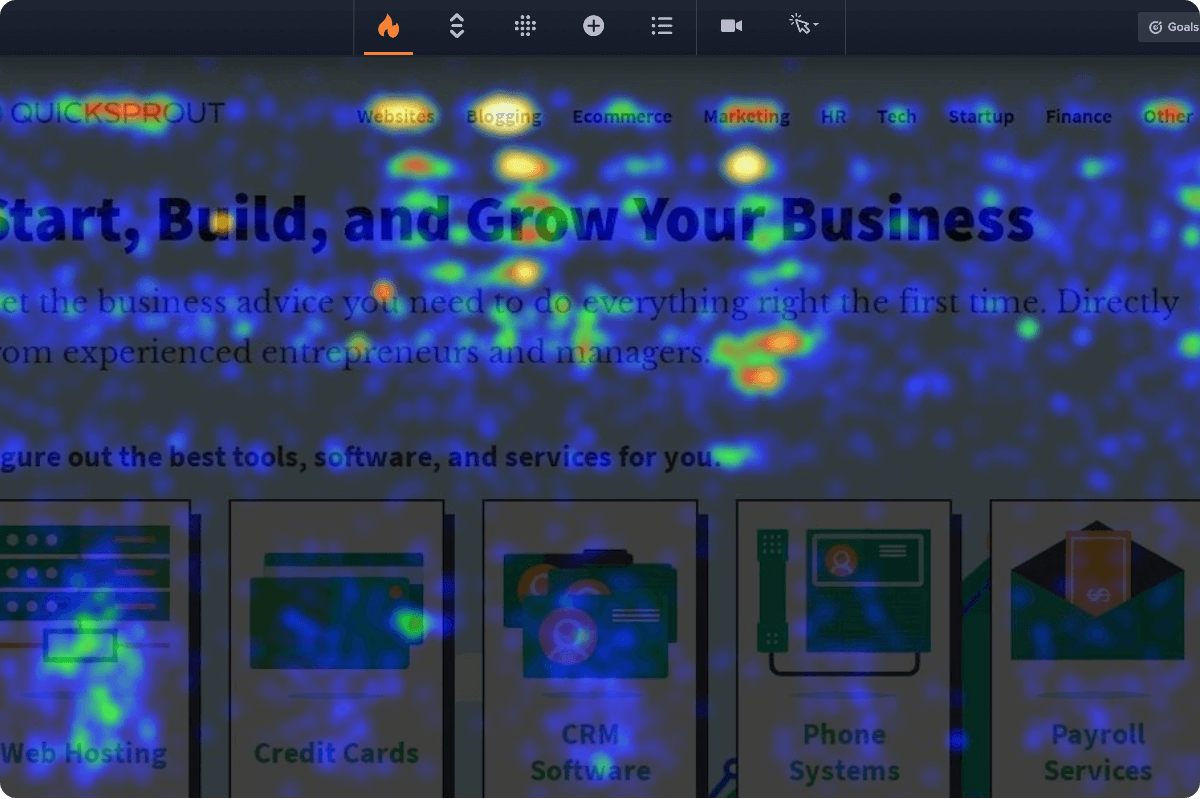
Click Maps
See which parts of each webpage are attracting the most activity. The more clicks an area receives, the brighter (or hotter) its color will be.
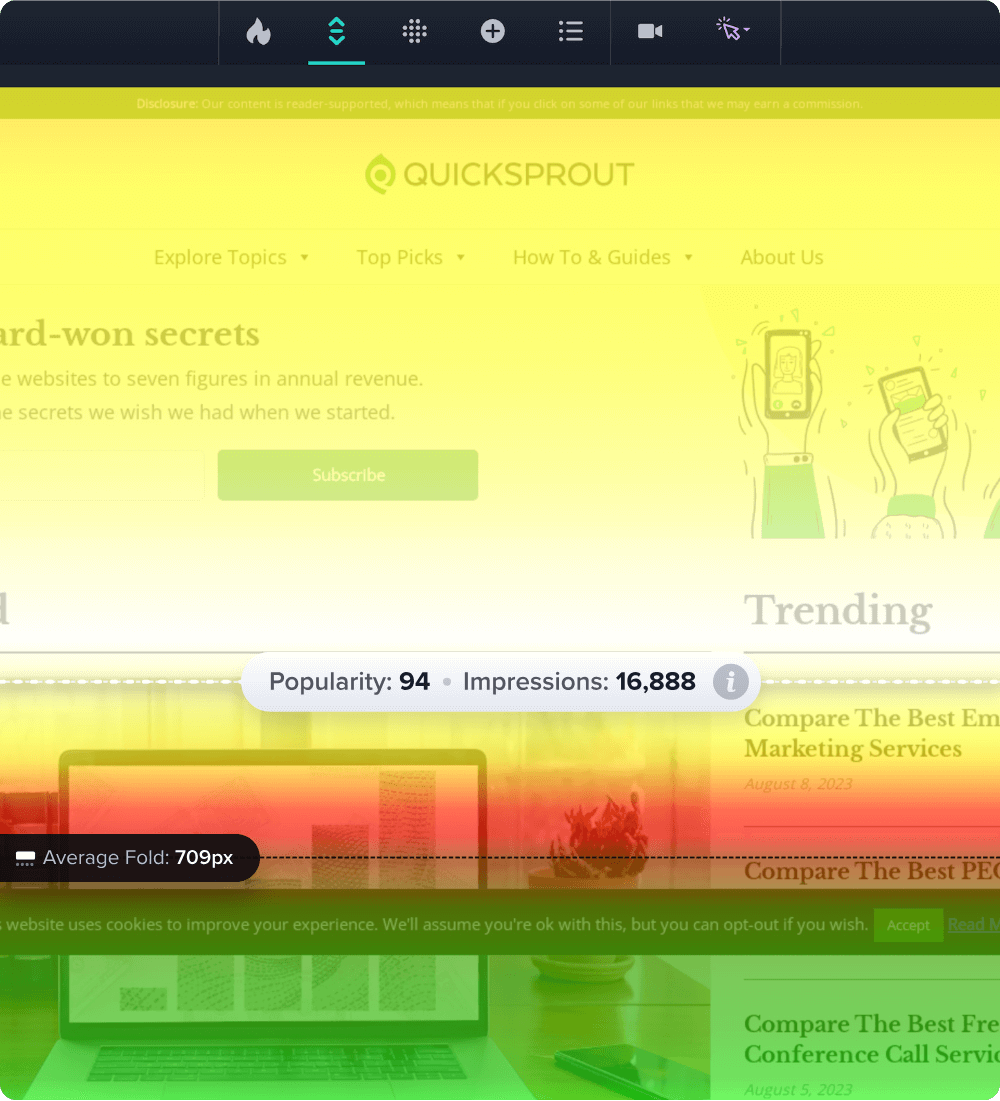
Learn moreScroll Maps
Know how far visitors are scrolling down, and which content they’re not seeing. Useful when deciding where to put buttons, forms, and other CTAs.
Learn more
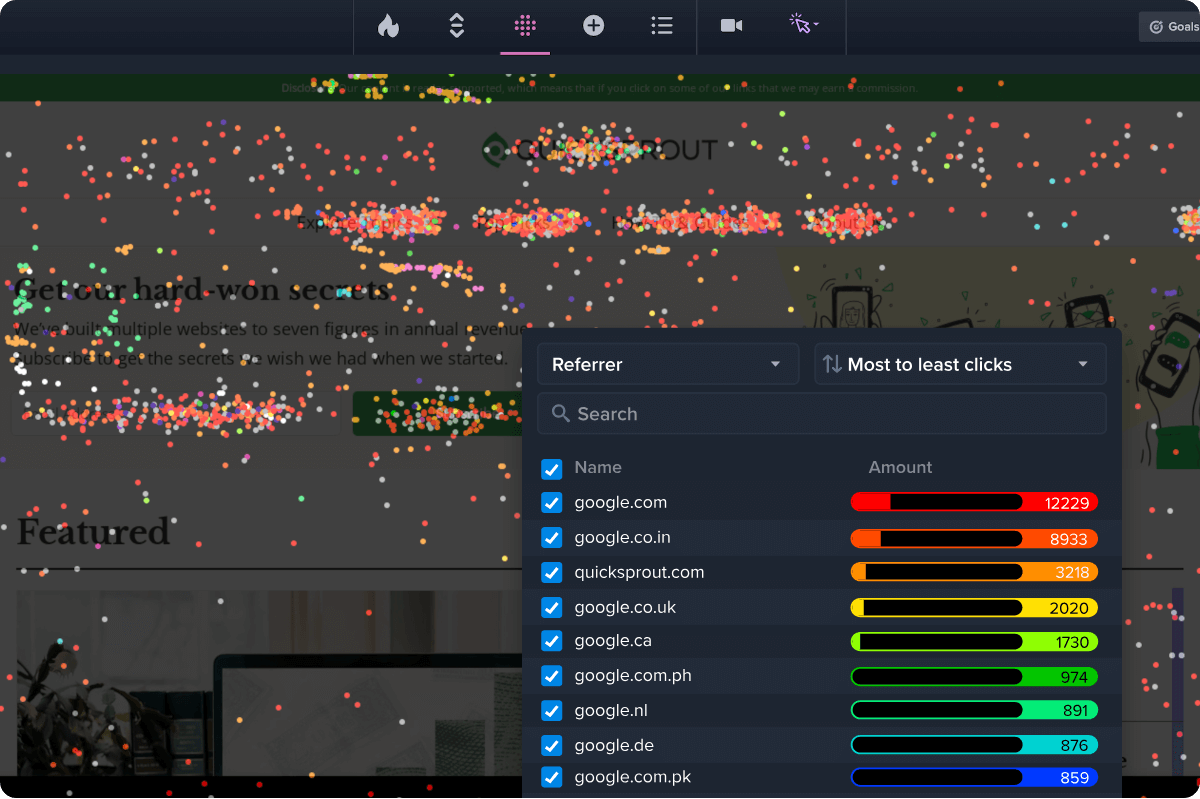
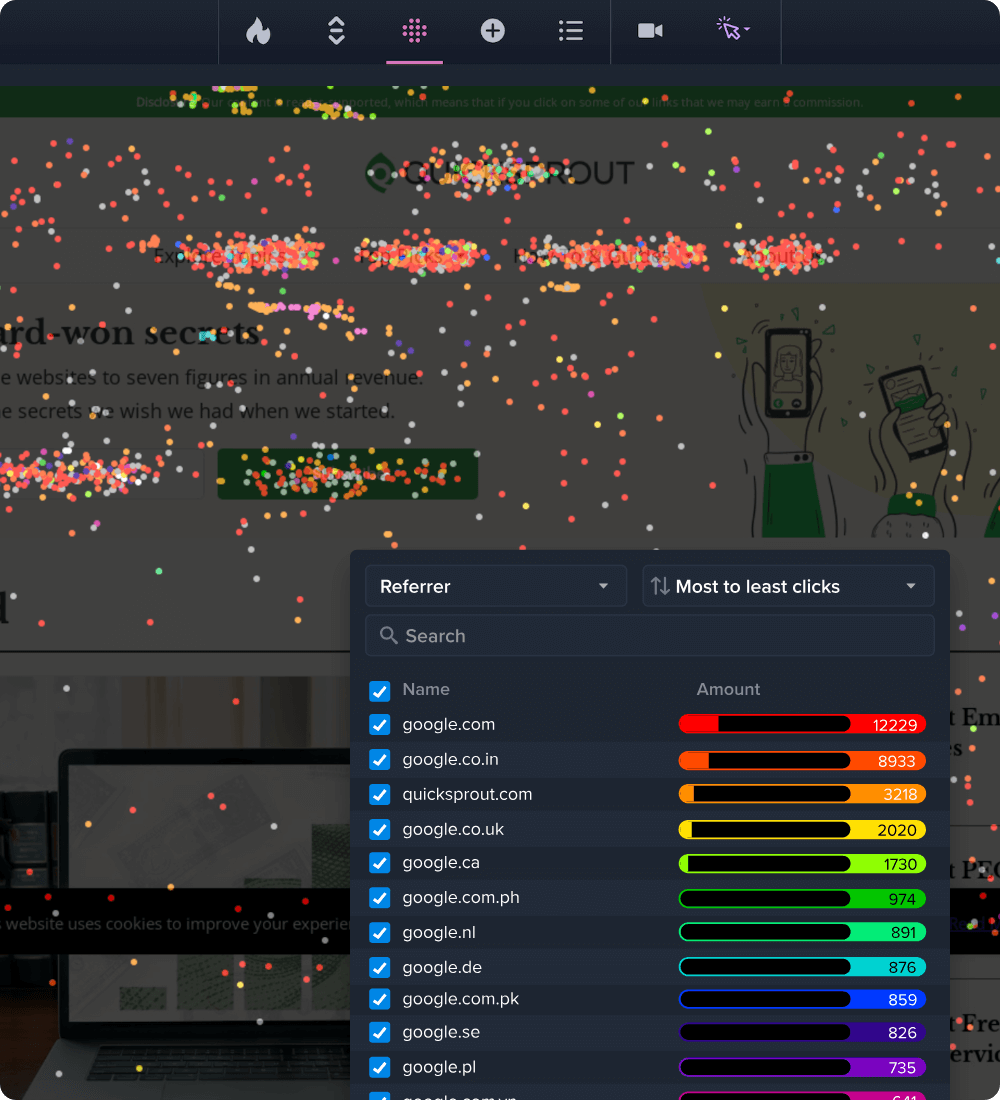
Confetti Maps
Get a precise look at individual clicks. Color-coded dots represent clicks that can be segmented by: traffic source, operating system, UTM parameters, and 17 other metrics.
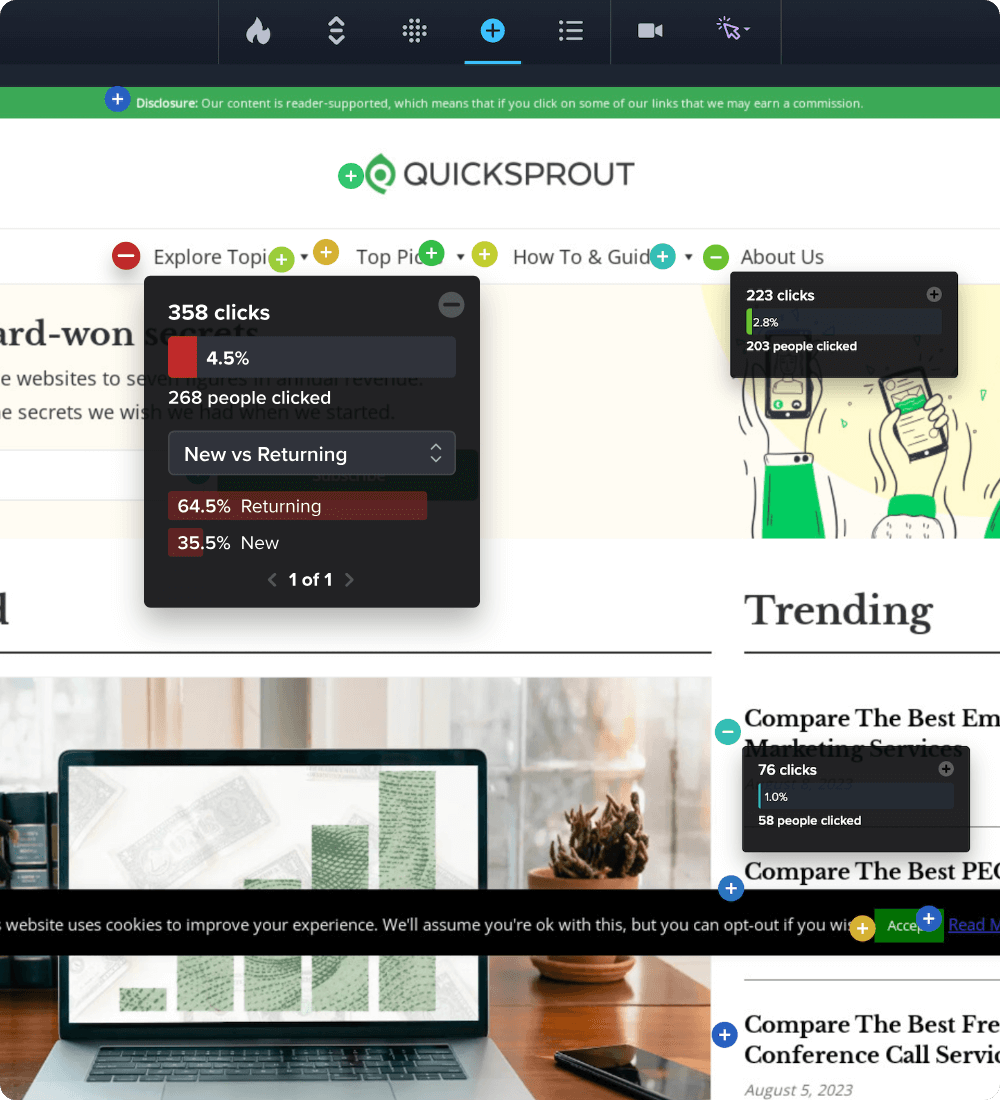
Learn moreOverlay Maps
Drill into click metrics for specific elements. This helps isolate each element’s impact on visitor behavior, and makes segmentation easy. Useful when deciding which CTAs are most popular.
Learn more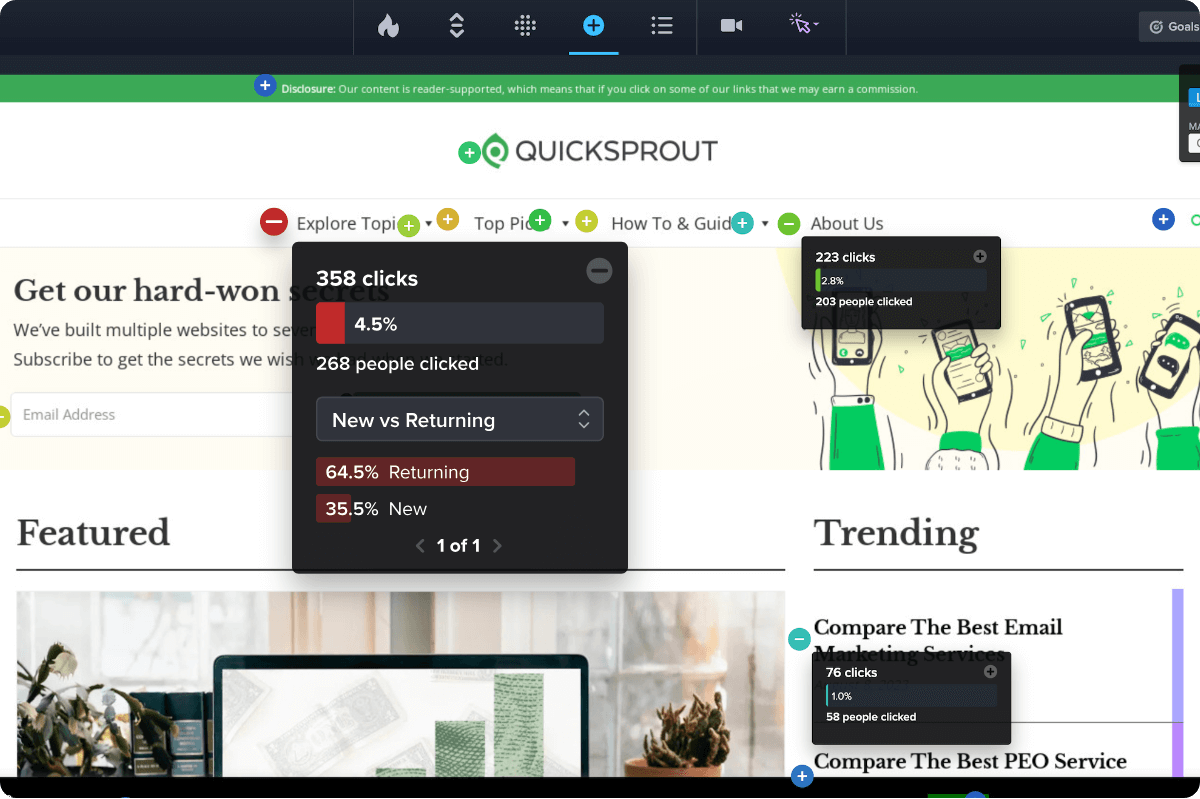
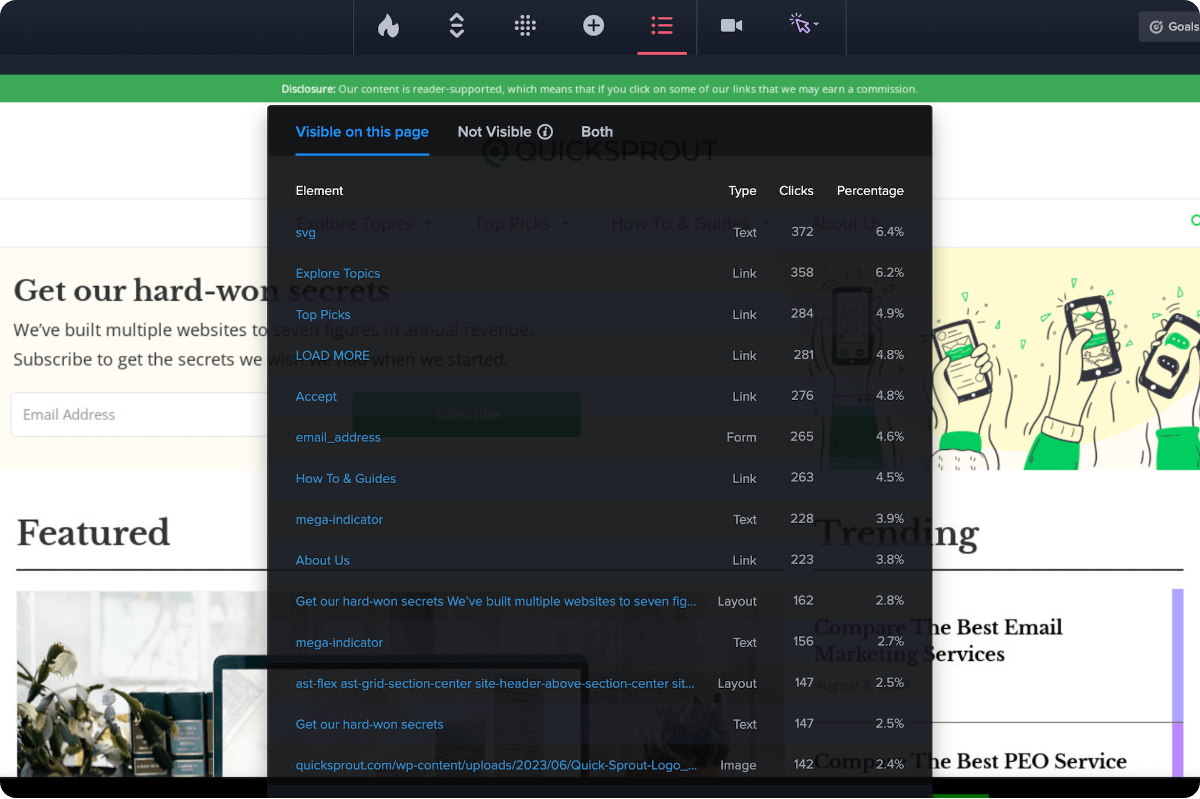
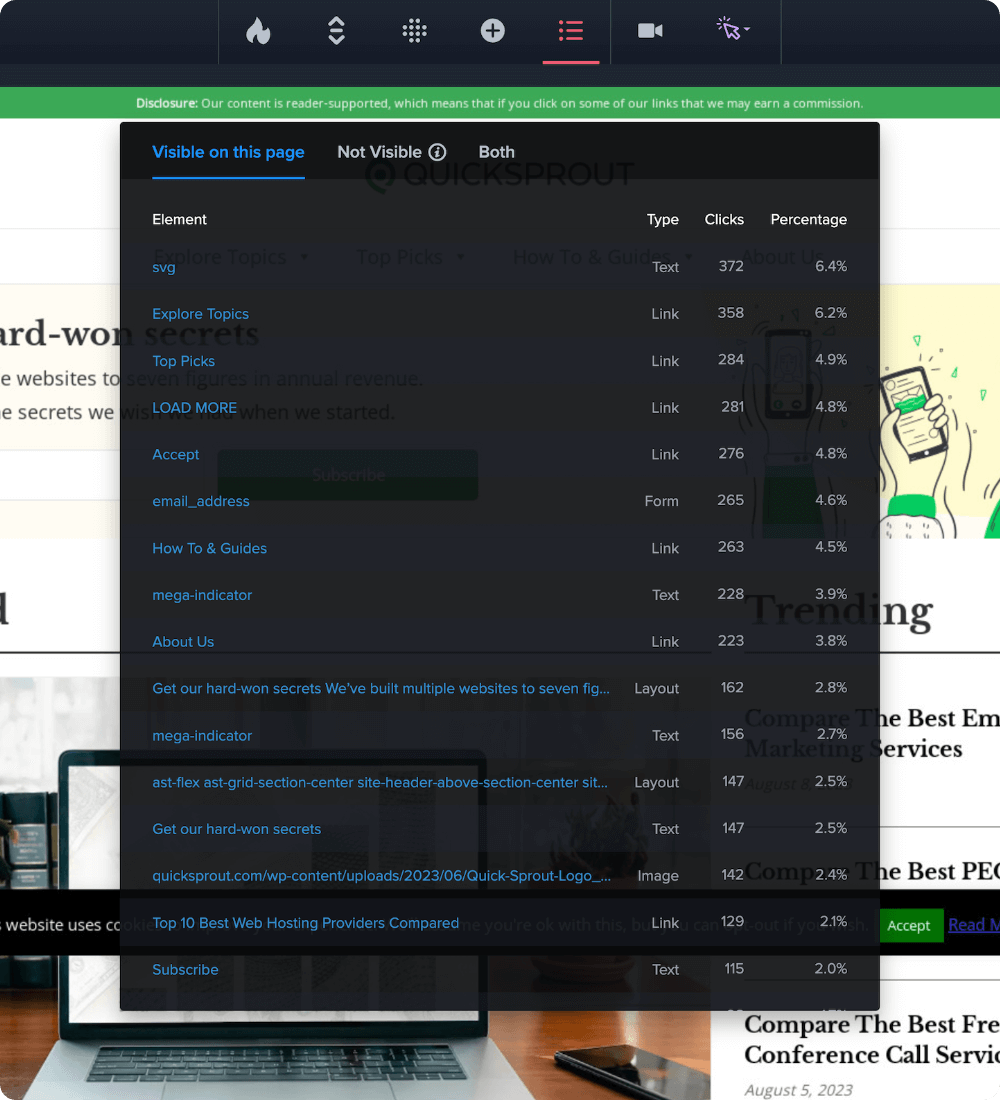
List Maps
A purely numerical report of the number of clicks on each page element. Ideal for when you want to export and slice the raw data yourself.
Learn moreCompare your heatmaps by audience segment
Behavior on your website can vary widely, based on who your users are and where they came from. Our Heatmap filters provide clarity on which users are driving the most engagement and conversions on your website.
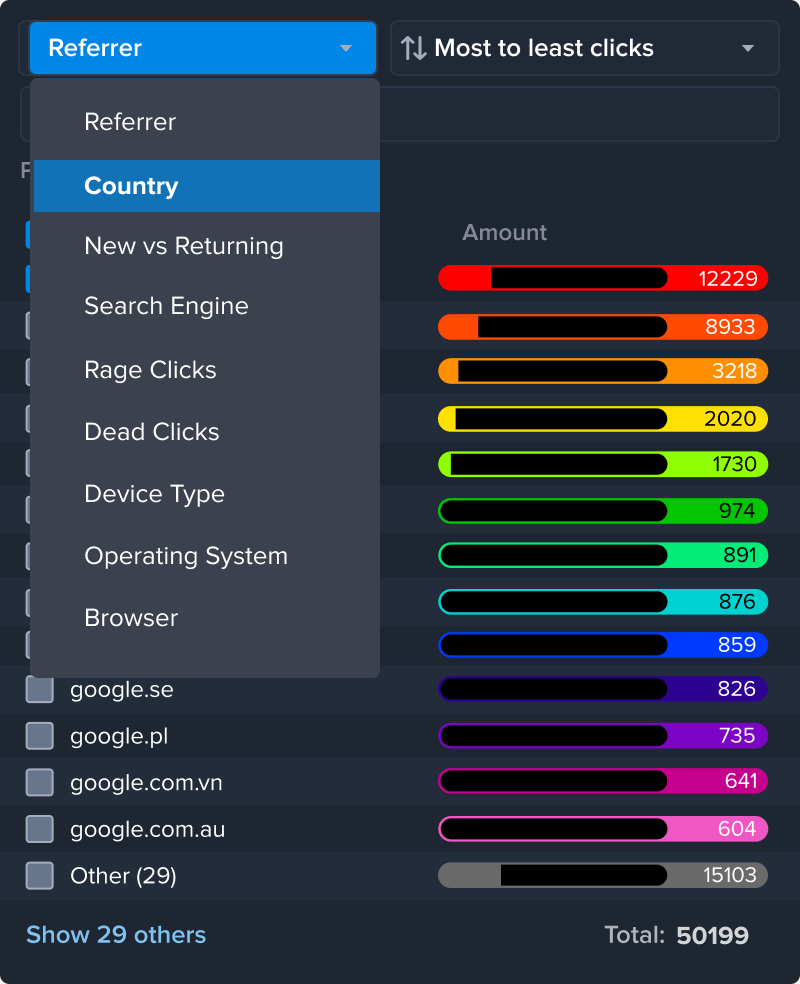
Segment and export Heatmap data, based on 20+ audience filters covering:
- Date Range
- Traffic Source / UTM Parameters
- User Types
- Device
- Conversion Goals
- Your Custom Variables
Understand your heatmap data, no
matter your skill level
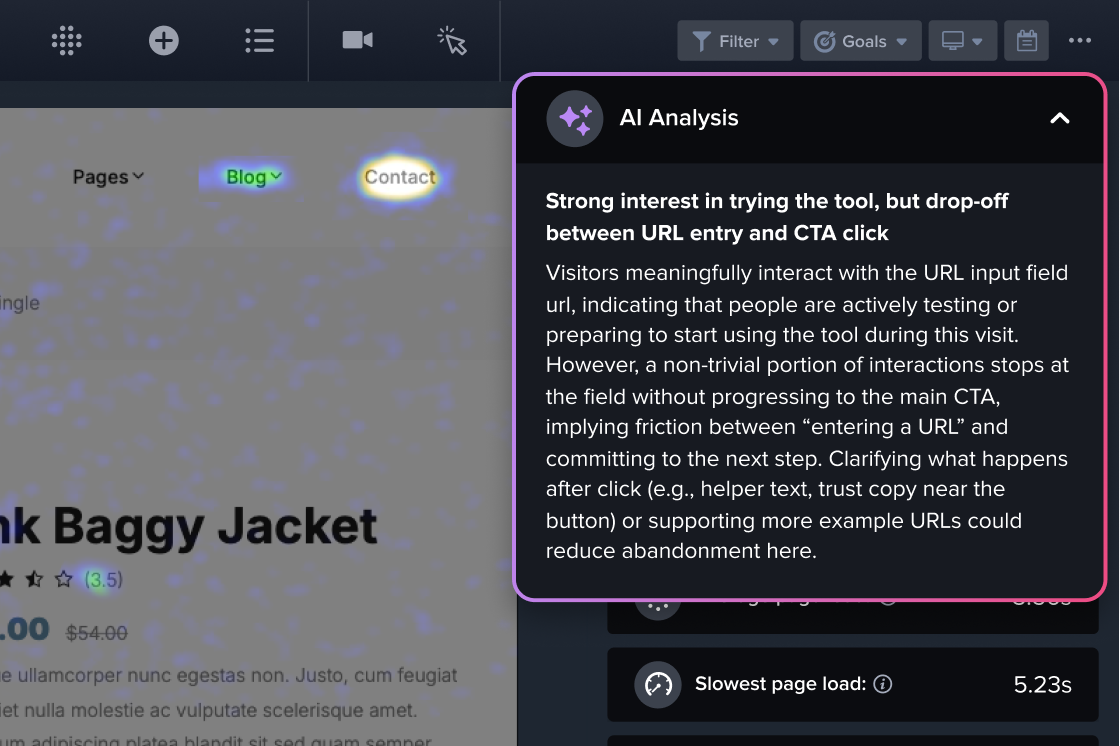
AI Analysis finds results for you
Crazy Egg automatically finds patterns in visitor behavior, then identifies ways to improve your website based on these. All explained in simple language.
No need to figure out which questions to ask. AI Analysis does the work for you.
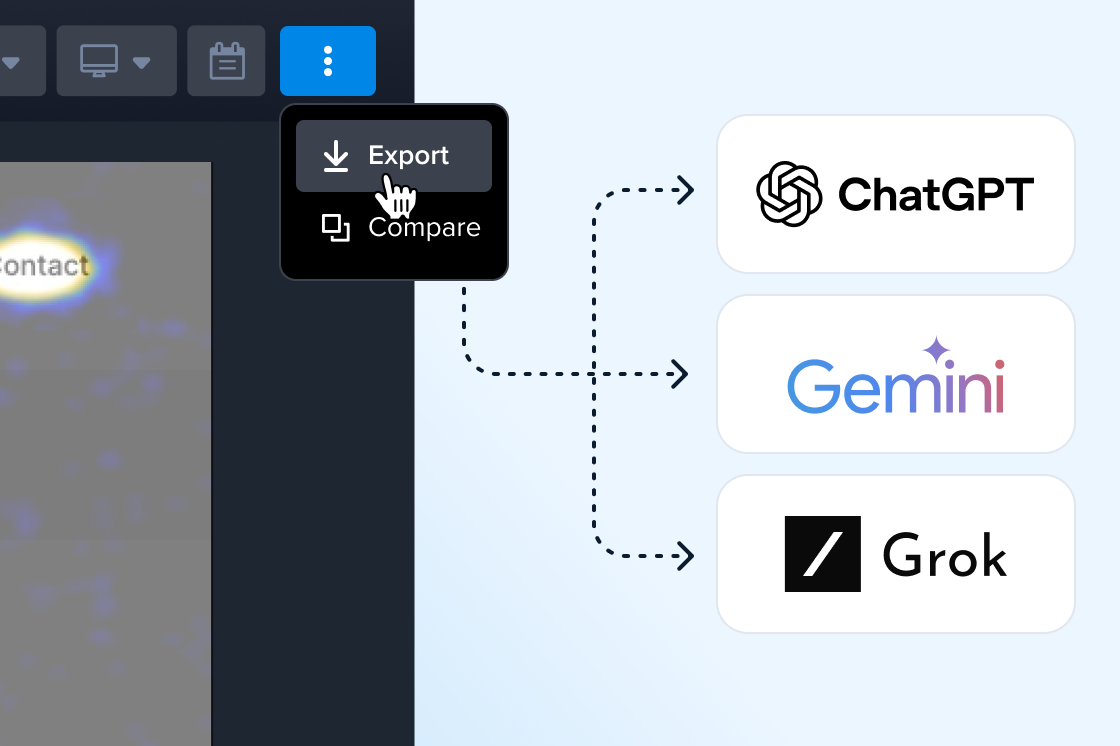
Export Heatmaps to analyze in any AI tool
Want to ask follow-up questions about your data? Export any Heatmap in an AI-compatible file to analyze in the tool of your choice: ChatGPT, Gemini, Grok, and more.
It’s your data. Take it anywhere to use with your favorite model (not just the ones used in Crazy Egg).
-
Who are Crazy Egg’s heatmaps best for?
Crazy Egg’s heatmaps make understanding visitor behavior quick, easy, and affordable. They’re ideal for marketers, growth teams, and website owners, no matter their level of expertise.
Heatmap reports include a traditional click map to see where users click; a scrollmap to see where users scroll; list and overlay maps that quantify clicks for specific elements, like buttons; and AI Analysis that explains behavioral trends in plain language, and recommends page optimizations based on this behavior.
These heatmap capabilities help website owners not just visualize visitor activity, but understand what it means for their website strategy. This ensures you’ll get actionable insights no matter your skill level, and without needing a dedicated team just to setup reports and analyze your data.
It means you (and your marketing team) are freed to spend more time on the work of improving site experience and Conversion Rate Optimization, instead of devoting resources to maintaining an expensive Business Intelligence suite.
-
Do heatmaps automatically generate for mobile or tablet visitors as well?
Yes, Crazy Egg’s heatmaps automatically segment visitors by device type: desktop, tablet, and mobile.
-
Can we create a single heatmap that spans multiple pages?
Yes, you can track and aggregate multiple pages within a single heatmap. Pages can be selected either individually, or with a wildcard or regular expression.
-
Do Heatmaps work with pages behind a login, checkout flows, dynamic content, longer pages, or SPAs?
Yes, Crazy Egg can generate a Heatmap report for pages behind a login, checkout flows, dynamic content, or Single Page Applications (SPAs) with its Page Camera browser extension.
Longer pages are fully natively-supported in Crazy Egg, with no different setup requirements.
-
Do heatmaps automatically sample traffic? Can I control the sampling rate, or which traffic is tracked?
By default, Heatmaps on Crazy Egg do not sample, and track 100% of pageviews on targeted pages.
Users who wish to sample can change this setting for any heatmap. So you can set a lower sample rate on some pages, while not sampling on other pages. This also has the benefit of using fewer “Tracked pageviews” from your monthly traffic capacity.
-
Can I see quantified heatmap data by page element (CSS selector), or just by page screenshot?
Yes. Heatmaps automatically include the List Report, which automatically categorizes every page element in your HTML, then counts the number of clicks on each element. You can view this report in your Heatmap, and export it as a CSV for further analysis.
Additionally, the Overlay Report in your heatmaps shows the click count for each element overlaid on your page. You can expand any element in the report to segment those clicks counts by user type, traffic source, UTM parameter, and more.
-
Can I filter heatmaps by audience segment, traffic source, or custom data?
Yes! You can filter data in Heatmaps based on 20+ audience filters, including:
- Date Range
- Traffic Source / UTM Parameters
- Country
- New vs. Returning
- User Types
- Device Type
- Conversion Goals
- Your Custom Variables
-
Can heatmap data be filtered by conversion status?
Yes, you can filter data in Heatmaps based on whether they have (or have not) completed any of the actions you’ve set up in Conversion Analytics. You can apply multiple filters based on Conversion Status simultaneously, viewing only traffic that satisfies “all of these conditions” or “any of these conditions”.
-
Can we export or share heatmap data?
Yes, Heatmaps can be exported in multiple formats. Click Maps, Scrollmaps, Confetti Maps, and Overlay Maps can be exported in JPG or PDF formats. List Reports are downloadable as a CSV for use in spreadsheets.
The segmented data that powers Heatmaps can even be downloaded in an AI-optimized JSON format. This allows you to do deep analysis in an LLM like ChatGPT, Gemini, or Copilot.
-
Can I compare heatmaps for different time periods, pages, or device types?
Yes, you can compare any two Heatmaps side-by-side, directly within Crazy Egg.
-
Do Heatmaps include an AI summary feature?
Yes, all Heatmaps include AI Analysis, which automatically looks for patterns in your visitors’ click, scroll, and bounce activity. It uses these to quickly identify which parts of your page drive high engagement, or friction.
This AI Analysis doesn’t need to be prompted or guided, automatically working to find page optimizations for you.
-
Do Heatmaps integrate with AI tools (ChatGPT, Gemini, Copilot, etc)?
Rather than a native integration, Heatmaps allow you to directly export their data in an AI-optimized format. You can upload this export file to any AI tool: ChatGPT, Gemini, Copilot, and more.
This gives you complete choice in whichever AI tool you choose to use, including the most cutting-edge models.
-
How do I install Crazy Egg? (Does it play nicely with GTM?)
You can install Crazy Egg by copying and pasting one piece of code into your website settings (at the top of the <head> section).
Find this piece of code by logging into your account, then clicking “Install Crazy Egg” in the sidebar. No technical knowledge required. Doing this takes just three minutes.
Alternately, you can install Crazy Egg using one of these supported integrations:
- Drupal
- Google Tag Manager
- Joomla
- Magento
- Segment
- Shopify
- Squarespace
- Wix
- WordPress
Crazy Egg’s lightweight script is optimized to minimize impact on your site speed. It loads asynchronously, so it won’t delay other critical page resources. This helps keep the visitor experience smooth while you gather insights into user behavior.
-
How does Crazy Egg protect user privacy?
At Crazy Egg, protecting your data and your visitors' privacy is a top priority. We follow industry-standard security practices and comply with major privacy regulations such as GDPR and CCPA.
- Data Protection - All data is encrypted in transit, stored securely, and access is strictly limited.
- Privacy Controls - Sensitive information (like passwords, credit card numbers, or personal form entries) is never captured, and we provide tools to mask fields and anonymize IP addresses.
- Transparency - Crazy Egg does not sell customer data or track users across websites. Data is only used to provide insights for your own site.
- Compliance - Customers can sign our Data Processing Agreement (DPA) to support GDPR and CCPA obligations.
-
Do I need a Crazy Egg login to view or share Heatmap reports?
You can send Heatmaps to team members via a Share Link URL. This ensures they can view the results of your Heatmap data without having to get a Crazy Egg login.
-
How does pricing work?
Crazy Egg has multiple subscription plans available. These differ mainly based on the monthly amount of tracked pageviews capacity.
Plans with Heatmaps and Recordings start at $29/month; A/B Testing, Popup CTAs, and Error Tracking start at $99/month.
All plans include unlimited website domains, and unlimited team member logins. We never charge overages in addition to your subscription plan.
You can start a 30–day free trial of any paid plan, and you won’t be charged until the end of the trial period. You can cancel your trial plan before the end of the 30–day trial period without being charged.
-
Can I change or upgrade my plan after starting?
Yes, you can change or upgrade your plan at any time.
Crazy Egg is the highest-ROI platform for
website optimization
-

All-in-one tools for Analytics and Conversion Testing
-

The best-value pricing
-

Priority Support
