See what's wrong with your website.
Over 400,000 websites use Crazy Egg to fix their website.

Start your 30-day FREE trial • Cancel anytime


-
Optimization
Capabilities

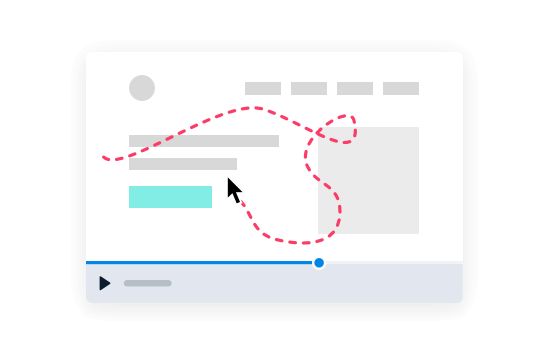
Understand the customer journey with Snapshots, Heatmaps and Recordings
Use our visual reports and individual session recordings to get to know your website visitors – where they're coming from, where they're navigating to, and where they're getting stuck – so you can make design changes with confidence.
Start by analyzing your website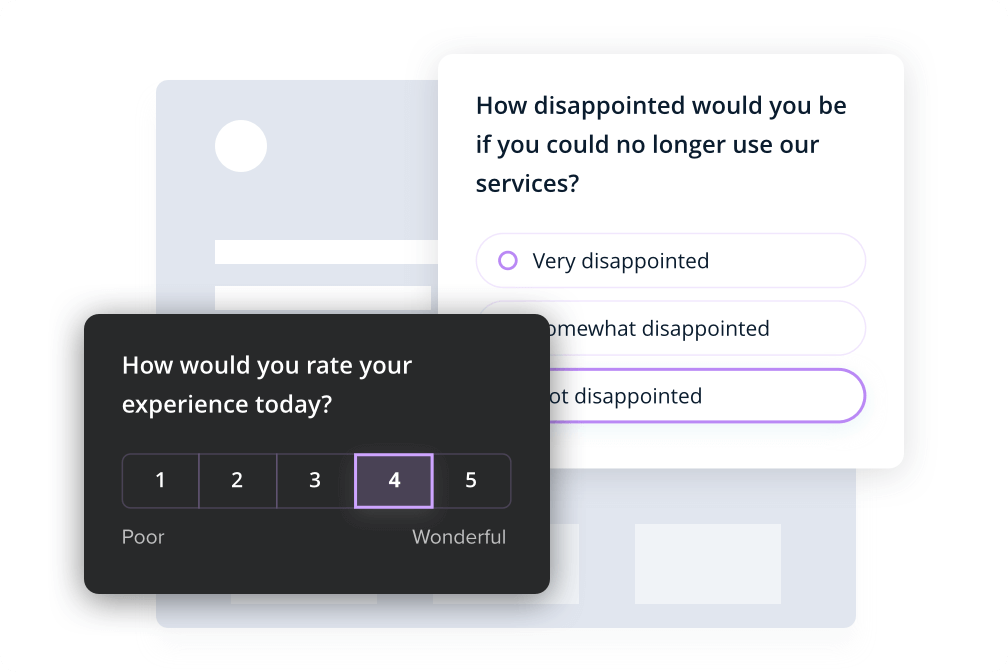
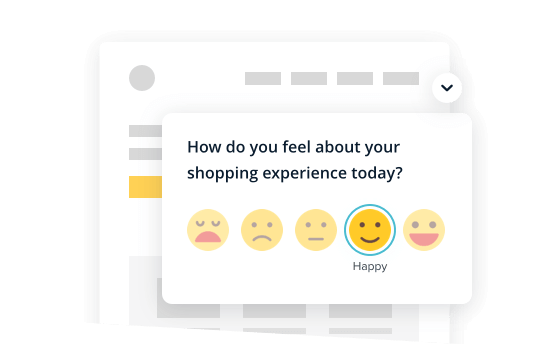
Get direct feedback from your customers and website visitors
Improve an existing product or feature from direct customer feedback. Ask targeted questions and get valuable insights in real-time. Measure the customer experience with NPS scores and ratings.
Start by analyzing your website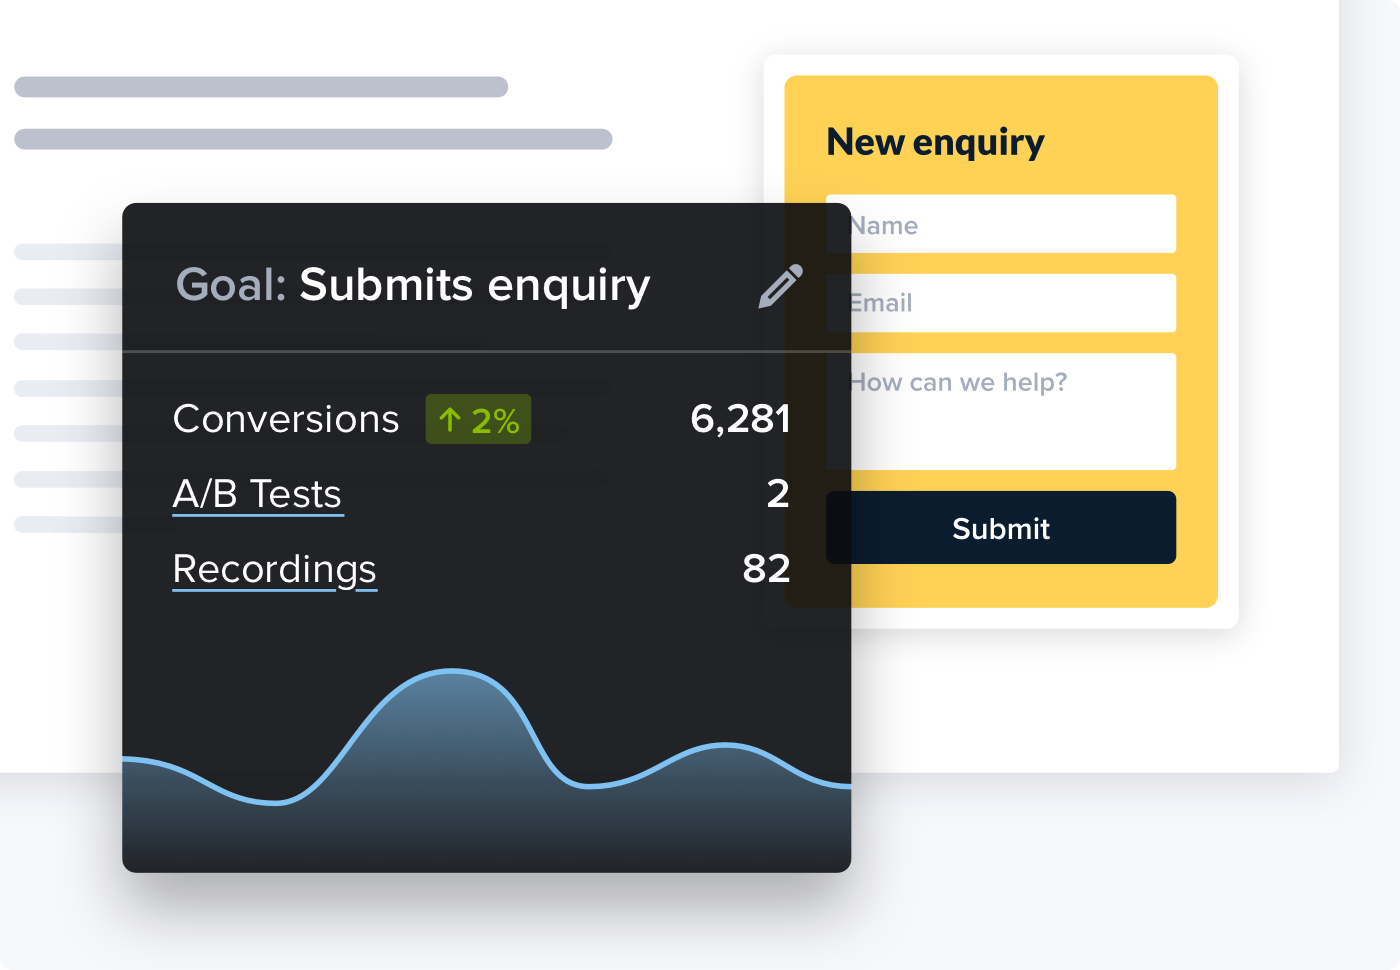
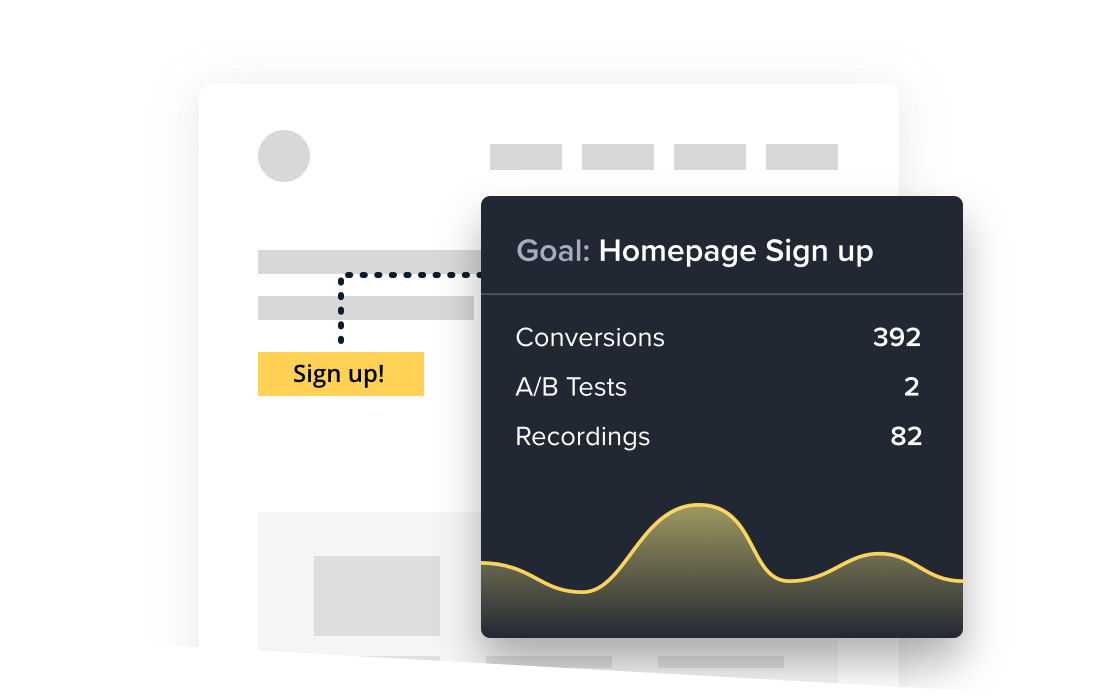
Goals
Measure the effectiveness of your website and stay on track of your business goals.
Identify specific areas of your website that need optimization to improve your conversion rates.
Start by analyzing your website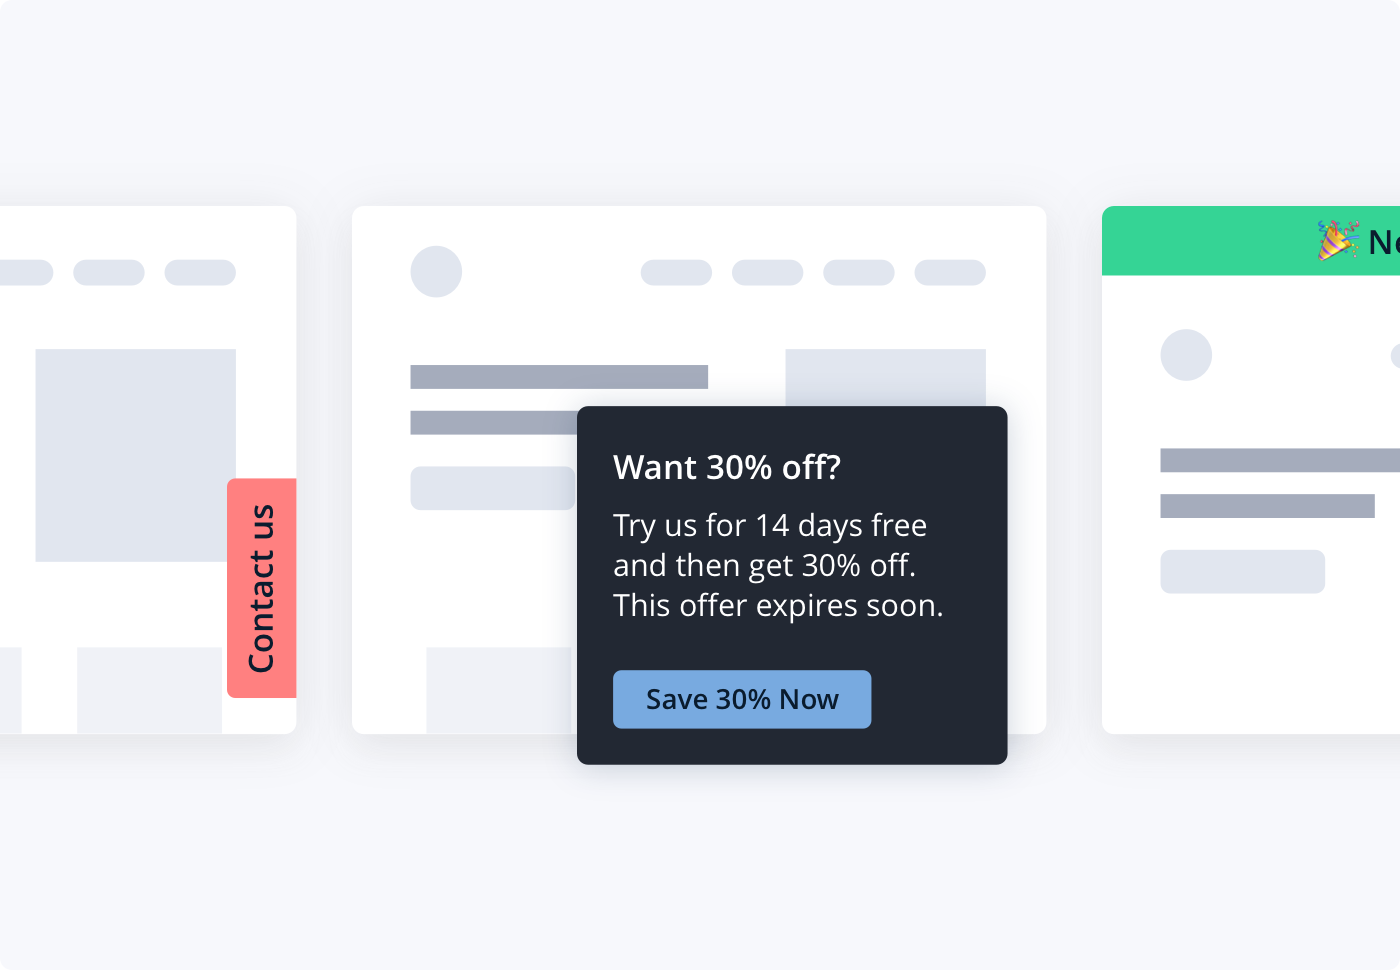
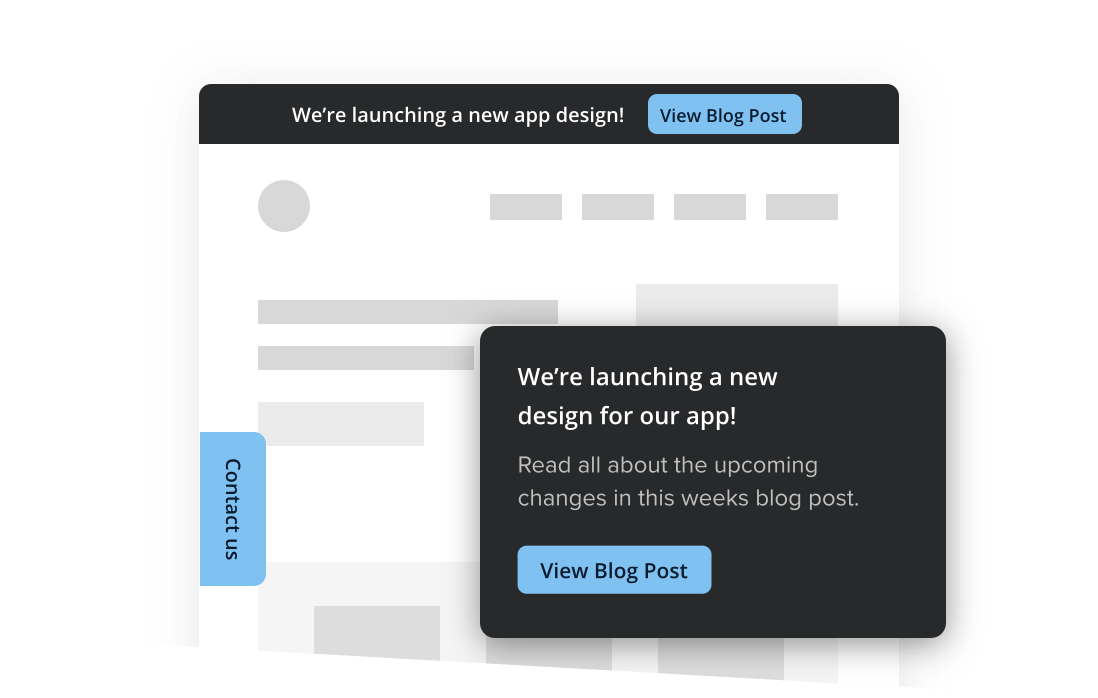
CTAs
Increase engagement and conversions on your website by highlighting promotions, resources, and sign-up funnels.
Start by analyzing your website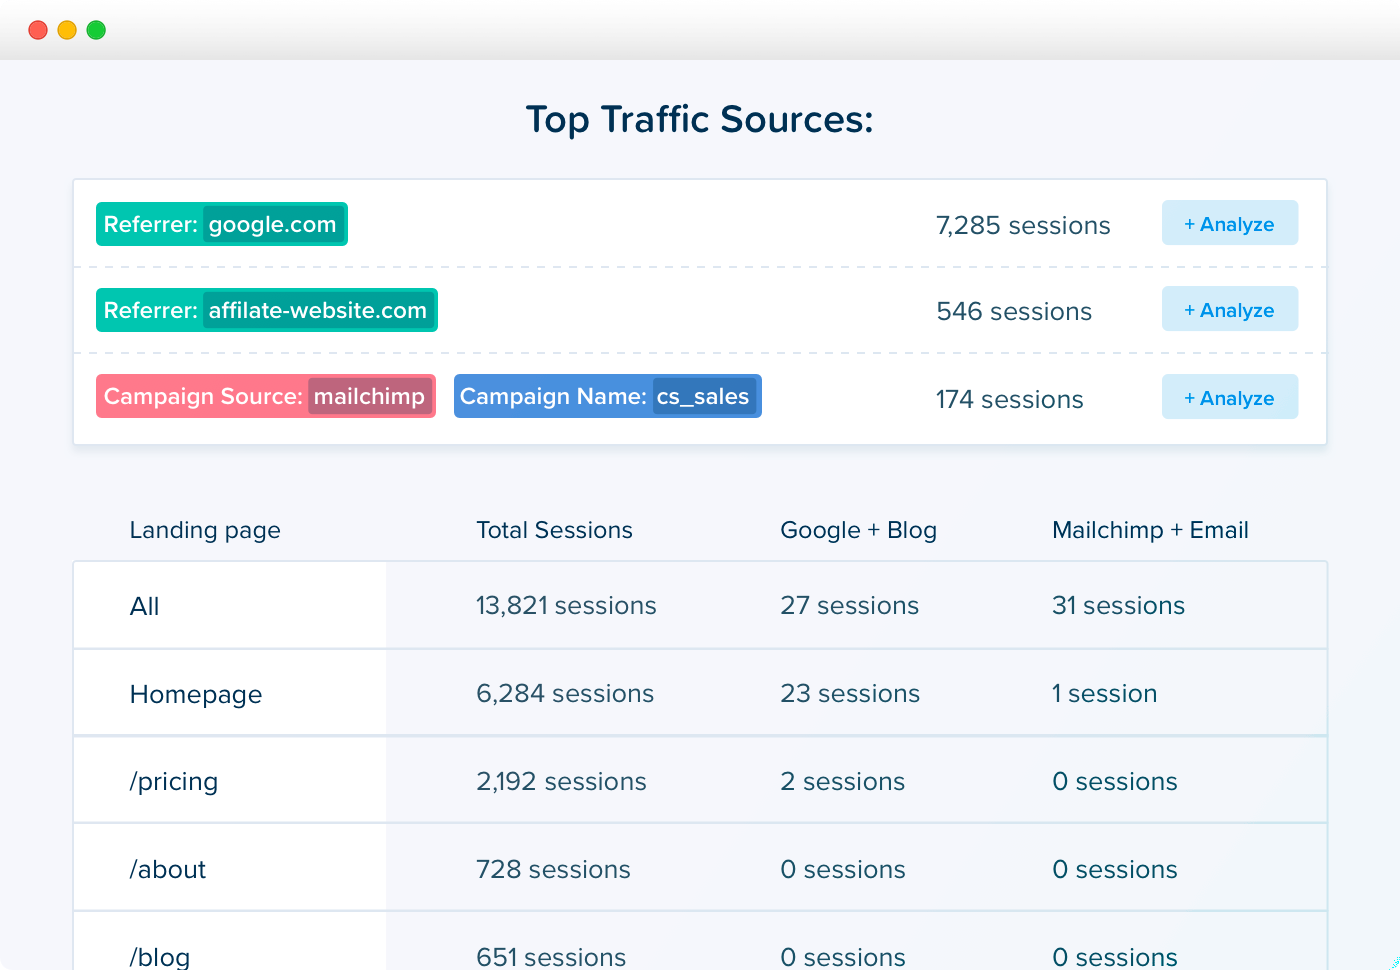
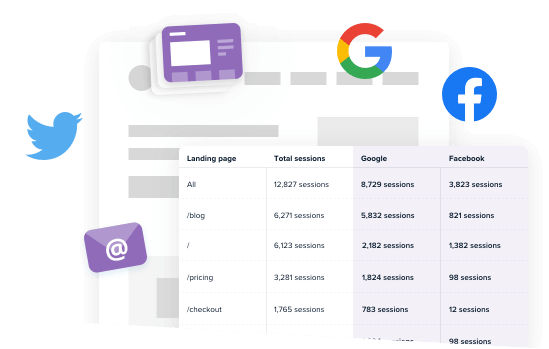
Compare and analyze traffic sources by channel
Get a clearer picture of how your traffic sources and marketing channels are performing. Compare traffic against each page of your site to see where one channel excels and another might need improvement. Oh, and view heatmaps and recordings based on your selections!
Start by analyzing your website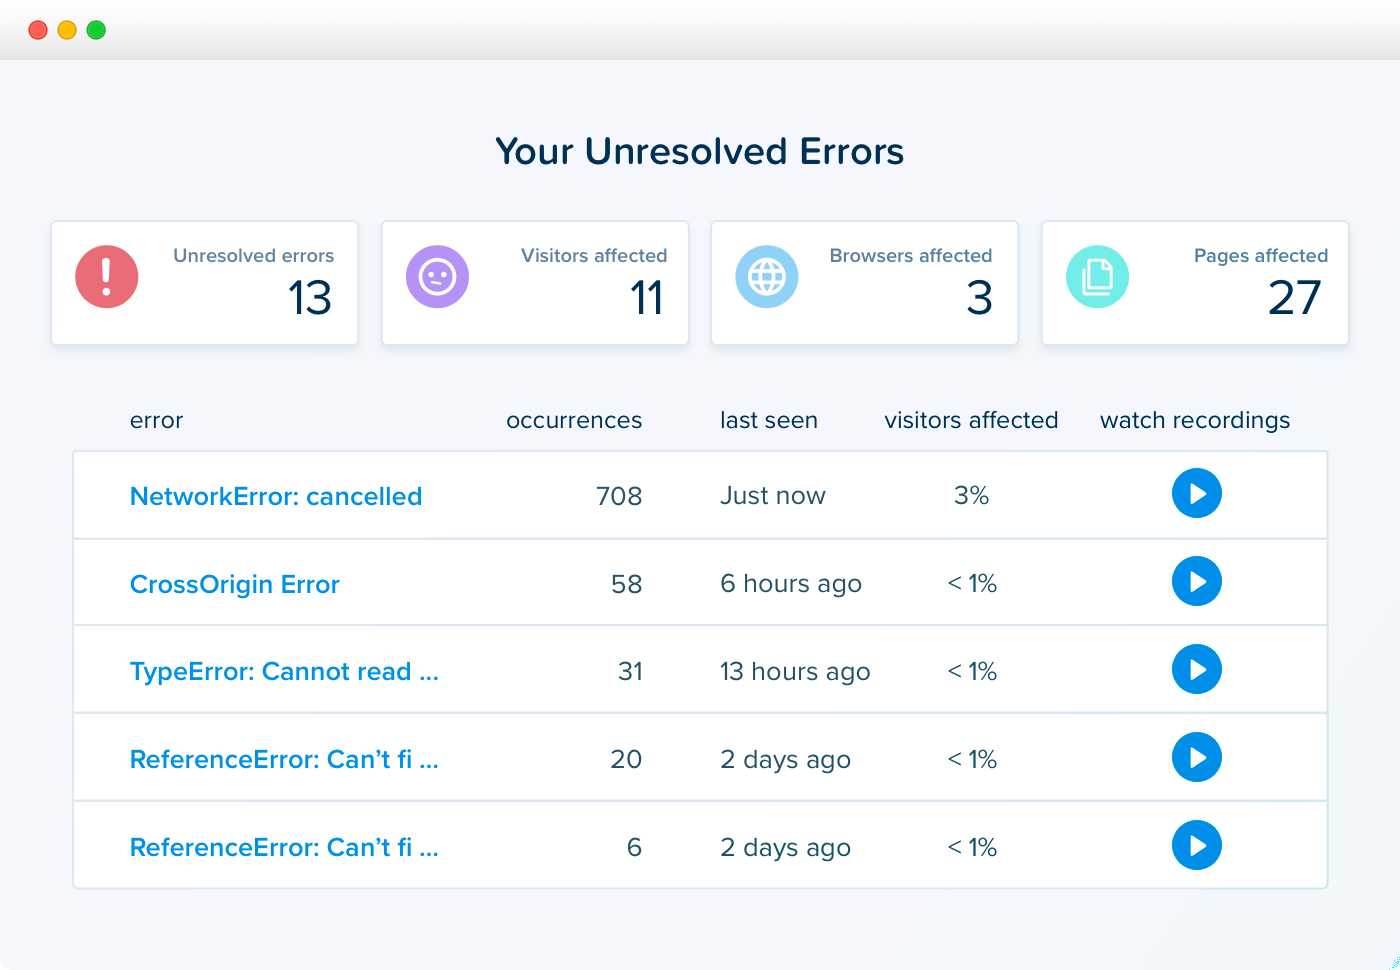
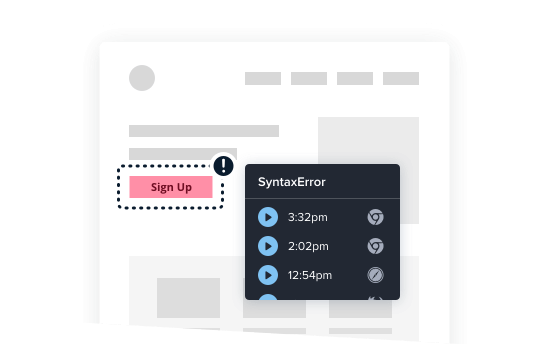
Find out if Errors on your website are preventing visitors from converting
Identify and fix issues on your website as they happen. Watch recordings of the errors happening, see how many customers the errors impact, and get detailed information to help triage and resolve errors quickly.
Start by analyzing your websiteMore reasons to love Crazy Egg
We're here to help you improve what's working on your website, fix what isn't, and test new ideas.
-

Easy setup
Integrations with popular services like Shopify and WordPress.
-

Teams
Add all of your team members free of charge.
-

Grows with you
Easy enough to get started. Powerful enough to customize.