Website Heatmaps
See where visitors are interacting with your site, so you can optimize page design and drive more conversions.
- Five ways to view and segment data for richer detail
- No sampling for greater data precision
- Unlimited website domains included
- US-based support team
Install in minutes • Free 30 day trial • Cancel anytime
Trusted by thousands of companies and marketers around the world:

Poor page design creates worse experiences and converts fewer customers
- Excessive content distracts visitors from your best-performing offers
- Confusing layouts and errors create user frustration
- Slow page load times drive users to leave, hurting SEO rankings
Website heatmaps help you see where to improve each page
-
Locate top-performing offers
High-click links are your most valuable content. Drive more attention to these and reduce friction to convert.
-
Remove barriers to conversion
Low-performing content often distracts users from higher-impact offers, or hides those offers by pushing them down the page. Either move distractions elsewhere or remove them.
-
Find where users get frustrated
Users rage click when they want to engage — but encounter dead space, missing links, slow loading, and more. Fix obstacles getting in their way.
Five ways to visualize, segment, and export your data
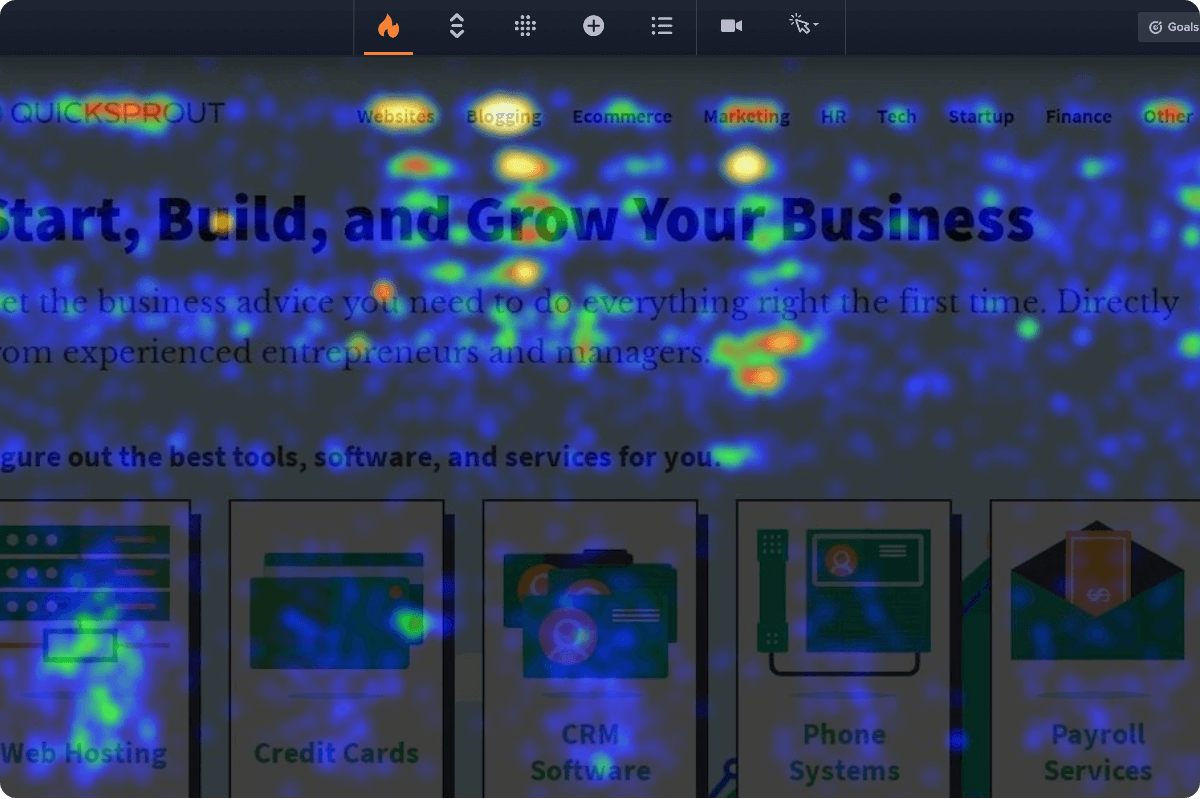
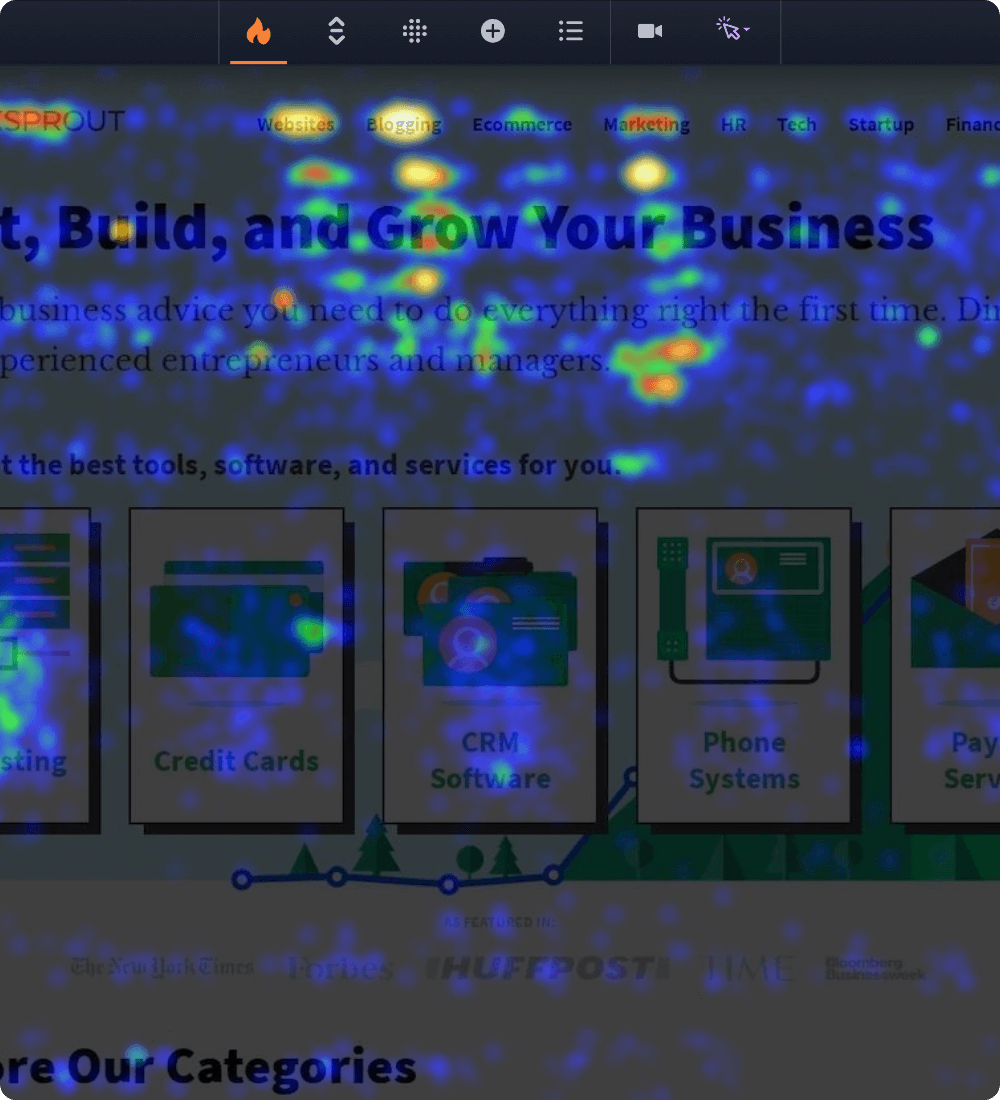
Click Maps
See which parts of each webpage are attracting the most activity. The more clicks an area receives, the brighter (or hotter) its color will be.
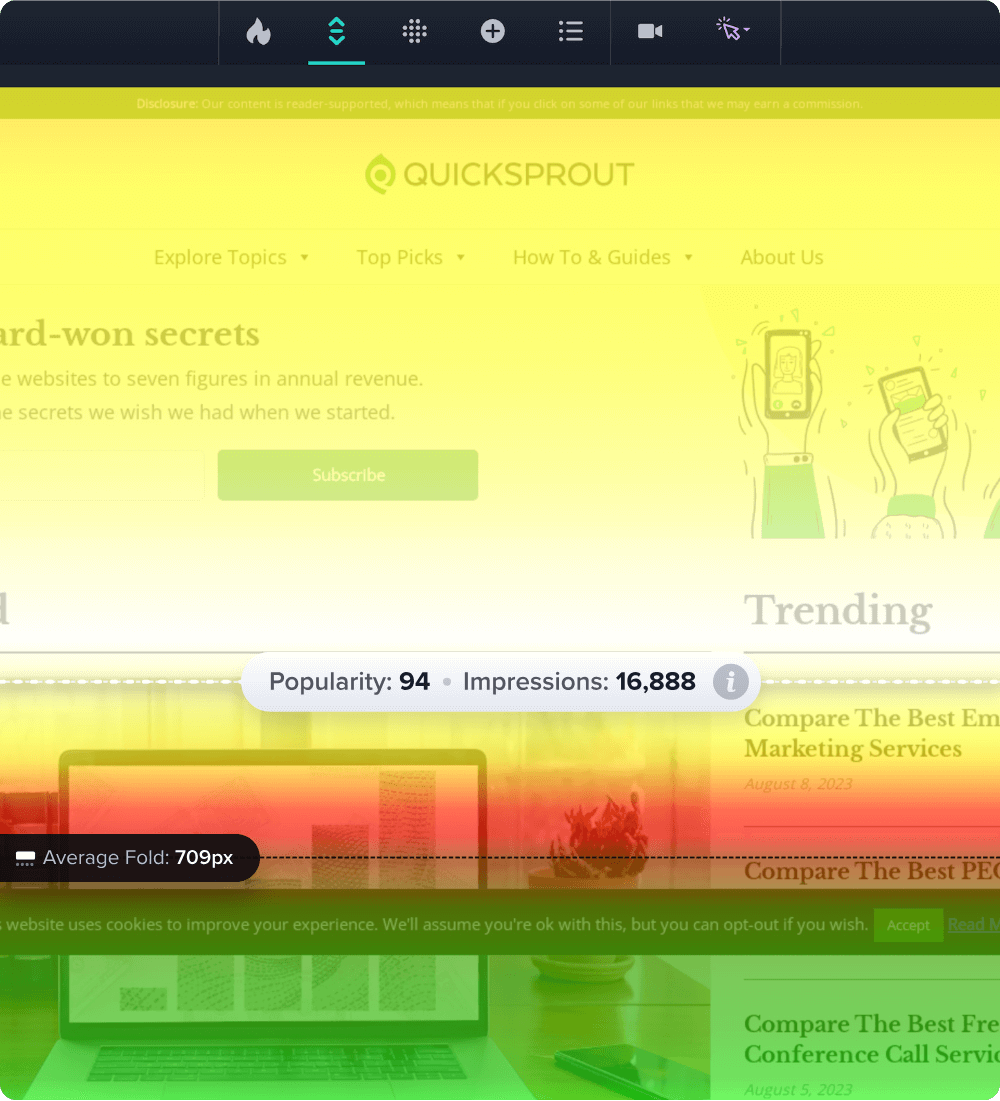
Learn moreScroll Maps
Know how far visitors are scrolling down, and which content they’re not seeing. Useful when deciding where to put buttons, forms, and other CTAs.
Learn more
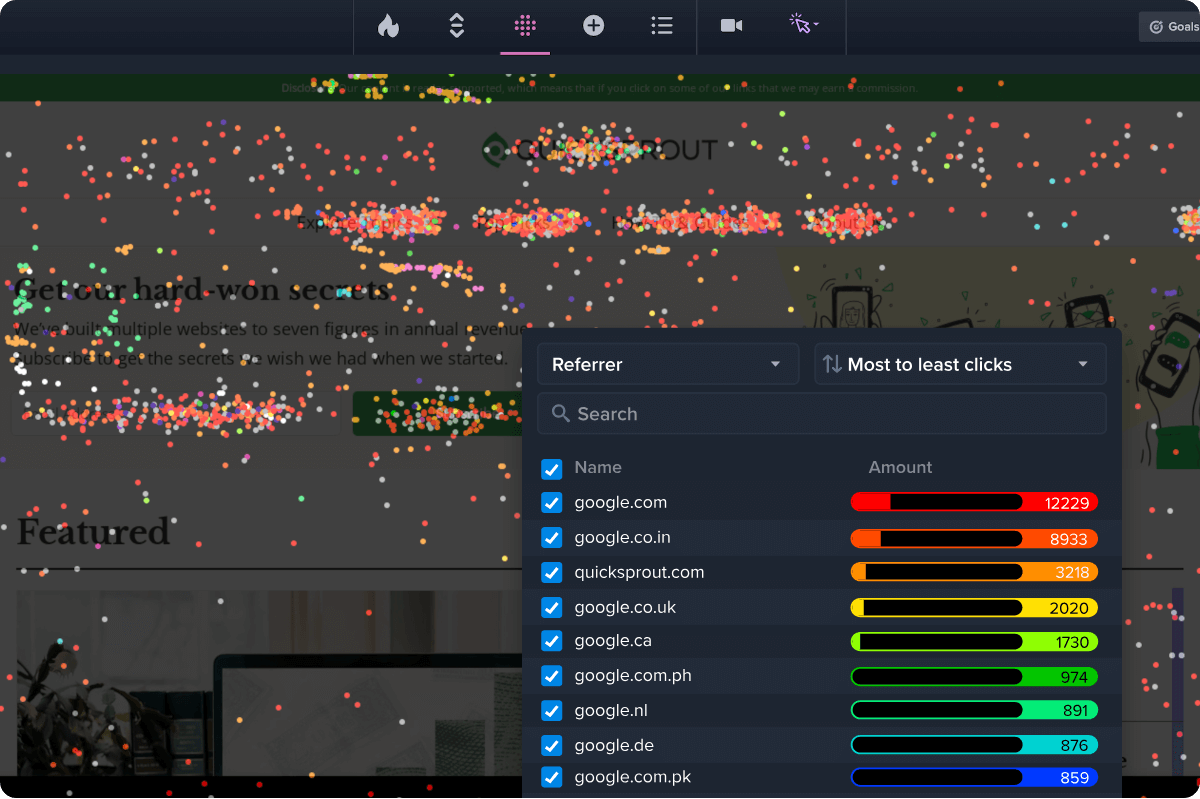
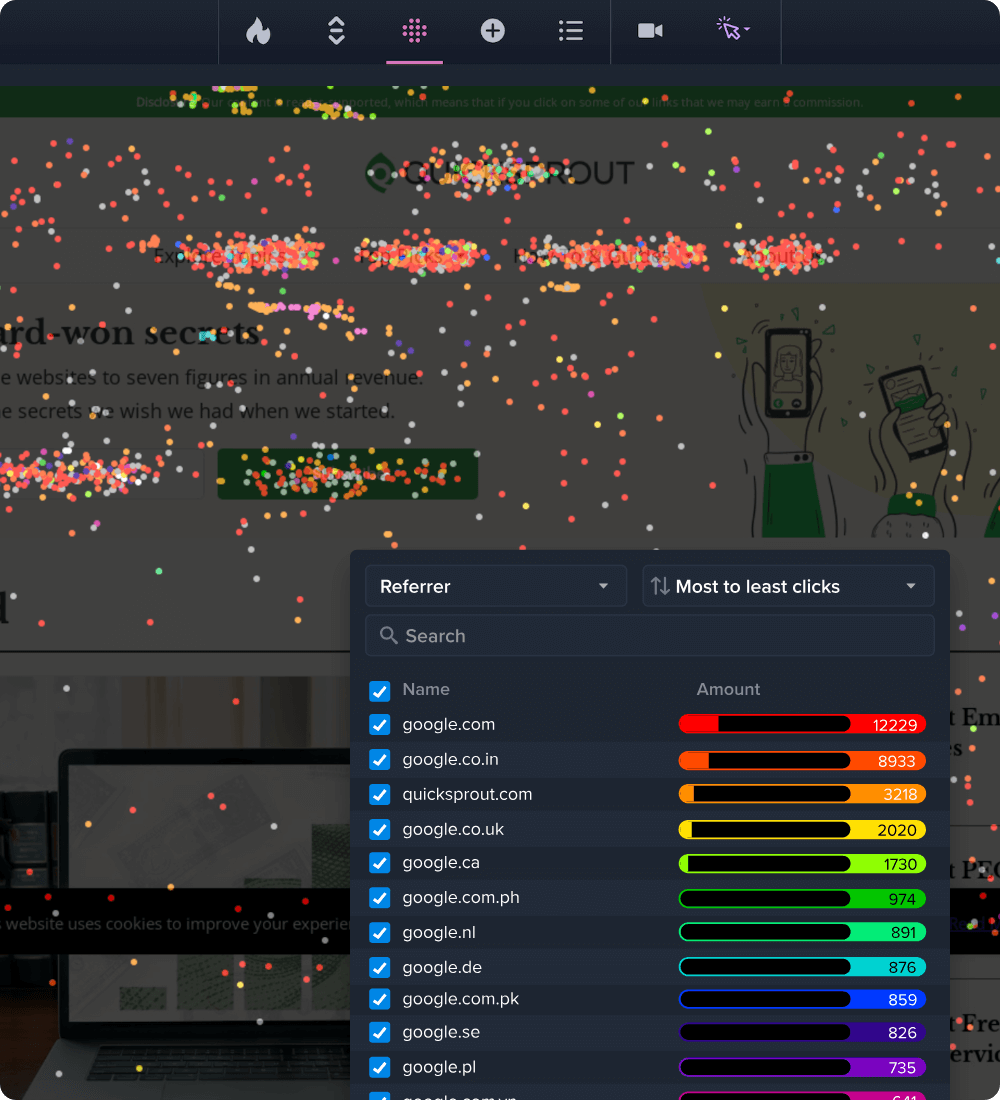
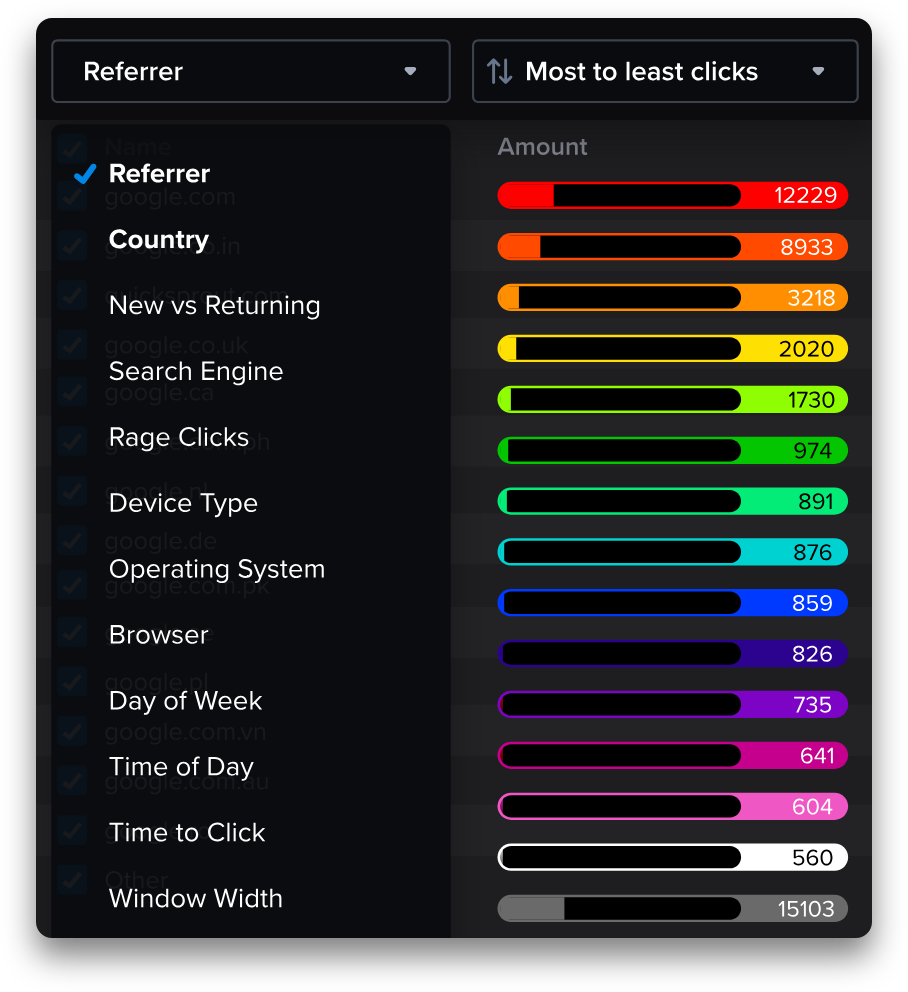
Confetti Maps
Get a precise look at individual clicks. Color-coded dots represent clicks that can be segmented by: traffic source, operating system, UTM parameters, and 17 other metrics.
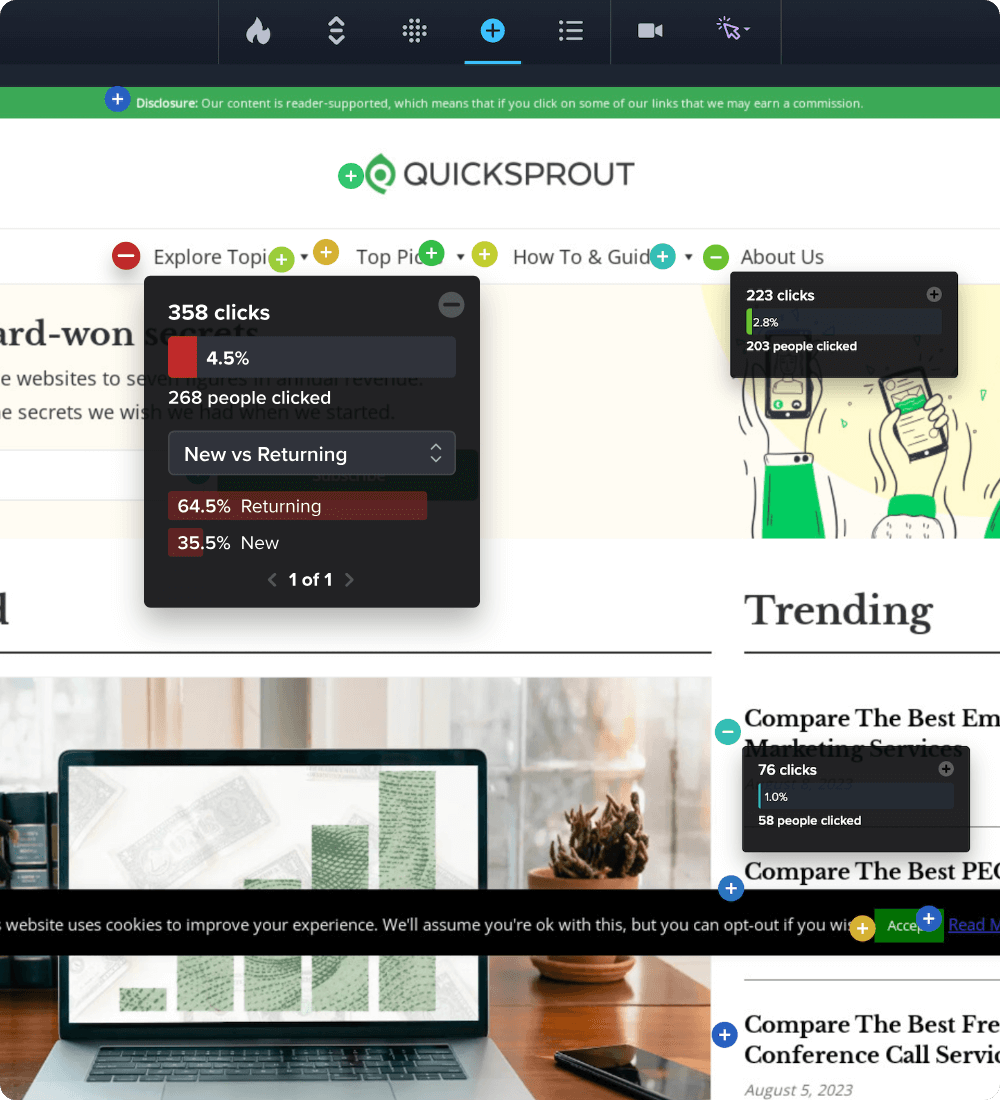
Learn moreOverlay Maps
Drill into click metrics for specific elements. This helps isolate each element’s impact on visitor behavior, and makes segmentation easy. Useful when deciding which CTAs are most popular.
Learn more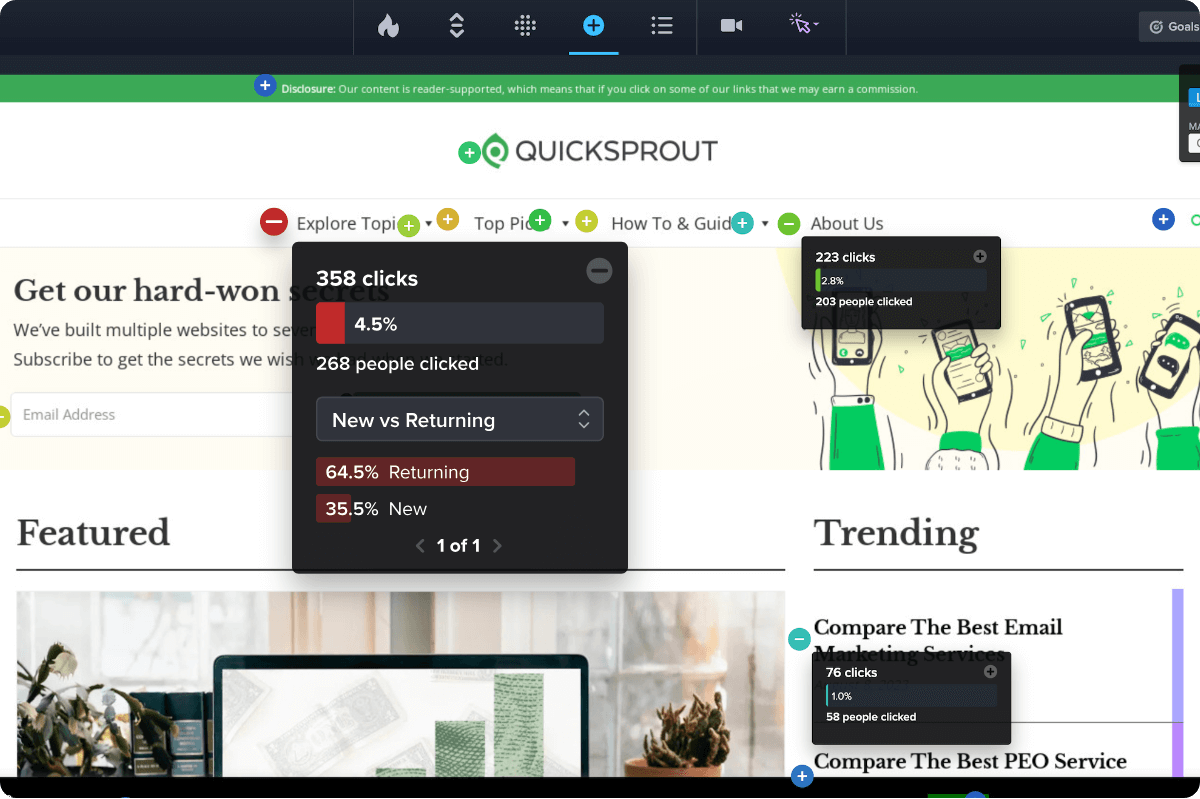
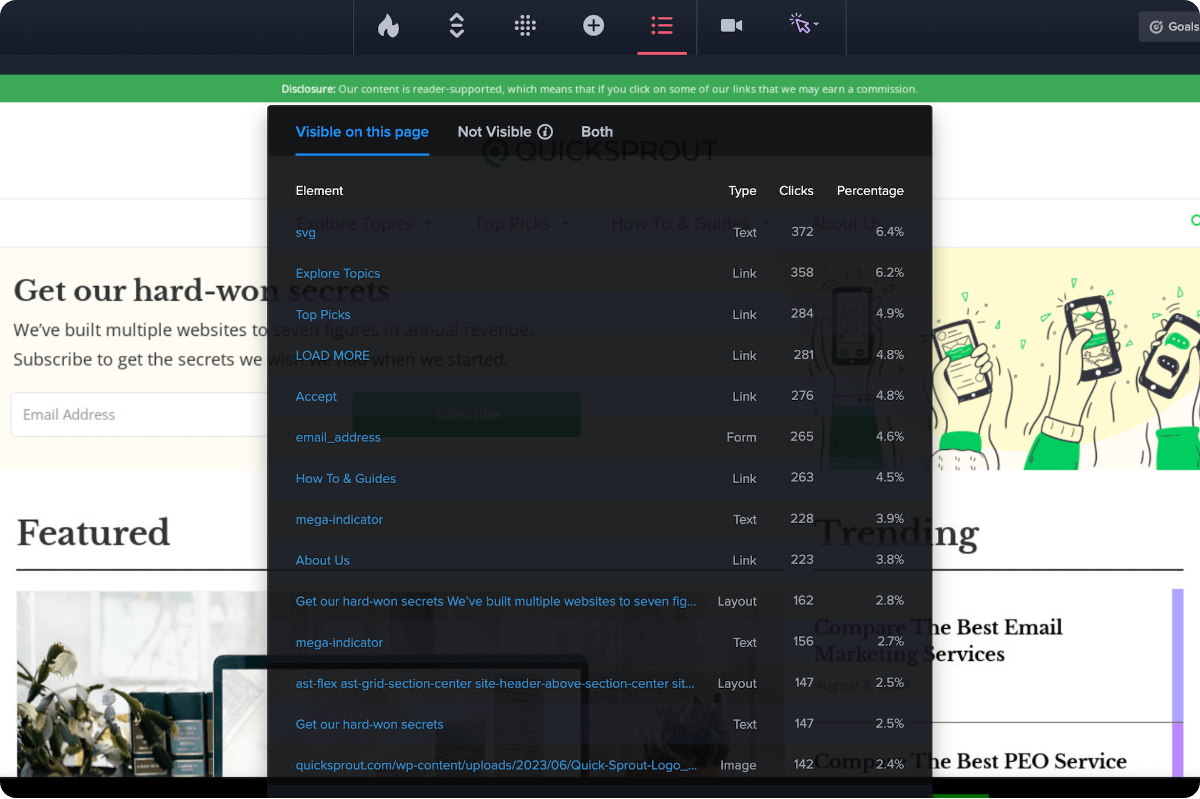
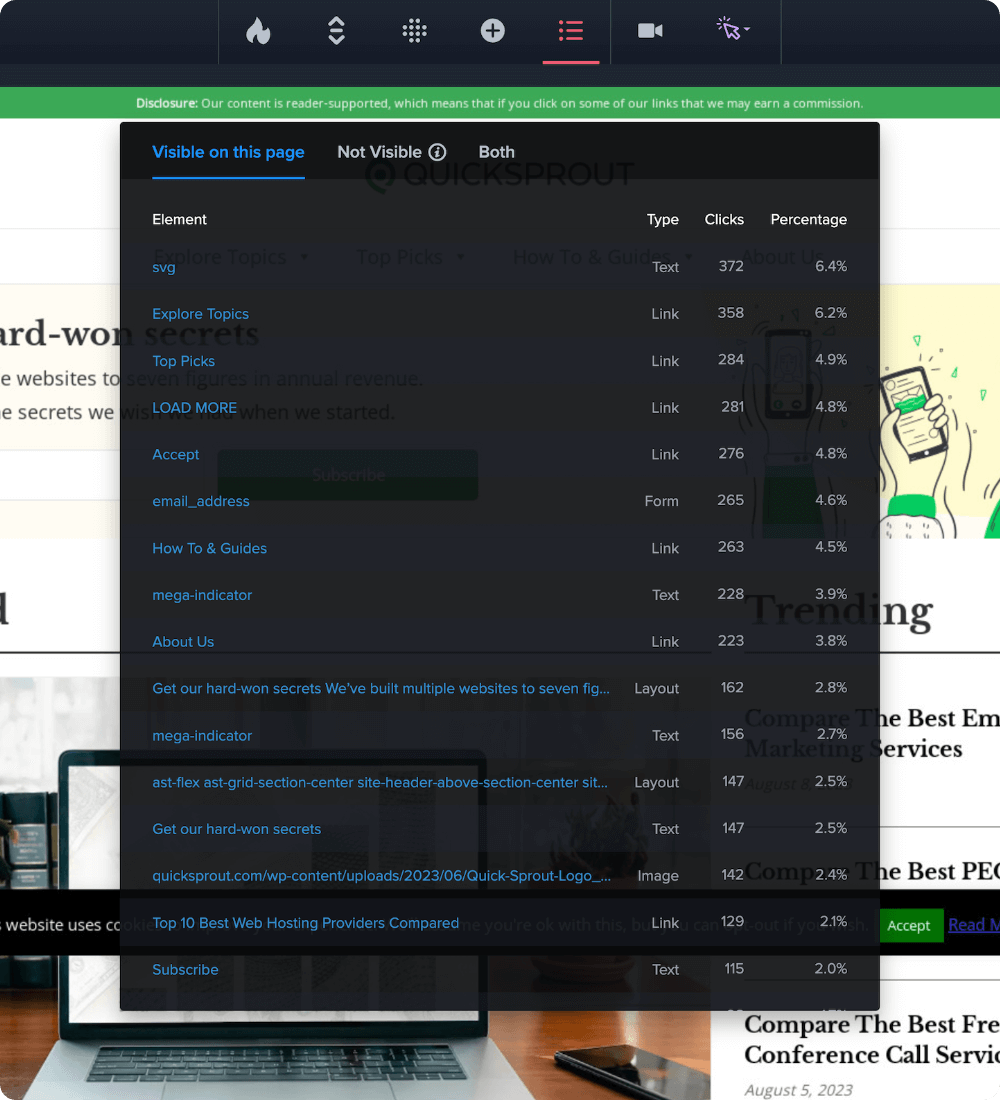
List Maps
A purely numerical report of the number of clicks on each page element. Ideal for when you want to export and slice the raw data yourself.
Learn moreCompare your heatmaps by audience segment
Behavior on your website can vary widely, based on who your users are and where they came from. Our Heatmap filters provide clarity on which users are driving the most engagement and conversions on your website.
Segment and export Heatmap data, based on 20+ audience filters covering:
- Date Range
- Traffic Source / UTM Parameters
- User Types
- Device
- Conversion Goals
- Your Custom Variables
Crazy Egg is the highest-ROI platform for
website optimization
-

All-in-one tools for Analytics and Conversion Testing
-

The best-value pricing
-

Priority Support
