Your marketing activities need to stay aligned with your company’s strategic business goals, evolve with the changing market conditions, and keep adapting based on the results they produce. Marketing reporting is an essential instrument for doing all this. It allows you to see what works best, present your results to others in your organization, and make informed choices that drive you forward.
In this article, we explore the main marketing reporting metrics, report types, and various best practices, including automation, visualization, and using templates.
You will also find plenty of marketing report examples to help you get started.
What is marketing reporting?
This is the process of collecting, organizing, interpreting, and sharing marketing data, such as campaign results or cross-channel analysis findings. The main goal of such reporting is to assess the effectiveness of marketing activities and glean the insights necessary for making informed decisions and accelerating progress.
If efficiently organized, marketing reporting can bring significant advantages to a company.
What are the benefits of marketing performance reporting?
Marketing performance should be closely monitored and analyzed to understand which tools and channels work best and to use this knowledge to improve the strategy. Here are the main benefits of reporting in marketing:
- Assessing and increasing efficiency. With a well-prepared marketing report on your hands, you can easily evaluate your marketing efforts and obtain the necessary information for improvements.
- Identifying potential issues and opportunities. Continuous reporting and analysis will help you reveal which activities can drive further growth, and which are, on the contrary, not producing the desired outcome.
- Providing the basis for decision-making. You can put forward hypotheses and run experiments to see if your marketing results confirm your assumptions. By analyzing your metrics, you can obtain important insights and make informed decisions.
- Enabling collaboration. Reporting in marketing is an essential part of teamwork. Presenting the results of your marketing efforts to your colleagues from other departments will help align different teams and coordinate your efforts for a more focused approach.
Types of marketing reports
To make your reports useful for the audience, it’s necessary to keep them focused. A report that includes too much information on several topics at once would be difficult to interpret, and important insights can get lost in too much detail or too broad a context. So, it’s helpful to determine in advance what type of report you want to prepare.
Marketing reports can be categorized by:
- Period: quarterly/monthly/weekly marketing report. This type of report allows you to focus on a specific period of time and track your progress, compare results with the previous period, and build predictions for the next one. In addition to this, preparing periodic reports is a good way to keep your data organized and easily available for further analysis. Many professionals working in a marketing department prefer to use a monthly marketing report. However, we recommend analyzing your data more often than on a monthly basis.
- Channel: cross-channel report, email marketing report, SEO report. With this type, you can dive into detail and get a granular view of your marketing efforts and their outcomes related to a specific marketing channel. Or, in the case of a cross-channel report, gather the most important data across different channels to see how they form a complete picture of your marketing activities.
Below, you can see an example of a self-updating cross-channel report created in Looker Studio (former Google Data Studio). The report is automated with the help of Coupler.io – a solution that automatically collects data from various sources (in this case, Google Ads, LinkedIn Ads, and Facebook Ads) and transfers it into this visualized report. We will explain how you can create auto-updating reports like this one in the Marketing reporting tool: an example section.

See the full version of the Performance by Ad group report in Looker Studio.
- Focus: general marketing report, campaign report. In this case, you need to decide on the focus of your report – what exactly do you need to cover? The answer depends on the audience and on the decisions you expect to make based on the information that you are planning to discuss. It can be a general report with the most important metrics, or, on the contrary, a detailed report that zooms into the campaign metrics.
Of course, these types can intersect – for example, there can be a monthly campaign report or a weekly cross-channel report. These categories can help you narrow down the field you are covering and make your reports more effective and relevant for the audience.
Some of the most important marketing reporting metrics – examples
There are dozens of different marketing metrics, and the exact set you need to track depends on the channel type and your specific marketing goals. In the table below, we’ve gathered some of the most common metrics that marketers use to measure success and efficiency. This is an example of what you might want to include in your marketing reports.
| Metric | Meaning |
| CPA (cost per acquisition) | The average cost of attracting a new active customer |
| CPL (cost per lead) | The average cost of creating a new lead, calculated by dividing your marketing spend by the number of leads |
| CLV (customer lifetime value) | A projected income from one customer that is expected to be received during all the time a customer remains active |
| CTR (click-through rate) | This metric shows how many users from the total viewers number clicked on an ad, link, or button with a CTA (call to action) |
| Bounce rate | The proportion of a web page’s viewers who left the website without viewing other pages |
| Lead-to-customer conversion rate | The percentage of new leads that convert into active customers |
| Website conversion rate | The proportion of website visitors who make a purchase/order |
| Engagement rate | The level of interactions received by a piece of content |
| Unsubscribe rate | The percentage of people receiving emails from a business who unsubscribed during a specific period |
For example, in the Facebook Ads report below, you can see such important metrics as CPA, CTR, conversion rate, and others. This dashboard is interactive – scroll down to see more.
This report is available as a free template. We will talk about marketing reporting templates a bit further.
How to make online marketing reporting effective – an overview
Here are some tips that can help you make the most of your reporting in digital marketing.
- Focus on the audience. Structure your reports around the audience’s needs, include the relevant information, and omit unnecessary details. If your report is meant for other teams, make sure to adjust your language and include an explanation for the terms, if necessary.
- Make it actionable. Keep in mind the goal of the report – what steps should be taken after discussing it? What should be clarified? What can provide a basis for informed decisions? Include the data that can help your team achieve the goal. Staying focused is especially important for digital marketing reporting because of the massive amount of data that is available in minute detail.
- Implement standardized practices. Streamline processes, use templates, and adopt a systematic approach to digital marketing reporting. This will help you keep data organized, regularly review your results, and constantly improve your strategy.
- Leverage automation. Digital marketing reporting can be easily automated, and it’s recommended to introduce automation as early and as much as possible. This will save you time and effort and make the marketing reporting process better organized.
Now, let’s zoom in and explore in more detail how marketers can make their reports a success.
Marketing reporting – best practices
In the previous section, we’ve listed some of the main principles that help make marketing data reporting a smooth and efficient process. In this chapter, we’ll provide a detailed explanation of the best practices in marketing reporting.
Most of these practices can be used both for digital marketing reporting and for traditional marketing reporting. However, some of them can only be implemented for digital channels. We didn’t split them up into separate lists as most marketers nowadays use at least some of the digital marketing channels, and, therefore, these tips can be helpful and relevant for most marketing professionals.
1. Ensure regular marketing reporting in your organization
It might look quite logical to build a comprehensive report for an important meeting or at the end of a big campaign. And there’s nothing wrong with preparing a tailored document for a specific event. However, sporadic marketing data reporting isn’t the best way to organize this process.
To extract maximum business value, it’s better to make it consistent. If you collect, organize, and review your marketing information regularly, you can work with your data much more efficiently. This allows you to:
- Keep your data well-organized and ready for further processing.
- Conduct deep analysis comparing your marketing results for different periods.
- Regularly review your progress and make incremental improvements to your marketing strategy.
- Keep everyone on the same page and provide the necessary updates for the team, helping them make informed decisions.
You can decide on the interval for reporting based on your needs and activity level. For some channels, weekly or even monthly reports will be enough. For others, you might want to organize regular marketing reporting daily.
It is also a good idea to keep your reports outside of the apps where the data accumulates. For example, if you use Mailchimp, you can export and store Mailchimp reports in a spreadsheet. In such a case, this data in the external file can also serve as a backup copy, which is also useful.
As an option, you can use automated scheduled reporting to ensure regularity. This allows you to streamline this process without investing time into preparing reports manually.
2. Leverage automated marketing reporting to streamline the process
Automation is a powerful instrument that can take your marketing data reporting to the next level. It saves enormous amounts of time, eliminates human errors, and efficiently automates your data flows.
There are many ways to automate marketing data reporting. The methods can vary from using simple add-ons to automation tools or even custom software tailored to your company’s specific needs and processes. The solution you need depends on the amount of data you need to process, the number of tools your organization uses for collecting data, as well as other factors.
As an example, with several data integrations, you can have your data automatically transferred from multiple marketing channels into a spreadsheet, a BI tool, or a database. You can also build a self-updating report or dashboard in the destination file. We give a more detailed explanation in the Marketing reporting tool: an example section.
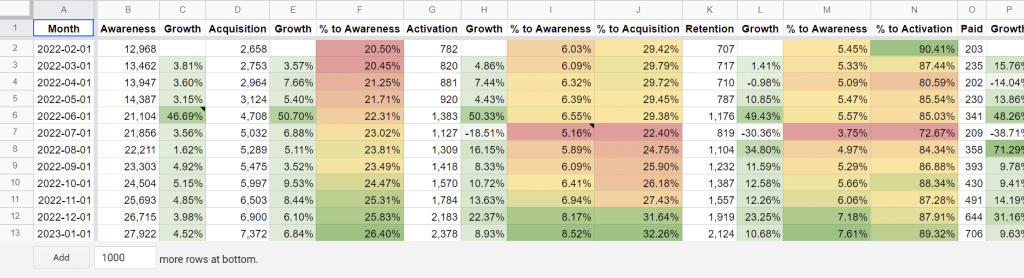
Above, you can see an example of an automated product funnel report built in a spreadsheet. This report is powered by Coupler.io – this tool regularly fetches fresh data into the spreadsheet, making this report self-updating. Automating your reporting like this saves an enormous amount of time. In addition, it also gives you access to always fresh analysis-ready data, which enables you to make decisions faster.
3. Visualize data and use digital marketing reporting dashboards
Whether your reports are meant for internal use or for presenting your marketing results to your CMO, CEO or to the sales team – visualization is a great way to organize data in a concise and compelling way. When presented in a form of graphs, diagrams, or charts, your data is easier to understand, review, and analyze.
Here’s an example of data visualization that helps monitor efficiency and make data-driven decisions. This is an interactive product funnel dashboard where you can track the most important marketing and product metrics (according to the AARRR framework).
View the dashboard in Looker Studio
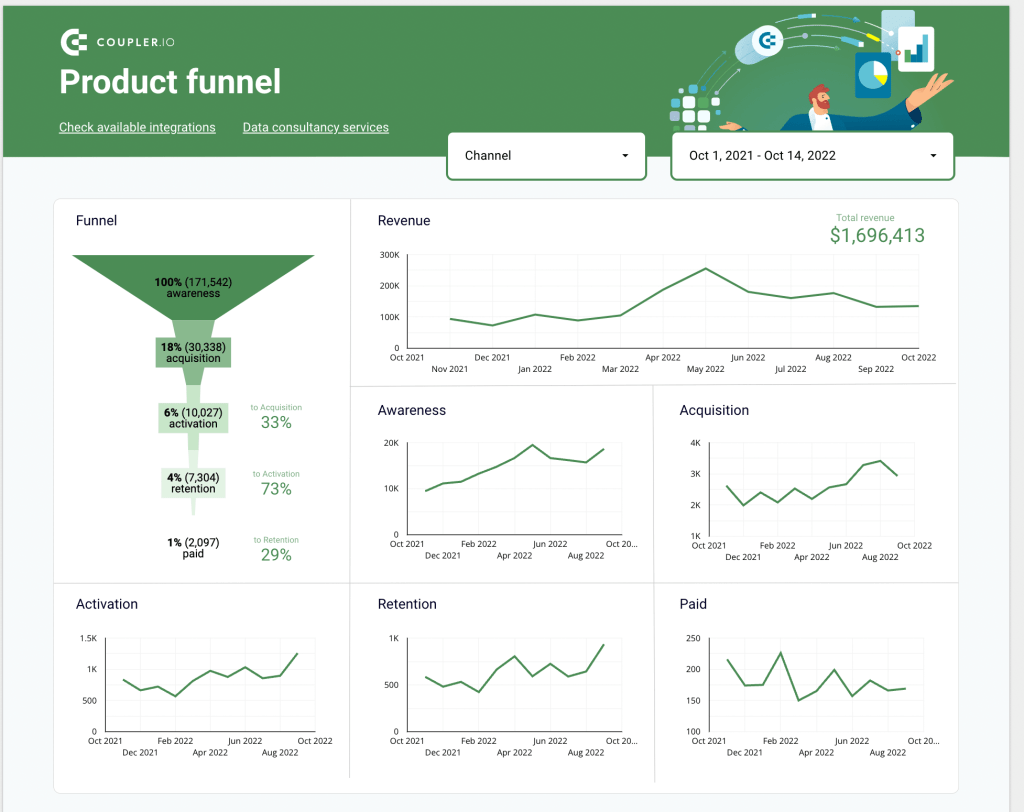
This dashboard is self-updating. It takes data from a spreadsheet, which is connected to several different data sources.
This marketing dashboard in Looker Studio is self-updating. It takes data from a spreadsheet, which is connected to several different data sources. These automated connections, or integrations, are set up with the help of an ETL tool, which is a part of a popular data analytics and automation platform, Coupler.io. In particular, it allows you to automate data flows and export data from about 50 apps. Coupler.io regularly fetches refreshed data from the selected data sources to the spreadsheet, and the dashboard immediately reflects the changes. The solution can also be used to connect marketing apps directly to Looker Studio or Power BI, without the spreadsheet.
As we’ve already mentioned, this marketing dashboard is interactive. You can switch between different time periods, zoom into your KPIs, or explore the funnel separately for each channel (such as paid, organic, referral, etc.). This allows you to explore and analyze the user journey from various angles and determine what drives results most efficiently.
Marketing data visualization like this one can be a powerful tool for decision-makers. Using a self-updating dashboard also eliminates the need to check many different data sources manually and waste time combining the latest data in one place. Such dashboards can help track the efficiency of experiments, build forecasts, track processes, and more. This is a great tool for marketing reporting, and for data analysis as well.
Take a look at other visualizations – Ad groups performance dashboard, Ad campaigns dashboard, and other examples.
4. Use templates to standardize marketing reporting
If you perform marketing reporting regularly and mostly monitor the same metrics, then, of course, it makes no sense to start from scratch every time. It’s very helpful to prepare a set of various templates that can be used for different purposes – for example, for different audiences. You can have a template for a more detailed report built for your team, and another, more brief and focused, for your CEO.
Templates are a great way to save time and effort. You can find a lot of examples and even free downloadable templates online. You can also create templates on your own from scratch – it will take some time, but you will get a fully customized set of templates.
When talking about reporting in digital marketing, it also makes sense to use automation, for example, with marketing dashboard templates in Google Sheets. In this case, you can easily plug in your marketing data sources into your templates, and the updated data will flow automatically. Thanks to the templates, your custom metrics and other parameters will be self-adjusting after each update according to the latest information. This means that the numbers in your reports will always be up-to-date, basically without any manual effort.
Let’s take a look at several automated templates for marketing reporting. They will be helpful to you if you use Google Ads, Facebook Ads, LinkedIn Ads, and YouTube.
Google Ads dashboard – a free template
Here’s an example of an automated marketing dashboard template (the dashboard below is interactive – scroll down to see all blocks). You can use it to visualize your data automatically and get a copy of this dashboard with your data literally in minutes.
You will only need to connect your Google Ads and Looker Studio account. As this template is automated with Coupler.io, your dashboard will be self-updating. Coupler.io will transfer fresh data from your Google Ads account to the dashboard according to the schedule you specify. As a result, you will get an ever-green visualized report that always shows the latest data.
See how to use this dashboard for free.
Facebook Ads dashboard – a free template
Tracking KPIs is essential for social media marketing. This dashboard allows you to closely monitor key metrics and quickly make adjustments in response to changes. Using this visualized dashboard, you can easily see what is working best and decide how to reallocate your ad budget for best results.
This dashboard is interactive. Scroll down to see more metrics.
See how to use this dashboard for free.
LinkedIn Ads PPC dashboard – a free template
This automated dashboard allows you to track key performance indicators and easily analyze your metrics. This enables you to gain full transparency and improve campaign performance with data-driven decisions.
With this out-of-the-box template, your LinkedIn Ads dashboard will be ready literally in minutes.
See how to use this dashboard for free.
YouTube Channel Overview dashboard – a free template
With this visualization, you can monitor such metrics as engagement rate, subscriber dynamics, views, shares, likes and dislikes, and more. It also allows you to analyze your audience in-depth and from different perspectives, from geography to device type.
See how to use this dashboard for free.
To learn more, check our article on 12 best marketing reporting templates.
Interpret the numbers for your audience
Some mistakenly believe that the goal of a report is to show the metrics as is and just provide a general commentary explaining whether these results are good or bad. However, an effective report should be actionable, so it must provide the basis for decision-making. Things that might seem transparent and obvious to you can look totally different to people on another team or to your CEO.
Where you see trends and clear correlations, others might see just rows of obscure numbers. So it’s not helpful to assume that others can see things the same way you do. It’s worth remembering that a report, after all, is a form of communication. Therefore, your task is to present information in a clear and understandable way.
Don’t leave your audience alone with numbers – include interpretations, highlight the most important metrics, list the main takeaways, and provide a short summary. Focus on end results rather than details, and explain how your efforts fit into your company’s strategy and align with marketing goals. Make sure that numbers illustrate your conclusions, not substitute them.
In general, a good report should answer questions such as:
- What do these numbers mean?
- How can we use this information to improve our strategy?
- Why is it important? Why should your audience pay attention to this report?
If your organization collects a lot of data, your marketing team may need the help of data analytics experts to interpret it and derive quality insights. In such a case, requesting data analytics consulting services may be a good idea to streamline your processes, define key metrics and main correlations, and create custom templates and dashboards. Once these solutions are in place, your team will be able to use them independently. Such collaboration with an experienced data analytics consulting partner can be rather beneficial and can significantly increase the quality of your data management and analysis.
Make your report clearly structured
Journalists usually structure information in news using the inverted pyramid principle. When preparing a marketing report, this structure can be useful as well. To understand how it works, imagine a triangle with its broader part on the top and its pointed part on the bottom. According to this principle, the most important information should be placed first, and it should take most of the space. Then, the essential details should follow, but they should be given less space. In the end, non-essential details conclude the story – this is the pointed part of the triangle, so they take relatively little space.

In journalism, one of the reasons for using this structure was that an editor could cut the story at the last moment to make it fit onto the newspaper page. With this approach, it was easy to quickly cut off the end of the story – as all the essential information was already given at the beginning, so the readers wouldn’t miss anything substantial.
In marketing reporting, this is a helpful approach as well. Even though nobody will cut off half of your report, still, human attention is very limited. So, you shouldn’t assume that your audience will diligently read everything from the beginning to the end. Most people pay attention to the beginning and then just skim the rest.
Make sure to put the most important and juicy results first, accompany them with a short summary, and provide a brief interpretation. Then, you can include less important details. Don’t forget to add headlines, bulleted lists, graphs – anything that can make your report easy to skim. If your audience is interested in some particular aspect, they should be able to easily find it. And even if they never make it past the first couple of paragraphs – you should ensure that the main takeaways will reach them anyway.
A good report should help your clients or colleagues understand the overall performance, how it looks in relation to the goals you needed to achieve, what was accomplished, and what steps can be taken next. It’s better to avoid so-called “vanity metrics” that might look good but, in fact, don’t provide much value. For example, website traffic numbers can look impressive, but what really matters is the conversion rate.
Marketing reporting tool: an example
One of the best things about reporting in digital marketing is that it can be easily automated. As you already know, automation can be very different – from add-ons to complex custom-developed software. In this section, we’ll show you how to automate your digital marketing reporting with the help of Coupler.io. As we’ve already mentioned, Coupler.io is an all-in-one data analytics and automation platform. It helps businesses intelligently automate data flows, streamline reporting, and derive insights from raw data. In particular, Coupler.io provides data analytics consulting services and offers a reliable data integration solution. In this example, we’ll use the latter to automate the reporting process and fetch data from various sources to the report template.
The full data sources list includes Google Analytics 4, Mailchimp, Google Ads, Facebook Ads, LinkedIn Ads, Shopify, Pipedrive, Salesforce, and more.
Coupler.io can automatically extract, transform, and load your marketing data, so that you can create marketing reports in data viz tools (Looker Studio, PowerBI, Tableau), spreadsheets (Google Sheets, Excel), or load data into marketing data warehouses like BigQuery. Another useful feature is automatic updates. You can set a custom schedule and refresh your data without any manual effort. In addition to this, Coupler.io can be used to blend data from different apps into one dataset.
Spreadsheets are quite handy for creating custom reports, calculating metrics, or presenting your data in a dashboard. Data viz tools are also great for reporting as they allow you to turn your data into impactful visualizations.Coupler.io can ensure a stable flow of fresh data to power your report, whatever form it takes. It will help make your digital marketing reporting a smooth and hassle-free process.
Let’s now have a more detailed look at how this works.
1. Extract data
- Once you create a Coupler.io account, you can add your first importer. In this example, we will export data from Google Analytics 4 to Google Sheets. To do so, we must select the data source and the destination for the importer.
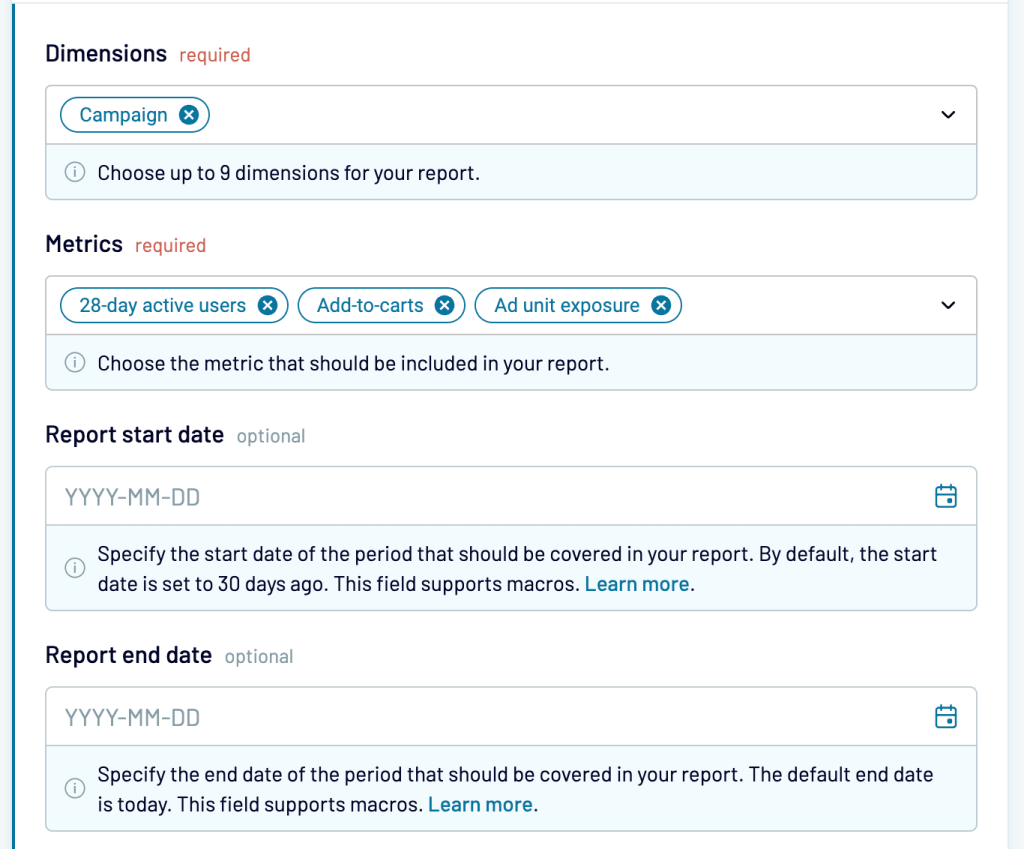
- The next step is connecting your GA4 account, specifying the sub-account and property for exporting your data, and selecting some other settings. For example, you can choose what metrics and dimensions should be included in your report, as well as specify the time range.
2. Transform data
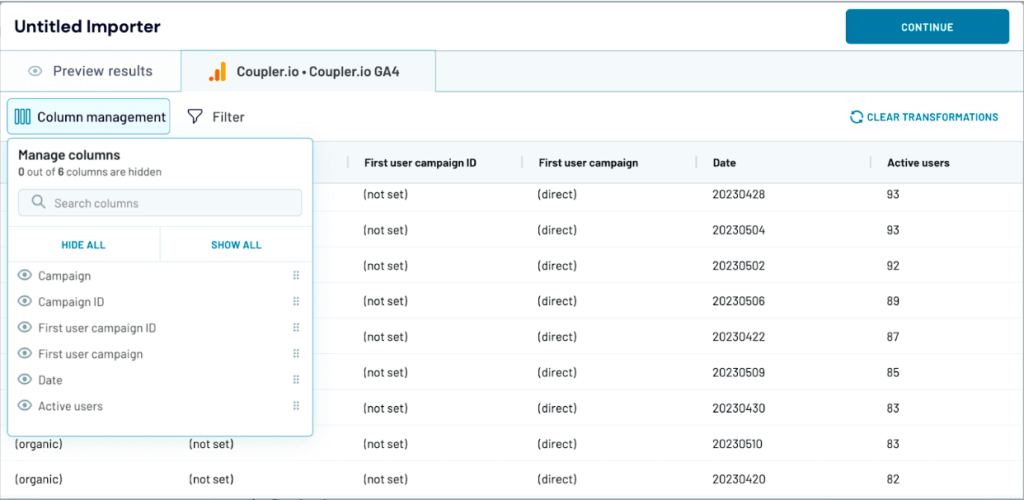
- Once Coupler.io loads your data, you will be able to access the Transformation module. Here, you can preview the data you are exporting and perform various transformations.
- For example, you can sort and filter your data, add and delete columns, as well as rename and reorder them. Apart from that, you can add new formula-based columns and calculate custom metrics directly within the Coupler.io interface. If you need to export data from several GA4 accounts, you can use the Transformation module to blend data from different accounts into one dataset.
- In addition to this, Coupler.io can be used for extracting data from several sources and importing it into one place. For example, you can add several data sources to your importer and load your marketing data from various apps into one spreadsheet or a database. In this case, Coupler.io will perform data stitching: it will put data from the same category into one column and add data from a unique category as a separate column. You will be able to check and edit the blended dataset in the Transformation module.
3. Manage data
- Then, you’ll need to connect your Google Sheets account and select the spreadsheet and the sheet where to place your data. Usually, it makes sense to have a sheet where all the raw data loads and a separate sheet with the report template or dashboard linked to the first sheet. And, of course, you can use this data to power several dashboards or custom reports. After this, specify your preferences for automatic updates.

- Once this is done, you can run the importer, and your data will be transferred automatically. Here’s an example of raw data exported from GA4 to Google Sheets:
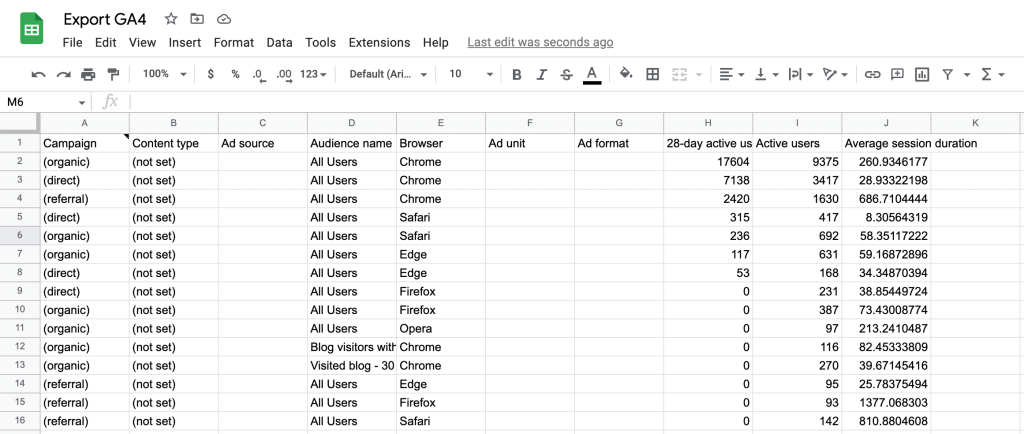
Now this data can be used for creating a customized web analytics dashboard. Coupler.io will keep data in the spreadsheet fresh, transferring the latest data from GA4 to Google Sheets automatically on a schedule.
In this example, we transferred data from GA4 to Google Sheets. However, Coupler.io can also send data from different marketing apps directly to Looker Studio, Power BI, Excel, and BigQuery.
How to schedule automated reporting in marketing?
You can use the same marketing reporting tool, Coupler.io, to automatically keep your marketing reports up to date. To do so, you will need a template or dashboard connected to your data source via a Coupler.io integration (we’ve covered this in more detail in the previous section). Once this is done, you can schedule automated updates and have your reports refreshed on a custom schedule.
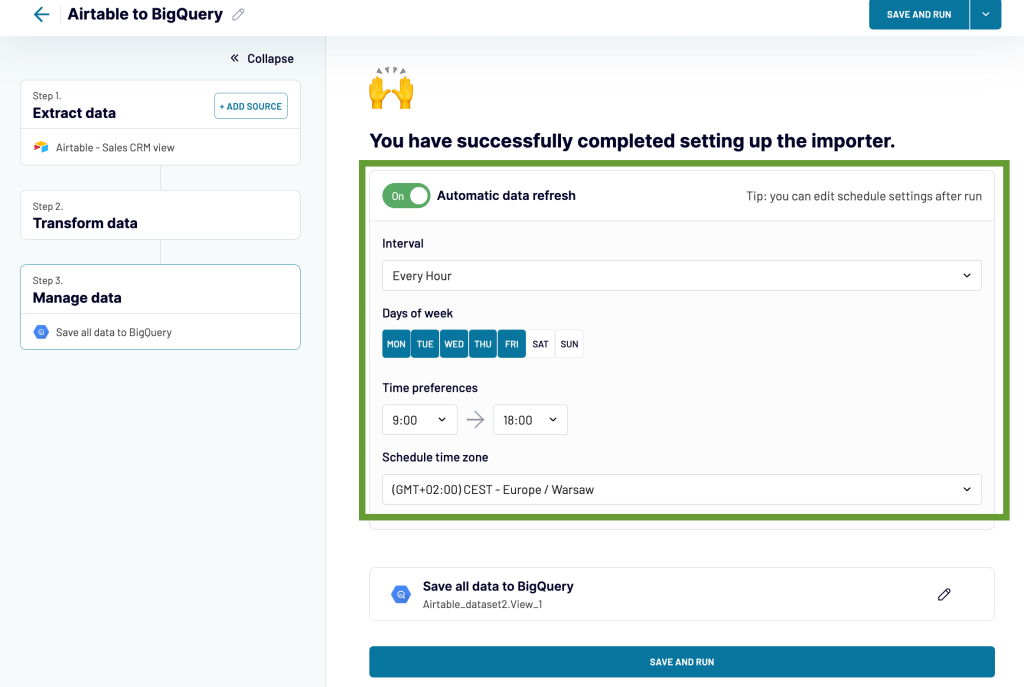
To do so, go to the Schedule section of your importer and toggle on the Automatic data refresh feature.
You will be able to select the days of the week and the times when Coupler.io should fetch the latest data from your sources and update your reports automatically.
For example, for a weekly report, you can schedule an update at 9:00 am on Fridays. Or, if you are running an important campaign and want to monitor the results in near-real time, you can schedule updates every 15 min, 24/7. The solution allows you to flexibly adjust the schedule to your goals and processes.
Using automation makes reporting in digital marketing a much simpler, faster, and more efficient process. Considering that marketing reporting should be performed regularly, automation saves enormous amounts of time and effort, so it’s definitely worth considering.
What is the best way to organize digital marketing reporting?
In this article, we’ve explored some best practices, tips, and examples that can help you streamline your marketing reporting process. From content marketing to SEO and email campaigns, every marketing activity requires regular reporting. When organized properly, the reporting process can boost efficiency and positively impact marketing ROI. After all, return on investment is one of the most essential KPIs for stakeholders. This is important both for marketing agencies and for marketing departments working in different industries – ecommerce, finances, healthcare, and retail. A good analytics report will give you invaluable insights into target audience behavior and provide a basis for optimization and growth.
To sum up, the most important things are to make this process consistent and regular, to optimize your efforts with the help of templates, standardized processes, and automation, and to make your reports actionable through instruments like data visualization, marketing data analytics, and interpretation.
If you’re still at the beginning of this journey, then your team might need some help from a data analytics consultancy partner, such as Coupler.io. This can be an efficient way to streamline processes, set data analytics infrastructure, or build advanced tailored dashboards that will help you extract maximum value from your marketing data and make your company more data-driven.


